Configure IoT Networks
|
Where Can I Use This? |
What Do I Need? |
|
|
IoT Security combines networks and sites to create a comprehensive model of your organization's network topology. This integrated approach enhances device discovery, classification, and risk assessment capabilities.
Networks form the foundation, representing logical groupings of IP subnets that align with your network infrastructure. IoT Security learns about your networks by observing firewall traffic, IPAM integrations, SNMP crawls, and manual user subnet upload. IoT Security also creates CIDR blocks where appropriate based on discovered subnets. You can define network segments within these networks to further refine device organization and policy application when different sites use overlapping IP addresses. This granular approach allows you to group devices with similar functions or security requirements, enabling more precise control over your IoT environment.
Sites overlay your network architecture, representing physical locations or logical groupings of your infrastructure. The site hierarchy facilitates efficient multi-site management and location-specific policy implementation. You can create parent sites for larger entities like countries or regions, and child sites for specific locations such as individual offices or campuses. This structure mirrors your organization's layout, making it easier to manage devices across diverse geographical or organizational boundaries.
By integrating networks and sites, IoT Security develops an understanding of your network topology. This comprehensive view enables more accurate device discovery, as the system can identify devices in context of their network and site location. It also facilitates precise classification, taking into account the device's network segment and site-specific characteristics.
IoT Security automatically maps discovered devices to sites based on their network location. This automatic mapping streamlines device management and ensures that security policies consider both network segmentation and physical or logical location. IoT Security can evaluate device risks by assessing factors such as network exposure, site-specific threats, and the device's role within its segment. This contextual risk assessment allows you to prioritize security measures more effectively.
Furthermore, this integrated model allows for targeted policy enforcement. Using Device-ID , you can apply security policies based on a combination of network, segment, and site parameters, ensuring that devices receive appropriate protections regardless of their location or network position.
The flexibility of this approach accommodates various network architectures and organizational structures. Whether you manage a single office or a global enterprise with multiple sites and complex network segmentation, IoT Security adapts to and helps secure your specific topology.
Device-to-Site Mapping
|
Where Can I Use This? |
What Do I Need? |
|
|
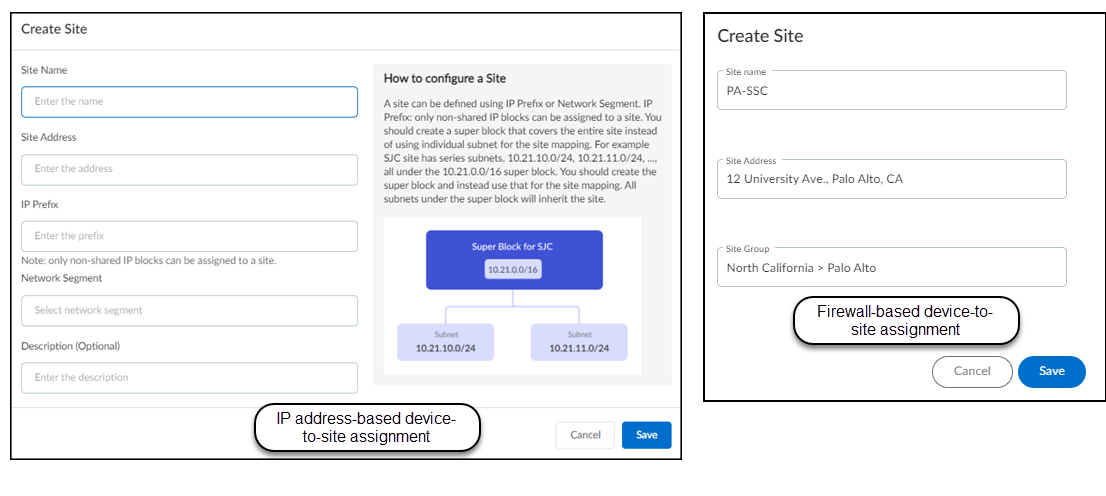
From March 2022, IoT Security provides existing tenants two ways to link devices to sites:
- IP address-based site assignments – IoT Security assigns devices to a site based on device IP address. This method was introduced in March 2022. It is available for existing IoT Security tenants to switch to and is the only option that new tenants (as of March 2022) can use.
- Firewall-based site assignments – IoT Security assigns devices to a site based on the location of the firewall that sends it logs. Until March 2022, this was the only method that IoT Security offered.
For the first approach, you must define one or more Classless Inter-Domain Routing (CIDR) blocks or subnets for each site at NetworksNetworks and SitesNetworks . For the second approach, you must assign a site to each firewall at AdministrationFirewalls . Site assignment based on firewalls works well for smaller, single-site deployments. However, an issue can arise when there are multiple sites and devices at two sites communicate with each other. When this occurs, the firewalls at both sites observe a session involving the same two devices and report them in logs to IoT Security, which cannot tell where each device is actually located. This issue doesn’t occur when IoT Security assigns devices to sites based on IP address, which is the preferred method.
IP Address-based Site Assignment
This method for mapping devices to sites uses IP addresses and is the only site-mapping method available to new IoT Security tenants starting in March 2022.
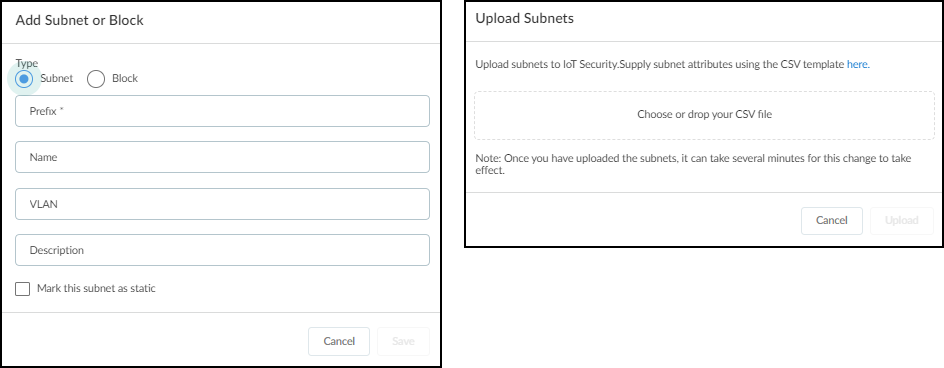
If you haven’t done so already, enter or upload a CSV file of the IP address blocks of your sites in CIDR notation on NetworksNetworks and SitesNetworks . (Examples of CIDR notation: 10.55.0.0/16 and 10.197.0.0/16.) Then click AddAdd a Subnet and enter the network address in CIDR notation and a description, or click AddUpload Subnets and upload multiple subnets using the provided template.
You don’t need to use all the subnets that belong to a site for site mapping. Instead, pick the largest subnet (IP address block) for site assignment. For example, one site might have numerous subnets such as 10.55.10.0/24, 10.55.28.0/24, and 10.55.121.0/24, all of which are within a single IP block of 10.55.0.0/16. In this case, use 10.55.0.0/16 for site mapping. IoT Security automatically assigns smaller subnets within the site-mapping IP block to the same site and assigns devices within each subnet to the same site as that of their subnet.
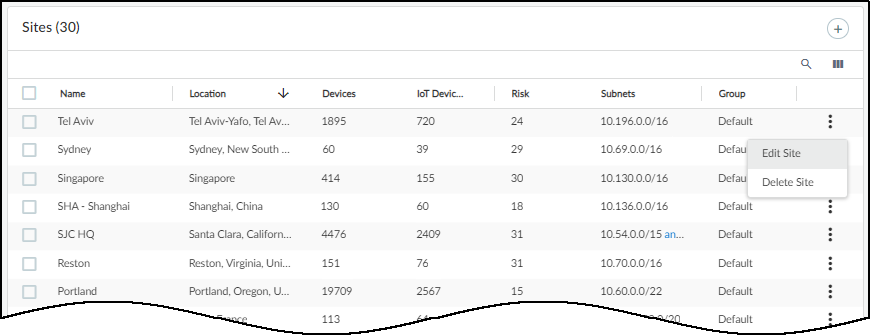
After adding or uploading subnets, assign them to sites on NetworksNetworks and SitesSites . Either click the Create Site ( + ) icon to the upper right of the Sites table or click the three vertical dots icon at the far right of the row for a previously created site and then click Edit Site .
Choose the subnets you added or uploaded on NetworksNetworks and SitesNetworks .
If you miss a subnet, IoT Security won’t be able to link devices in the subnet to a site. When this happens, it assigns devices in this subnet to the Default site to which all the private IP ranges (10.0.0.0/8, 172.16.0.0/12, and 192.168.0.0/16) are assigned for the purpose of catching any unassigned subnets.
Firewall-based Site Assignment
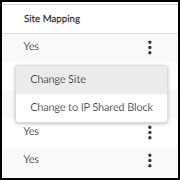
For IoT Security tenants that onboarded before March 2022, IoT Security uses firewall-based site assignments. After you finish onboarding a firewall, it appears on the NetworksNetworks and SitesNetworks page assigned to the Default Site. To reassign it to another site, click the three vertical dots icon in its row on the far right and then click Change Site .
Choose one of the sites in the Site Name list and then click Change .
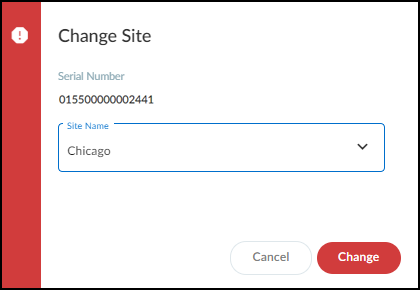
IoT Security maps the devices whose traffic metadata appears in the logs from this firewall to this site.
For information about creating sites, see Sites and Site Groups .
If you don’t assign a firewall to a site, IoT Security won’t be able to link devices whose traffic appears in logs from this firewall to a site. When this happens, it assigns these devices to the Default Site.
Change Site Assignments from Firewalls to IP Addresses
Only a user with owner privileges can change from firewall-based site assignments to site assignments based on IP addresses.
For IoT Security tenants that map devices to sites based on firewalls, IoT Security provides an option to switch to the IP address-based approach. This is a one-time change. After switching to IP address-based site assignments, you can’t switch back to the firewall-based approach.
Select NetworksNetworks and SitesSites and click the gear icon (
![]()
) in the upper right of the Sites panel.
Switch from Firewall-based assignment to IP CIDR-based assignment and then Save .
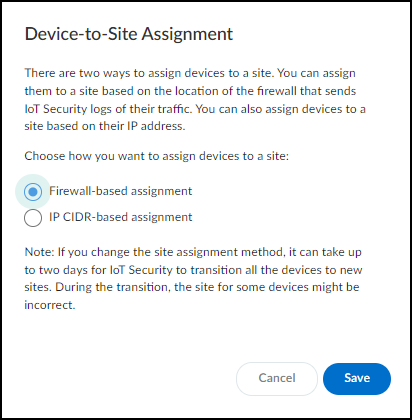
As the note in the dialog box says, it can take up to two days for IoT Security to transition all devices to new sites and that during this time the site assignments for some devices might be incorrect.
Read the confirmation message that appears, recalling that this switch cannot be undone later, and when you’re ready, click Yes to continue.
![]()
After you finish setting up the IP CIDR blocks for site mapping and the new IP address-based site assignment method has had a couple days to establish device-to-site assignments, you can check NetworksNetworks and SitesNetworks to verify the configuration and make any adjustments if necessary.
Of particular interest is the Site Mapping column. When a subnet is linked to a site and its entry in the Site Mapping column is Yes , this indicates that the subnet has been manually mapped to the site. When a subnet is linked to a site but its entry in the Site Mapping column is No , it means that the subnet is a part of a larger IP address block that is mapped to the site and this subnet inherited its site mapping.
After switching device-to-site mapping from firewalls to IP addresses, IoT Security removes filters for All connected sites and All disconnected sites . These filters are based on the status of firewall activity at a site, and after the switch, IoT Security no longer links firewalls to sites.
Sites and Site Groups
|
Where Can I Use This? |
What Do I Need? |
|
|
Only users with owner privileges can create and manage sites, organize sites into groups, and assign access to sites and site groups to other users.
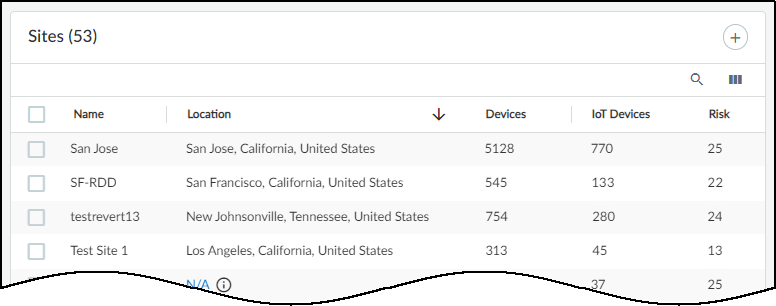
Log in as a user with owner privileges and select NetworksNetworks and Sites Sites . There you can add, view, edit, and delete sites with devices under IoT Security protection.
There are three sections on the Sites page:
- At the top is a title bar with titles for the Networks, Network Segments Configuration, and Sites tabs. There is also a global filter that controls the content displayed on the page by site and time range.
- The Organization section shows the hierarchical structure of sites in your organization.
- The Sites section is a table with useful information about individual sites.
The Default site is where IoT Security initially assigns IP address blocks and subnets. You can later reassign them to user-defined sites.
To add a new site, click + above the table. There are different settings based on the device-to-site assignment method that’s in use. When assigning devices to sites by IP address, enter a site name, optionally enter a site address and description, choose either the IP prefix of an non-shared IP block or previously defined network segment, and then Save . When assigning devices to sites by firewall, enter a site name, optionally enter an address for the site and (if you’re organizing sites into groups) choose a site group, and then Save .
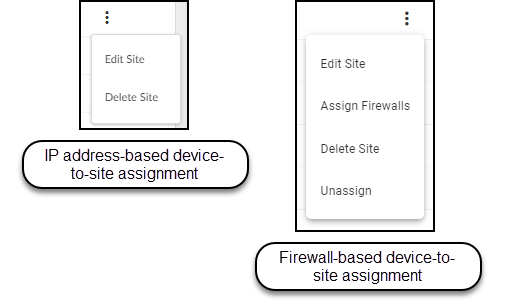
To edit or delete a site, click the three vertical dots at the far right of a site row and then click one of the actions that appear. When assigning devices to sites based on firewalls, there are two additional options. You can assign one or more firewalls to a site or unassign a site from a group.
Before you can delete a site, you must first remove all firewalls from it or reassign them to different sites.
Organize Sites into Groups
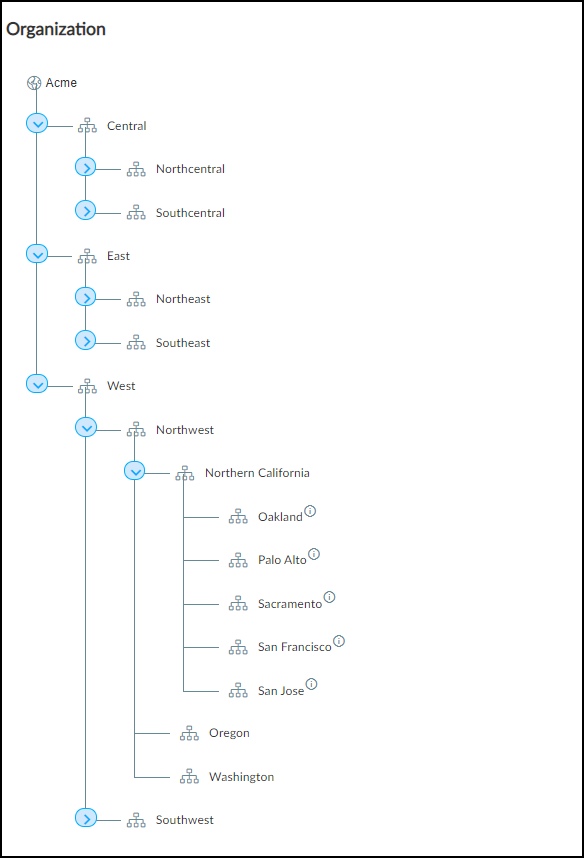
You have the option to organize your sites into groups within a hierarchical structure and then set controls at different levels within the structure to define what administrative users see and do. For example, in the tree structure shown below, you might give a user access to data at an individual site level, or for all sites in a city, or in a state, or within a broader region.
You don’t have to organize sites into groups. In fact, by default, the Organization panel is hidden on the NetworksNetworks and SitesSites page. If you want, you can assign users access on a per-site basis without the use of site groups. However, if you want to see the Organization panel and use this feature, click Show Organization and then click Organize Sites .
Add Groups to the Tree and Add Sites to Groups
Only a user with owner privileges can add, edit, and delete groups and add sites to them.
There can be five levels in a group hierarchy. The root node forms the top-level group (“Acme” in the examples here) and is the group to which all sites belong by default. By default, it’s the name of the tenant account and cannot be removed, but it can be renamed. All other groups below the root are completely owner-defined.
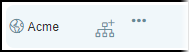
To add a group to the organization, hover your cursor over an existing group, click the Add group icon, and then enter a new name. To change its name, click the three dots ( ... ) next to the Add group icon and then click Rename .
The global filter has priority over page-level filters. When creating the tree structure, be sure that the global filter at the top of the page is set to All Sites . If it’s set to anything else, the Organization panel will keep collapsing to show only whatever site or sites were selected in the global filter.
Add groups and subgroups as needed to reflect the structure of your organization. After adding the groups you need, add sites to them. Select the check box for one or more sites in the Sites panel, click Assign to Group , and then choose the one to put them in.
You can search for a group by typing its name in the Search groups field at the top of the Assign to Group drop-down menu.
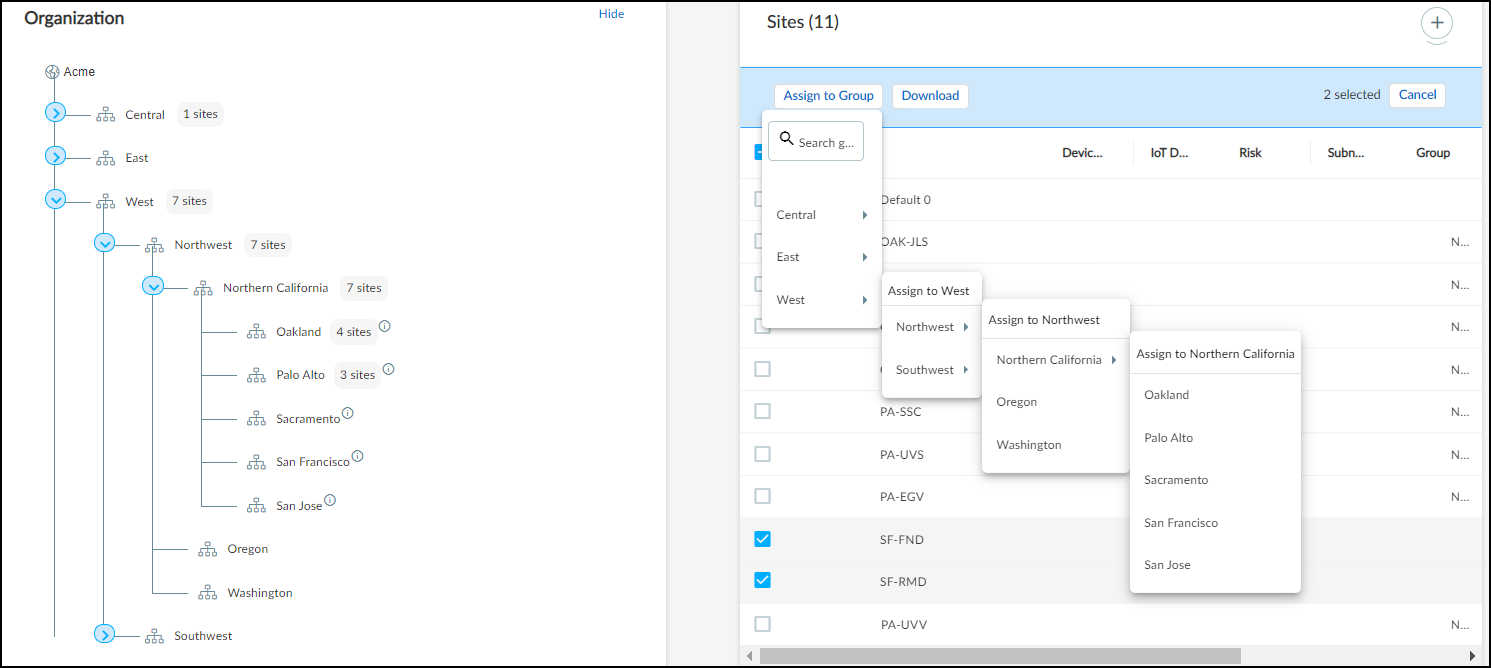
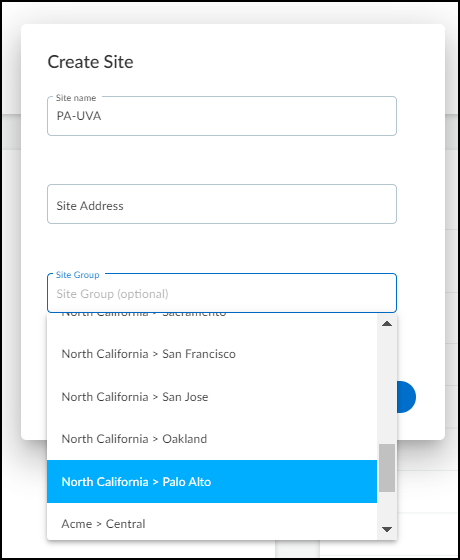
In addition to adding existing sites to groups, you can also add new sites to groups. When creating a new site ( NetworksNetworks and SitesSites+ ), the Site Group option lets you assign the site to an existing group, thereby combining site creation and group assignment in a convenient one-step process.
Reassign Sites and Delete Groups
If you later want to reassign a site from one group to another, use the same process for adding it to a group but select the other group from the list.
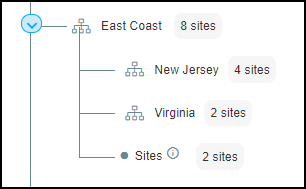
When you assign a site to a group that also has subgroups, a node labeled Sites appears in the tree under its assigned group at the same level as the subgroups. For example, notice how the group named East Coast has two subgroups—New Jersey and Virginia—and it also has a node called Sites for two sites assigned to the East Coast group.
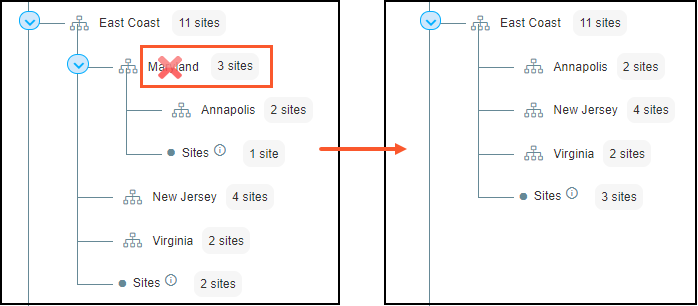
If you delete a group, IoT Security reassigns all its sites and child groups to its parent group. For instance, look at what happens when the Maryland group is deleted. The site that belonged to Maryland now belongs to East Coast, and its child group Annapolis becomes a child group of East Coast.
To avoid IoT Security automatically reassigning a site when its group is deleted or simply to remove it from a group, click the three vertical dots at the far right of its row in the Sites panel, and either click Edit Site to reassign it to another group or click Unassign to remove it from its current group and put it into the root node.
Use Groups to Filter and Control Access to Data
After you finish creating the organizational structure and assigning sites to groups, you can use the tree to filter what to display on the Sites page. Click any group name in the tree to display sites belonging to it in the Sites panel on the right. The sites that are displayed either belong directly to the group or are in one of its child groups. (To remove the filter, click the X to the right of its name at the top of the Sites table.)
Not only can you use groups to filter the sites displayed on the NetworksNetworks and SitesSites page, but you can also filter by group on the Devices page.
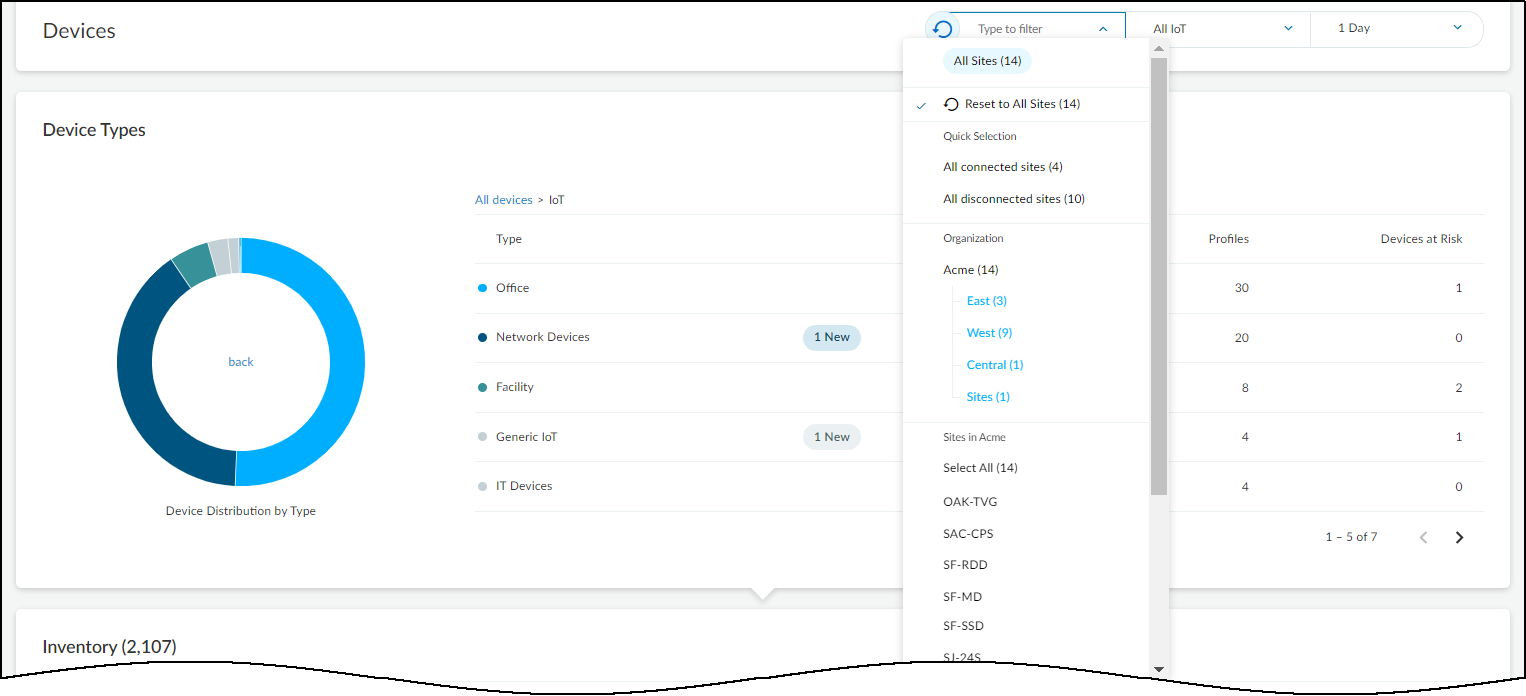
In the drop-down list for the sites global filter, click a group name (in blue) and then click either Select All to see devices at all sites in the selected group or click a specific site to see devices just at that site.
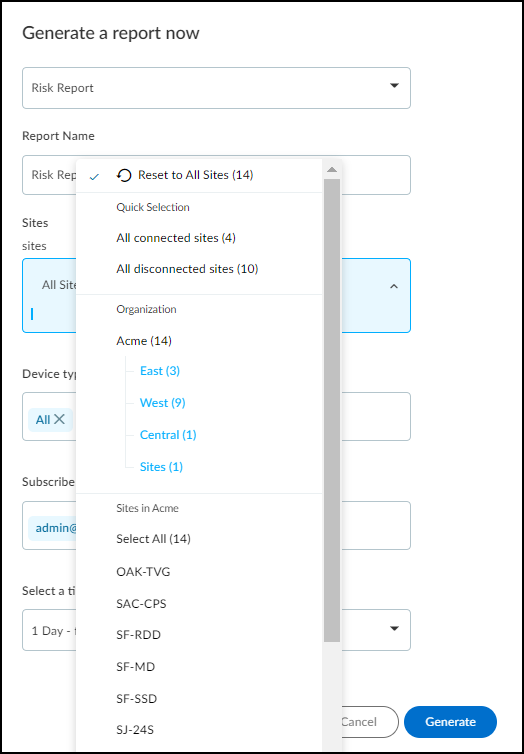
You can also select a group or site when defining the scope of a report at ReportsFiles and Settings+ and clicking Generate a report now or Schedule a report for later .
When logged in as a user with owner privileges, you can use groups to control which sites other users are allowed to access. Do this in the User Role & Access section on the user account settings for a user by clicking AdministrationUser Accounts > username .
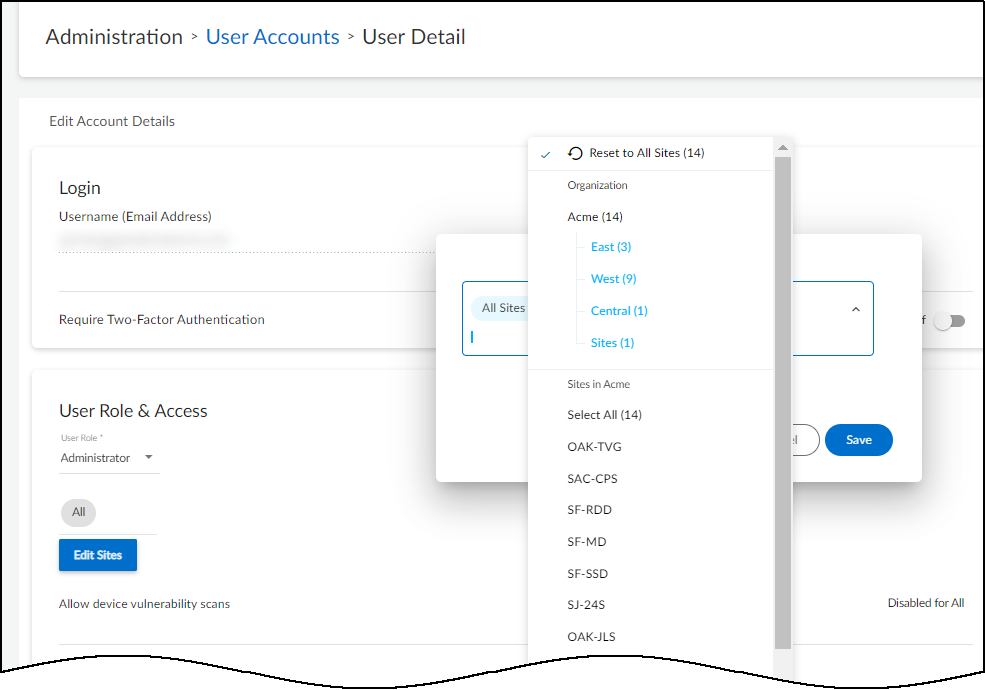
By default, all users have access to all groups and sites. However, after a user with owner privileges gives other users access to one site or group, that’s all they can access. If that site or group is ever deleted, these users won’t return to having default access to everything. Instead, they won’t be able to access anything; that is, until they’re given access to something else. On the other hand, users with owner privileges always have access to all groups and sites in their account.
Networks
Network Segments Configuration
|
Where Can I Use This? |
What Do I Need? |
|
|
IoT Security learns about the addressing scheme on your network through several means. You can add subnets and Classless Inter-Domain Routing (CIDR) blocks manually, even specifying if a subnet contains devices that have static IP addresses. IoT Security can discover subnets by observing the exchanges between DHCP clients and servers. IoT Security can learn about subnets through third-party integrations with network switches, using SNMP for network discovery . It can also learn about subnets and CIDR blocks through IP Address Management (IPAM) integrations with BlueCat and Infoblox .
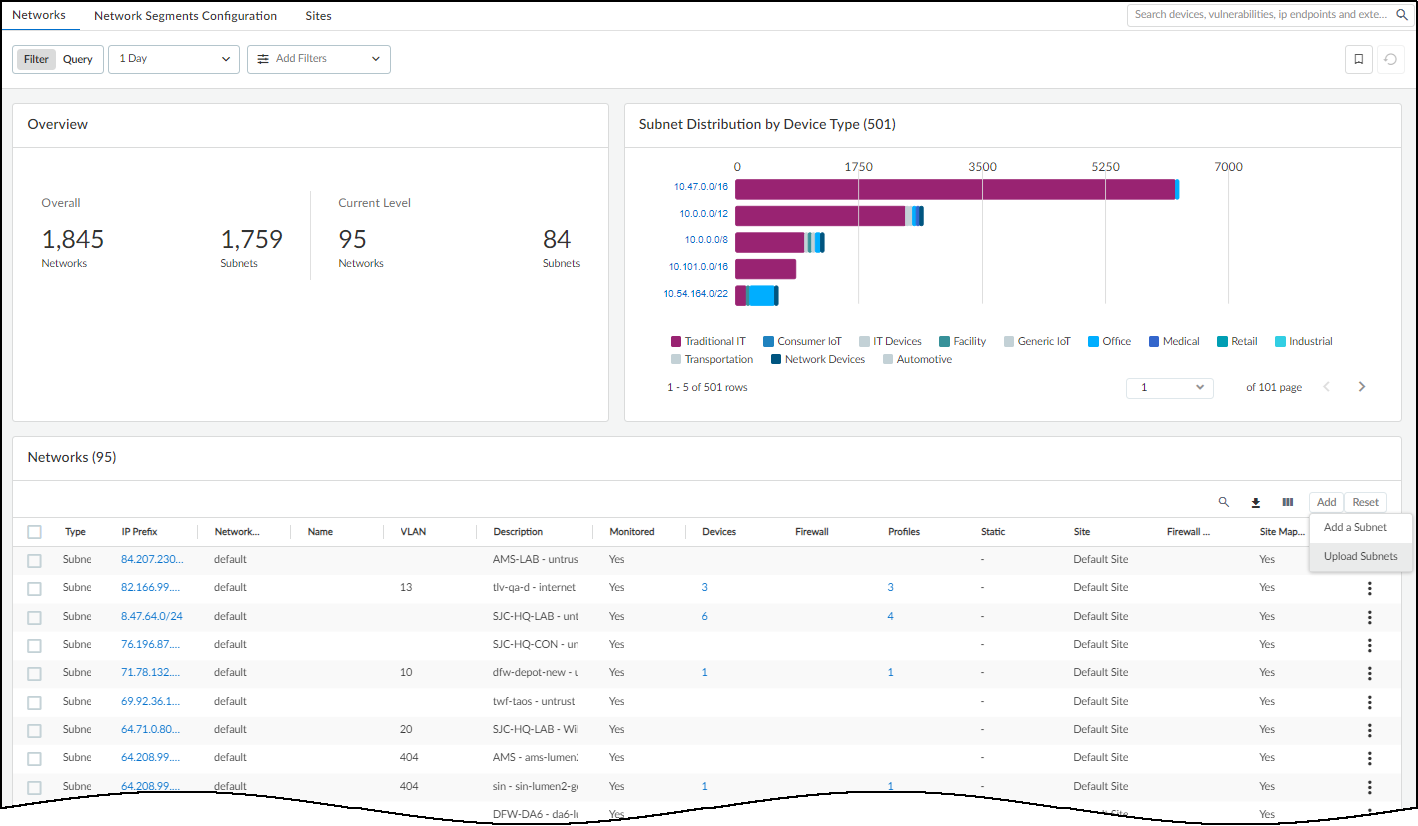
As IoT Security gathers network information, it organizes it hierarchically and displays the subnets and blocks on the Networks page ( NetworksNetworks and SitesNetworks ). Blocks are logical partitions of IP address space that serve as an organizational tool for managing addresses. Large “parent” blocks can contain smaller “child” blocks and subnets, where devices are found. Another conceptual grouping is “remainders”. These are sets of IP addresses within a block that don’t belong to either a subnet or child block.
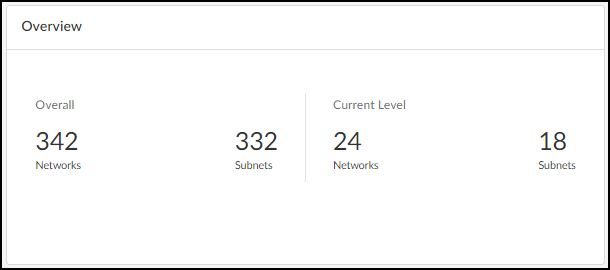
At the top of the Networks page are two panels that provide a high-level view of your network and how different types of devices are distributed throughout it. The Overview panel is divided in two sections. On the left is the overall number of “networks”, which is really a collection of all the network elements (blocks, subnets, and remainders) in your network, and the total number of subnets in your network. On the right of the Overview panel is the total number of network elements at a particular level. If you don’t select an entry in the Prefix column of a block in the Networks table, the current level shows the total number of blocks and subnets at the root level. For example, the following Overview panel shows that there are 342 networks (various blocks, subnets, and remainders) of which 332 are subnets. At the current (root) level, there are 24 networks (blocks and subnets) consisting of 18 subnets and 6 blocks (24-18).
If you select one of the blocks by clicking the entry for it in the Prefix column in the Networks table, the overall totals stay the same but the totals in the current level changes to show the subnets, child blocks, and remainders within the selected block.
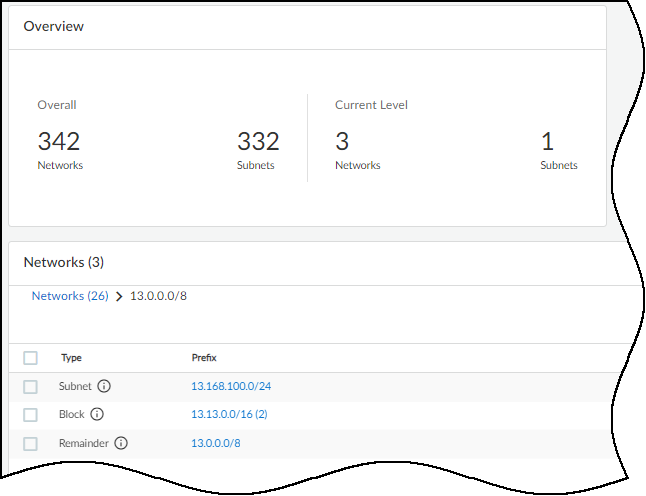
To see the elements in a child block, select the entry in the Prefix column. To return to the root level, click Networks (number) in the breadcrumbs above the Networks table.
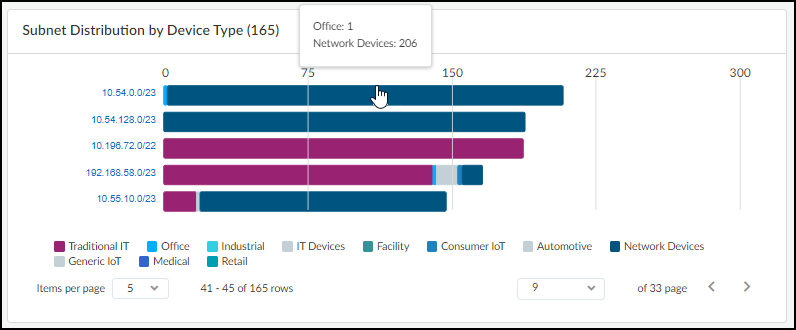
The other panel at the top of the Networks page contains a bar chart showing the distribution of device types in each subnet.
The number in parentheses after “Subnet Distribution by Device Type” is the total number of subnets with active devices during the time period set in the filter at the top of the page. The overall number of subnets in the left panel is for all subnets regardless of whether IoT Security detects device activity in them. IoT Security can learn about subnets without detecting device activity by various means:
- User-configured subnets in the IoT Security portal
- User-initiated uploads of subnet configurations in .csv files
- Third-party integration using SNMP for network discovery
- Third-party integrations with IP Address Management (IPAM) solutions from BlueCat or Infoblox
- Detection of IP endpoints but not devices in subnets
- Detection of past device activity in subnets that are inactive during a shorter time period filter set on the Networks page
The total number of subnets in the two panels might be the same if IoT Security detects device activity in every subnet of which it’s aware, but most likely the totals are different.
Hover your cursor over one of the bars to see an information pop-up listing the device types in this subnet. For example, the 10.54.0.0/23 subnet shown below has one office device in a subnet that otherwise consists of only network devices. It immediately suggests that the office device might be misplaced on the network.
Click the subnet on the left of the bar chart to see the Subnet Detail panel. By default, device types are shown. To see the device categories and device profiles, click the Category and Profile tab.
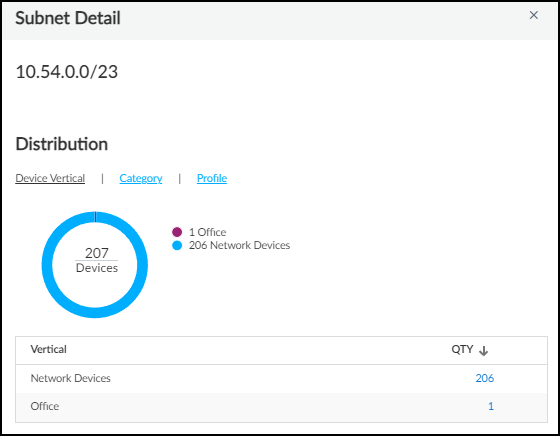
To see details about one type of devices in a subnet, such as the one office device, click the number in the QTY (Quantity) column. IoT Security opens the AssetsDevices page filtered to show the device or devices selected. Then click the name of a particular device to see the Device Details page for it.
In the Networks table, IoT Security displays all the blocks and subnets it has been configured with, discovered, and learned through third-party integrations on the Networks page. When a “parent” block has other blocks and subnets nested below it, the number of its “children” is shown parenthetically. To see these blocks click the prefix of the block containing it.
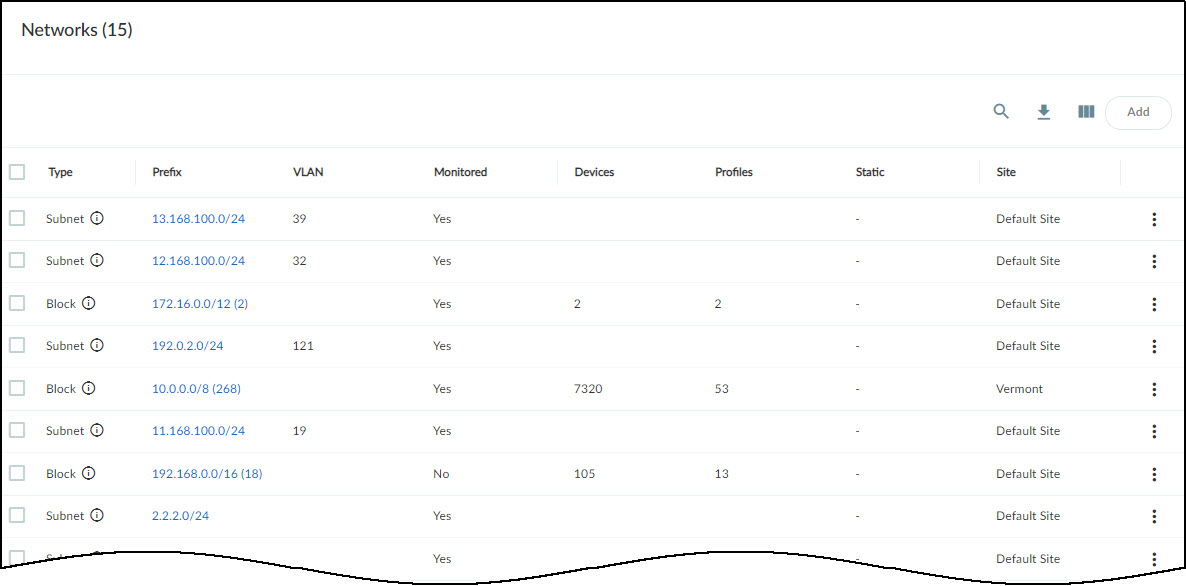
For example, if you click the 192.168.0.0/16 block in the screen capture above, IoT Security displays a list of the blocks and subnets within it.
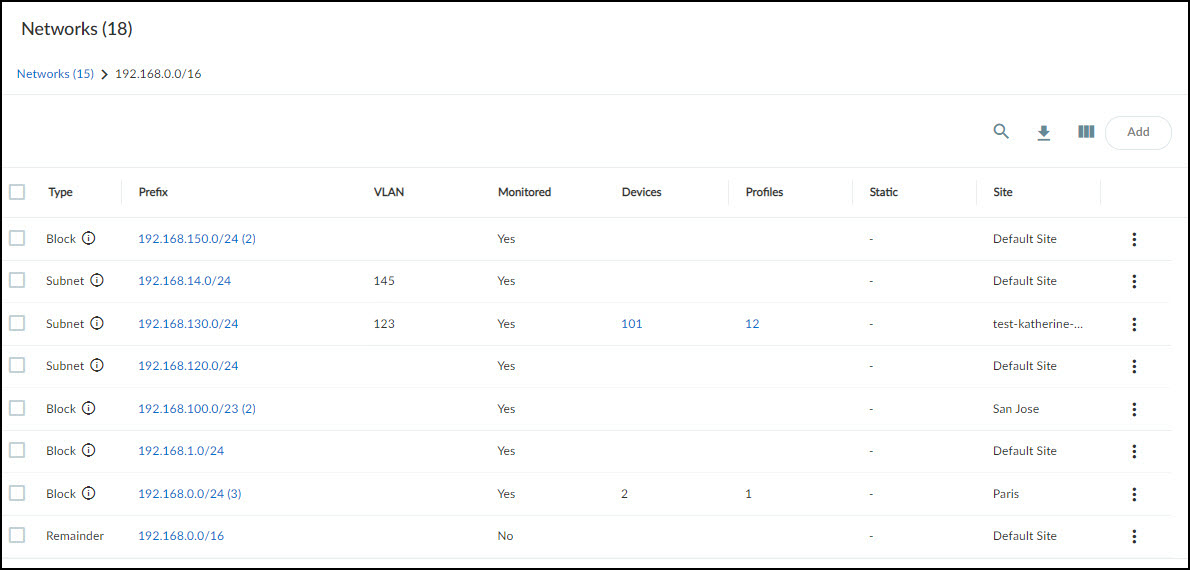
Notice how it contains 18 blocks and subnets and that some of the blocks have parenthetical numbers after them, indicating that there are other smaller blocks and subnets beneath them. You can continue to move downward to lower levels in the hierarchy by clicking the prefix of any block that has a parenthetical number after it. To move upward, click a higher level in the breadcrumb trail at the top of the page.
The Networks page mainly consists of a table presenting a hierarchical view of your network and attributes of the blocks and subnets that constitute it.
Type : There are several types of network grouping categories:
- Subnet – A network section with a broadcast domain and gateway.
- IP Block – A partition of IP address space that can logically contain other blocks and subnets.
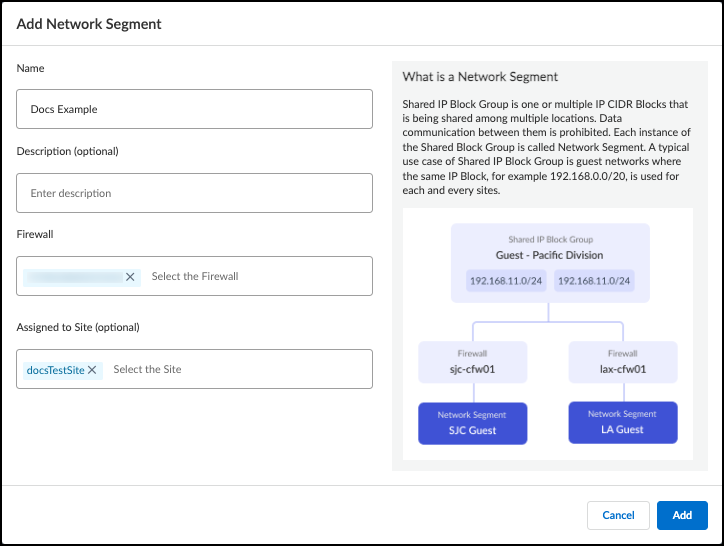
Shared IP Block – An IP block whose space is partitioned into at least one subnet that's reused in different shared network segments. This results in devices with overlapping IP addresses on the same network. For example, you might use the same subnet for guest traffic in multiple network segments throughout your network. In this case, you would first make a list of firewalls and where they are on the network, perhaps at the same site or at different sites. Next, you'd plan out how to group the firewalls into different network segments and assign each firewall and site to a particular segment. Finally, you'd define the IP block containing the guest subnet as a shared IP block. IoT Security can now automatically detect which network segment an IP address comes from based on its shared IP block and the firewall that sent the log containing the address.
Non-shared IP Block – An IP block whose space is partitioned into smaller blocks and subnets that are unique in your network. IP addresses in non-shared IP blocks are used in only one network segment in your network.
- Remainder – All IP addresses that aren't in more specific IP blocks or subnets contained within a larger, superset block.
- Network Segment – A logical grouping of one or more firewalls plus an IP block. When firewalls send traffic logs, IoT Security identifies which network segment a device belongs to by the IP block that its IP address is in + the firewall that sent the log. In this way, the logs uniquely identify each device even when it's using the same IP address as another device in a different network segment.
Name , VLAN , and Description : When manually adding blocks and subnets in the IoT Security portal, you can include a name and description and, for subnets, a VLAN. IoT Security can also learn these attributes through third-party integrations. BlueCat IPAM integrations can provide a name for a block or subnet. SNMP and Infoblox IPAM integrations can provide the VLAN for a subnet. An Infoblox IPAM integration can provide a description.
You can later modify the VLAN and description but not the name.
Monitored : Yes or No means a network has devices whose network activity IoT Security is monitoring or not.
Categories and Profiles : The number of device categories (such as Personal Computer or IP Phone) and the device profiles (such as PC-Windows and Poly IP Phone) in a subnet.
Source : There are several ways that a block or subnet can be added to IoT Security. This column shows where each block or subnet comes from. The following are the possible sources:
- Discovered – IoT Security discovered a subnet by observing network traffic.
- Config – A user manually configured an IP block or subnet.
- Preconfig – An IP block was preconfigured by IoT Security and cannot be removed. For example, the 10.0.0.0/8 Class A private block.
- BlueCat IPAM – IoT Security learned an IP block or subnet through integration with BlueCat IPAM.
- Infoblox IPAM – IoT Security learned an IP block or subnet through integration with Infoblox IPAM.
- Network Discovery SNMP – IoT Security learned an IP block or subnet by using SNMP to discover network information from switches.
IP Endpoints : IP Endpoints are devices whose IP addresses IoT Security knows but not their MAC addresses. In addition, their behaviors are not stable enough for IoT Security to confidently deduce that their addresses are statically defined. IoT Security displays the number of IP endpoints in a subnet. Click the number to download a .zip file containing a report of IP endpoints in comma-separated-value format.
DHCP and Gateway : When IoT Security integrates with switches using SNMP for network discovery and learns the IP addresses of the DHCP server and gateway for a subnet, it displays them in these columns. A BlueCat IPAM integration also provides the gateway for subnets.
Prefix : The network portion of an IP address for a CIDR block or subnet. If you click the entry in the Prefix column for a block, IoT Security displays the blocks, subnets and remainders within it.
If you click the entry for a subnet, IoT Security opens the Subnet Detail panel over the right side of the page. The panel includes various details about the subnet such as a VLAN ID; DHCP server IP address; the number of devices in it per device type, category, and profile; the name and details of the connected switch for the subnet; and firewall security rule details (if there are rules for this subnet learned through Cortex XSOAR integration with Panorama).
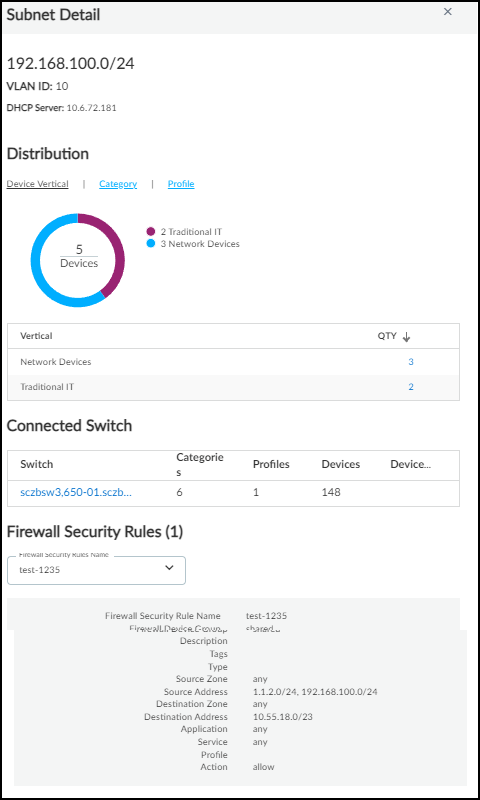
Not every Subnet Detail panel includes the Connected Switch and Firewall Security Rules sections. For example, IoT Security only learns about connected switches from third-party integrations with Cisco Prime, DNA Center, or Meraki or from integrations using SNMP for network discovery.
Devices : The number of devices that IoT Security has discovered in a subnet and learned about through a third-party integration.
Static : If a subnet is defined as having static IP addresses , Yes appears in this column. Otherwise, a dash ( - ) appears here, indicating that IoT Security does not have enough data to determine if a subnet has static IP addresses or not.
Firewall Security Rules : ( Requires an IoT Security Third-party Integrations Add-on license or an integration through a full-featured Cortex XSOAR server) After you configure IoT Security to communicate with Panorama through Cortex XSOAR, it can fetch any firewall security rules that reference a subnet as the source or destination. The number of rules applied to a subnet appear in the Firewall Security Rules column. When you click the subnet entry in the Prefix column, you can see the rules themselves in the Subnet Detail panel that appears.
When 0 appears in the Firewall Security Rules column, it means that a previous rule referencing the subnet has been removed and now no other rules apply to it.
Low-confidence Devices : This is the number of devices whose identity IoT Security cannot identify confidently. Click the number for a subnet to open the Devices page with a filter applied to show only the low-confidence devices in that subnet; that is, devices with calculated confidence score of 0-69%.
A confidence score indicates the level of confidence IoT Security has in its identification of a device. IoT Security has three confidence levels based on calculated confidence scores: high (90-100%), medium (70-89%), and low (0-69%).
Site Mapping : Subnets and blocks that are nested within other blocks inherit the site of the topmost block of their set. For example, if there’s a 10.1.0.0/16 block at a site named “NYC” and it contains a 10.1.1.0/24 subnet or block, then this subnet or block inherits “NYC” as its site too. Yes or No indicates whether a subnet or block inherited its site in this manner or not.
Site : The site to which a block or subnet belongs can be defined manually (see Device-to-Site Mapping ) or learned through an integration with Infoblox IPAM.
Devices Discovered via Integration : The number of devices learned through integration with a third-party system.
Removable : Indicates if you can remove a subnet or block. Preconfigured blocks, like 10.0.0.0/8, and those currently being used for site mapping cannot be removed.
Clicking the subnet entry in the Prefix column opens the Subnet Detail panel where you can see more information about it.
Below the Networks table is a map showing the number of devices that made connections to external destinations; that is, to destinations outside the local network. The color of the countries to which devices connected indicate how many devices made connections to them and if any of the destinations were malicious.
- Gray indicates there were no devices with connections to a country.
- Green indicates devices connected to safe destinations to a country. The darker the green the more devices connected to destinations there. (See the legend for numbers.) Hover your cursor over a country to see an information pop-up with the number of devices that connected to destinations there during the time period filter at the top of the page. If you click a country, the information pop-up remains in view until you click the country again to close it. This allows you to click two or more countries and easily compare the number of connections to each one. Click the number in the pop-up to open the AssetsDevices page with a filter set to show devices that connected to this country.
- Red indicates at least one device connected to a malicious destination there.
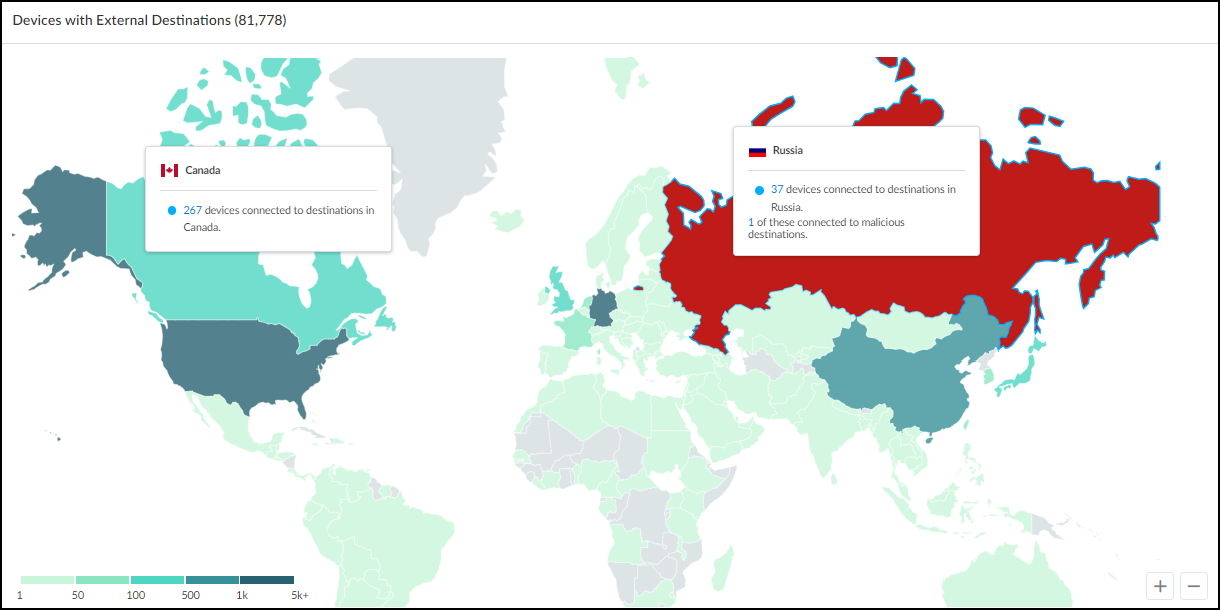
Click-drag your cursor to move the map. Use the scroll wheel on your mouse or the + / - tools in the lower right corner of the map to zoom in and out.
Network Segments Configuration
Discover IoT Devices and Take Inventory
|
Where Can I Use This? |
What Do I Need? |
|
|
Log in as a user with owner or administrator privileges and select NetworksNetworks and SitesNetwork Segments Configuration . There you can add, view, edit, and delete network segments used for identifying devices with devices with overlapping IP addresses . Network segments rely on IP address-based site assignment to be effective. While you can manage network segments when using firewall-based site assignment, they won't have any effect.
There are two sections on the Network Segments Configuration page.
- At the top is a title bar, with titles for Networks, Network Segments Configuration, and Sites tabs. There is a global filter that controls the content displayed on the page by site, and the option to filter or query the content displayed on the page by firewall.
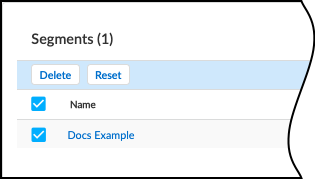
- The Segments section is a table with information about individual network segments.
Create and Manage Network Segments
When creating a new network segment, enter a name and one or more firewalls to assign to the network segment. A network segment can have multiple firewalls assigned to it, but each firewall can only be assigned to one network segment. If you enter a firewall that is already assigned to a different network segment, the old assignment will be removed when you save the new network segment.
Optionally, enter a description and a site assignment for the network segment. A network segment can be assigned to only one site at a time. If no site is specified, the network segment is assigned to the default site.
To edit an existing network segment, find the network segment in the Segments table and click on the name to bring up the edit dialog box.
Reset and Delete Network Segments
When you reset or delete a network segment, all devices and attributes learned through the network segment assignment are deleted from the assets inventory.
If you update the firewalls or the sites for a network segment, reset the network segment. Resetting the network segment ensures that traffic is properly mapped to the right device and avoids potential duplication or overriding of device attributes. In the Segments table, select the check boxes next to the network segments to reset, and then click Reset .
Delete network segments that you no longer need to avoid misidentification of devices and device attributes. In the Segments table, select the network segments to delete, and then click Delete . The network segment no longer appears in the Segments table.
Discover IoT Devices and Take Inventory
Network Segments Configuration
|
Where Can I Use This? |
What Do I Need? |
|
|
Unlike IT assets that are generally multi-purpose hardware, IoT devices are purpose-built systems. These devices are designed to perform a few tasks on a very repetitive basis, and the IoT Security solution provides deep visibility into normal and suspicious network behaviors.
Each IoT device exhibits unique characteristics on the network. When an unknown device joins the network, one or more Palo Alto Networks firewalls log its network traffic and then send the logs to the logging service. These logs include session logs, containing metadata about traffic flow, and enhanced application logs, containing data from packet payloads. IoT Security accesses the data from the logging service and uses its advanced machine-learning algorithms and three-tier profiling system to analyze network behaviors and form a baseline for the device. It then compares that baseline with the behaviors of other known devices. By doing so, it determines the unique personality of the device and creates a profile for it consisting of device type, category, vendor, model, operating system, and many more. IoT Security automatically builds a behavioral profile for the device, including a baseline of acceptable behaviors and communication patterns with other devices.
IoT Security continuously learns and maintains a rolling baseline of device behaviors. The time required for building an initial profile depends on several factors:
- How active are the devices on the network? IoT Security can profile a device that produces a lot of traffic faster than a device that produces a little because it has more data to analyze.
- How many devices of the same type are there on the network? The more devices of the same type there are the faster the profiling works because it can aggregate knowledge learned from multiple devices simultaneously.
- How complicated is the behavior of an individual device? For example, IoT Security learns the behavior of a network-connected thermostat much faster than that of a surgical robot in a hospital.
The devices that IoT Security discovers on the network and identifies appear on the Devices page in the IoT Security portal.
IoT Security Devices Page
Discover IoT Devices and Take Inventory
IoT Security Device Details Page
|
Where Can I Use This? |
What Do I Need? |
|
|
This page ( AssetsDevices ) is where you can see an inventory of all the devices that were discovered or are being monitored and the device profiles applied to them. There are three sections on this page: filters to control what data appears on it, a high-level summary of the devices on your network, and the device inventory table.
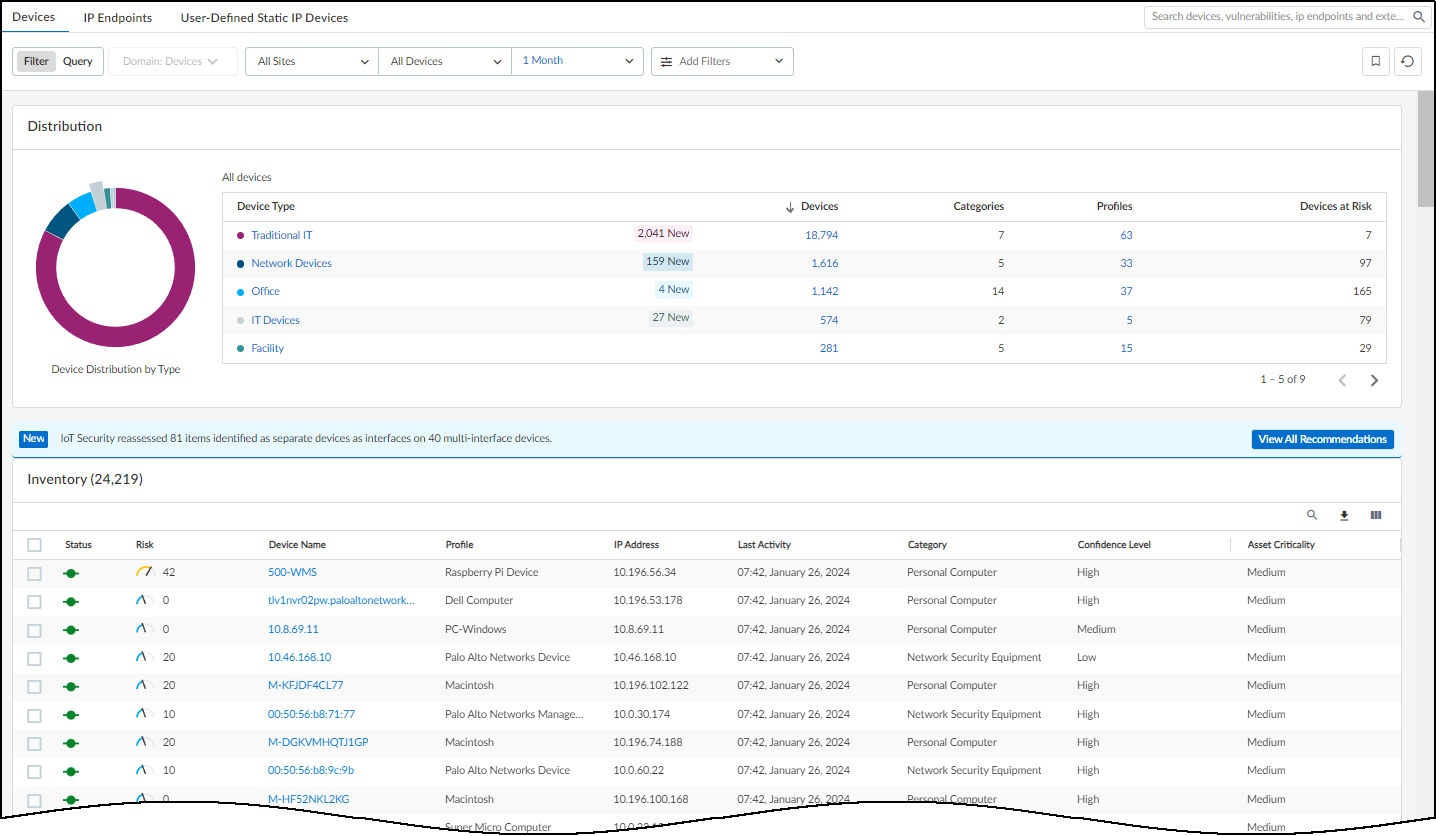
At the top of the page are filters to control the data displayed by site, monitoring status (Monitored Devices or Discovered Devices), device type, and time period. This same set of global filters is at the top of the Devices page and the Dashboard. Whatever global filters you set in one section persists when you navigate to the other. These filters control what to display and what to download. Whatever is currently active is what you save when you click the Download icon (
![]()
) > Download . For each device in the report, IoT Security includes whatever data it has for all the inventory table columns, whether they are currently visible or not at the time of the download.
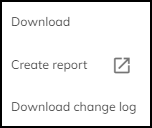
There are two other options in the Download menu. Clicking Create report opens a new browser window or tab in which you can configure one of the following types of scheduled reports: Summary, Risk, New Device, and Filtered Inventory. Clicking Download change log and selecting two dates generates a CSV-formatted file that compares changes in your device inventory on your two selected dates. IoT Security checks and reports changes in data fields such as category, profile, profile vertical, OS group, device model, IP address, and subnet.
Clicking the pie chart or clicking content in the table lets you view device data at multiple levels of granularity.
At the top of the inventory table is a search tool, which allows you to search for device names. You can search for a full or partial match. If you employ a naming convention that identifies all devices by function, location, or some other characteristic, this allows you to search by that part of the name shared by all the devices in a particular grouping.
There is also a tool for creating custom filters that control what IoT Security displays in the Inventory table. To create and apply a new filter or to apply a previously created filter, click the Filter icon (
![]()
).
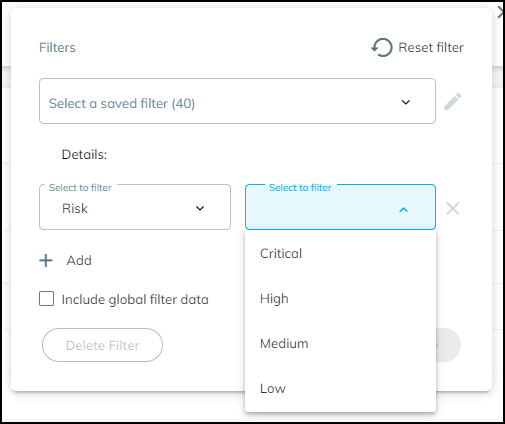
In the Filters dialog box that appears, select a previously defined and saved filter or click in the Create a new filter field and choose a device characteristic by which you want to filter devices.
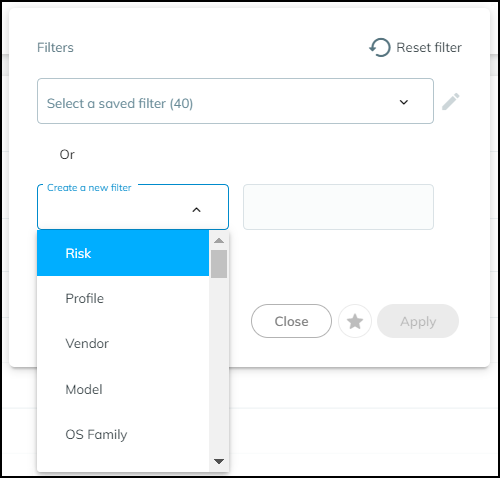
Enter a value for the characteristic you want to use to filter devices.
Decide if you want to include global filters in your custom filter or not. When you select Include global filter data , you can control the global filters for sites, device types, and time whenever you apply the custom filter you are defining. Your custom filter can use either the current global filters or, if you modify them in the settings, the modified global filters. If you do not select Include global filter data , your custom filter will use whatever global filters happen to be in effect at the time you apply it.
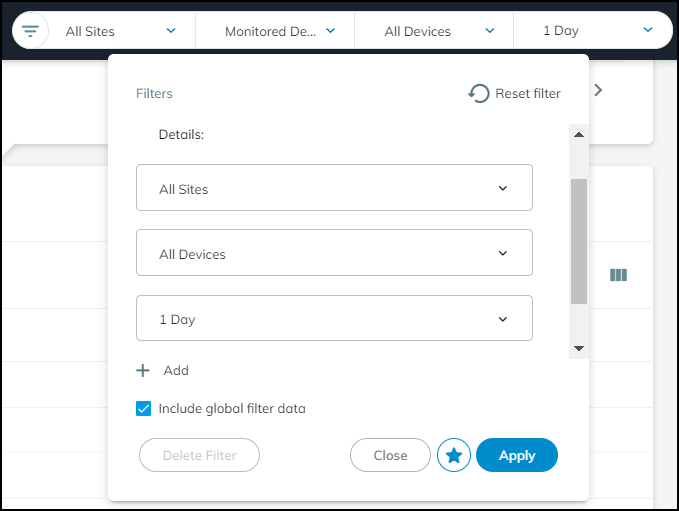
Click the star icon to save the filter for future use. Click Apply to use it to filter the contents of the Inventory table now.
You can rearrange the columns in the device inventory table by click-dragging column headings into different locations.
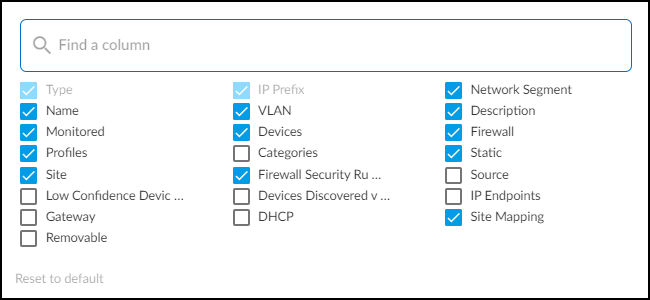
You can also change which columns appear in the table. Click the Columns icon (three vertical bars), select the names of the columns you want to see, and clear the ones you want to hide. The columns with selected check boxes appear and those with cleared check boxes do not. Use the search tool to find column headings quickly.
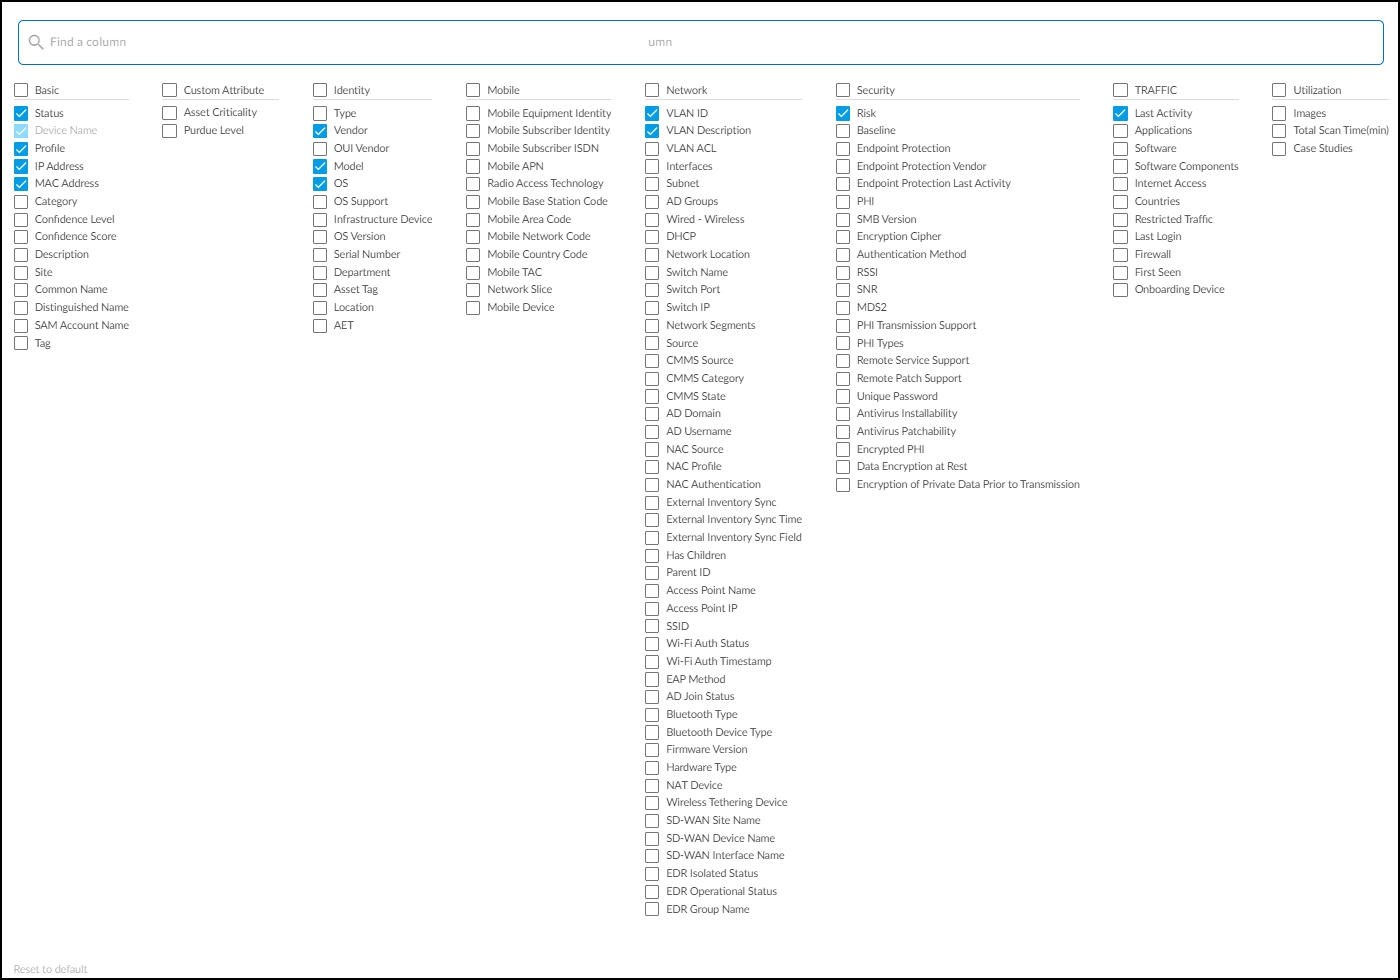
To return to the default set of columns, Reset to default .
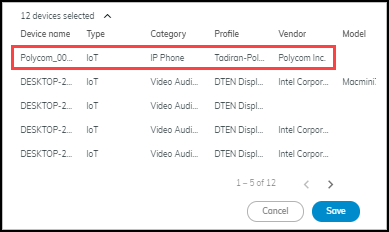
If you select the check box for one or more devices, the Download and Edit buttons appear.
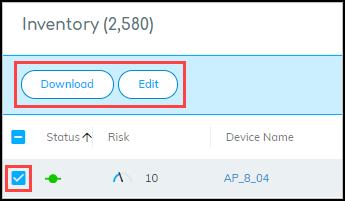
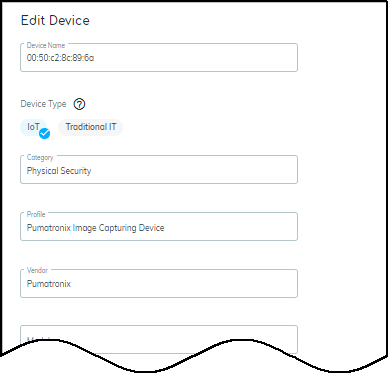
When you click Edit , a dialog box opens where you can change the device type between IoT and Traditional IT and define other device characteristics: category, profile, vendor, model, OS family, OS version, location, asset tag, serial number, user tags, and description.
When you edit a device manually and change any of its attributes, your change is considered definitive and won't be overwritten. Therefore, be careful when manually editing a device because you're locking in your edits.
Whenever you manually edit a device, the modifications are fed into machine learning. If IoT Security determines the input is valid, it retrains its models with the added or modified data and propagates the results to all its customers. IoT Security then applies its revised models to other devices of the same type in all customer environments.
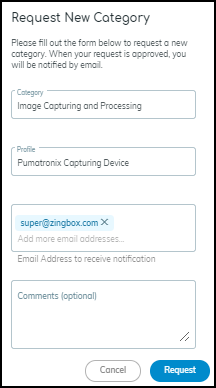
If you type something in the category field, and there isn’t an existing category, a “Request New Category” option appears.
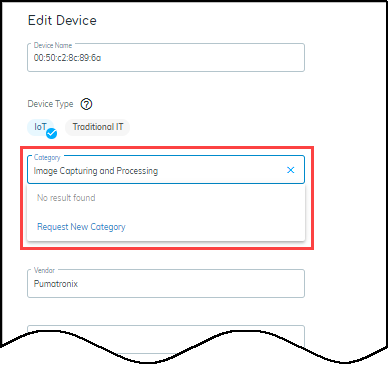
Use this option to request that IoT Security create a new category for the device. If the request is validated, then the category is added—not just for the person requesting it but for all IoT Security customers.
When you select multiple devices to edit, a table appears at the bottom of the dialog box for convenience. It displays the current values for your selections. If you mistakenly selected one that you don’t want, you can spot it here.
IoT Security Device Details Page
Create Multi-interface Devices
|
Where Can I Use This? |
What Do I Need? |
|
|
To see details about a device, click its device name. The IoT Security portal then displays the device details page, with content grouped into the following sections:
- Identity
- Active Directory Attributes (appears when Cloud Identity Engine integration is enabled)
- Security (summary)
- Risks
- Alerts
- Security
- Network Traffic
- Applications
- Software Components
- Network Usage
- MDS2 (for medical IoT devices)
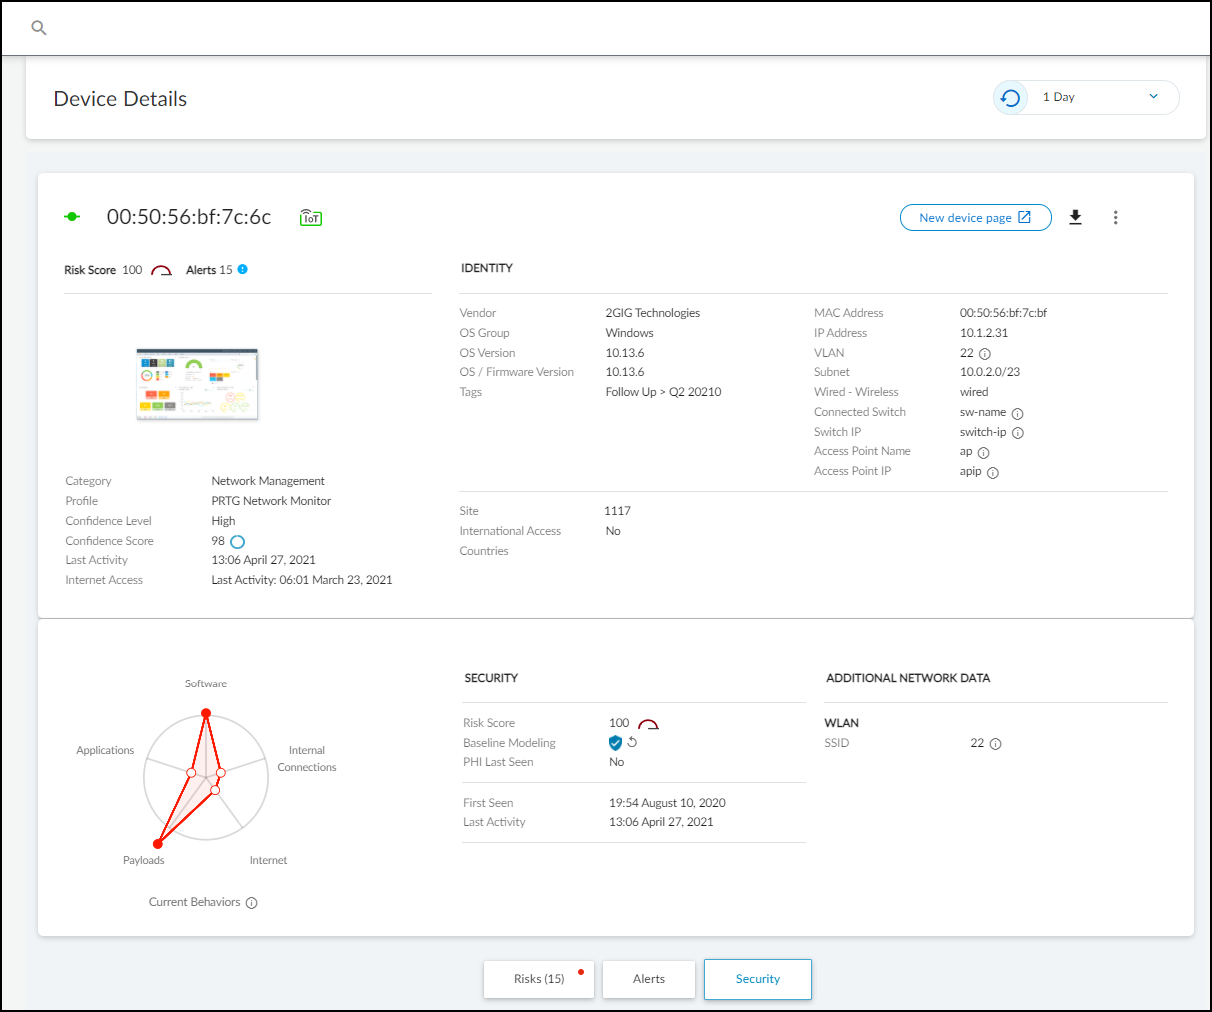
Identity : The Identity section at the top of the page provides identifying data such as the category and profile of a device, its vendor and model, its OS, and various network-specific details.
The IoT Security portal only shows a field if it has a value for it. You might see more or fewer details than shown here, depending on the amount of information IoT Security has.
Active Directory Attributes (appears when Cloud Identity Engine integration is enabled)
If you have on-premises Active Directory (AD) synchronized with Cloud Identity Engine(CIE) and have a CIE tenant in the same tenant service group (TSG) as your IoT Security tenant, you can integrate IoT Security with CIE. Through this integration, you can identify devices discovered by IoT Security that are part of your AD and collect some AD attributes for display on the Device Details page. To view only devices that are in Active Directory, you can filter and search for devices in your inventory by their AD join status.
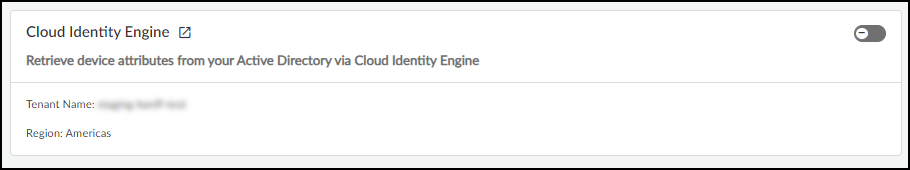
To integrate IoT Security with CIE, log in to the IoT Security portal as a user with owner privileges, select IntegrationsCloud Identity Engine Integration , and toggle the integration on. The toggle is in the upper right of the page.
The External Link icon (
![]()
) opens the portal of your CIE tenant.
Because IoT Security learns from the hub if a CIE tenant is part of its TSG, it will either let you enable integration if IoT Security and CIE are both tenants in the same TSG, or the toggle will be inoperable if they are not. Assuming you can enable integration, IoT Security will do an immediate retrieval of Active Directory attributes only if it's the first time or if the last sync was more than 24 hours ago and then do a daily retrieval every 24 hours going forward. (Toggling the integration off and back on won’t trigger a new sync if it’s less than 24 hours since the last one.) When you enable the toggle, IoT Security connects with your CIE and starts matching devices against the CIE/AD database to identify which ones are in your AD. The matching process compares the device name in IoT Security with the Common Name in AD. For devices that are in AD, IoT Security also retrieves the following attributes for display on the Device Details page:
|
Device attributes learned from Active Directory |
|
|
AD Domain |
OS |
|
Common Name (IoT Security looks for Common Names in Active Directory that match Device Names in IoT Security. When it finds a match, IoT Security then retrieves device attributes from Active Directory.) |
OS Version |
|
Distinguished Name |
OS Service Pack |
|
Security Accounts Manager (SAM) Account Name |
Serial Number |
|
AD Groups |
Last Login (This is the last time a device authenticated to AD. It comes from the AD lastLogon attribute.) |
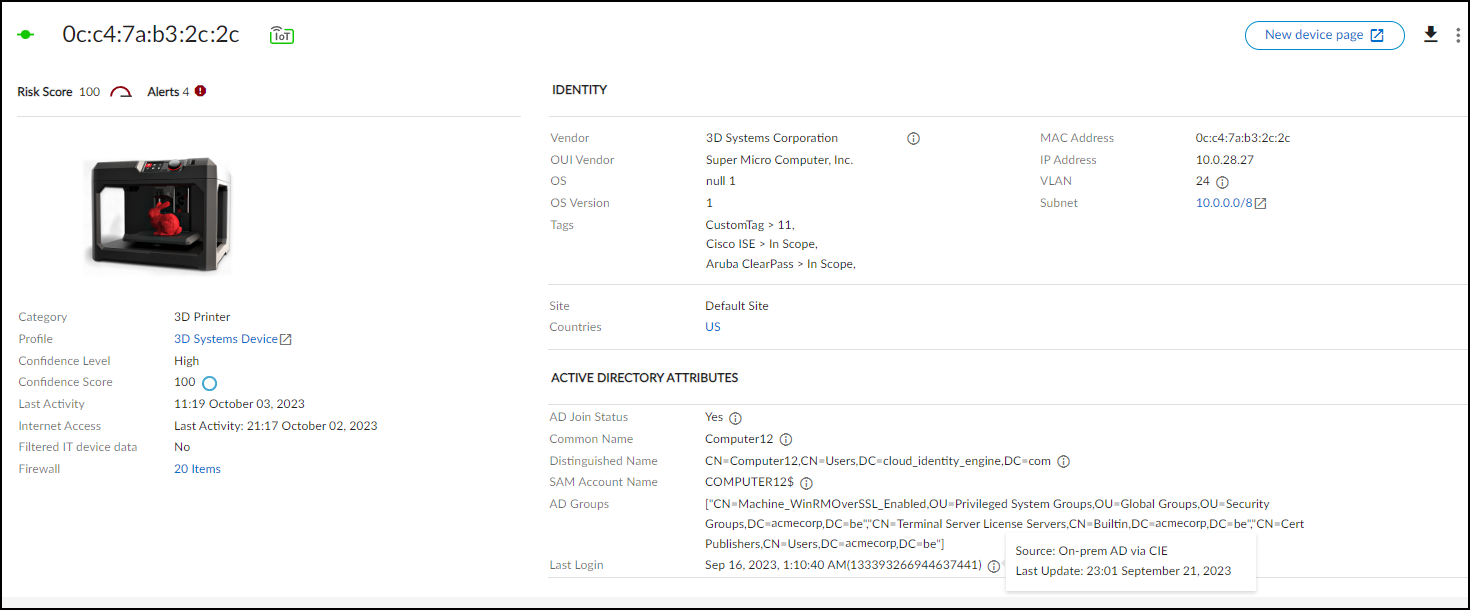
When CIE integration is enabled, these attributes are displayed in columns on the AssetsDevices page and in an Active Directory Attributes section on Device Details pages. IoT Security displays the source for attributes learned from Active Directory through CIE integration as On-prem AD via CIE .
For most device attributes, IoT Security uses the latest value it learns regardless of whether it’s discovered through network traffic or through an integration. However, there are eight attributes for which a value learned through network traffic has priority even if IoT Security later learns of a different value through integration:
|
Device attributes whose values when learned through network traffic have priority over values learned later through integration |
|
|
Model |
Firmware |
|
Vendor |
Serial number |
|
OS group |
Wired or wireless |
|
OS version |
VLAN |
If IoT Security learns a conflicting value for one of these attributes, it prioritizes the value learned through network traffic first and then through an integration (including CIE integration) second. The basic logic is as follows:
- Whatever new value is learned through network traffic replaces a value learned previously by any means.
- A new value learned through integration will replace a previously learned value learned through the same type of integration. It won’t replace a value learned through network traffic or through another type of integration.
Security (summary) : The information in the next section relates to security and includes the individual risk score for the device and whether baseline modeling is complete or still in progress. The current behaviors diagram shows evaluations for five types of behavior ranging from normal (near the center) to anomalous (near or beyond the edge).
When the Device Details page is for a medical device for which IoT Security has an MDS2 file , it displays information about device capabilities and operational states learned from the file such as the following:
- Remote service and patch support
- Personal health information (PHI) types and transmission support
- Antivirus installability and patchability
- Data storage and encryption
- Whether unnecessary applications and ports have been disabled
- Device communications both within and outside its local network
- Support for external user authentication
IoT Security uses the attributes listed in the MDS2 file to adjust the baseline risk level of the device. Risk factors based on MDS2 attributes contribute to a portion of the overall device risk score .
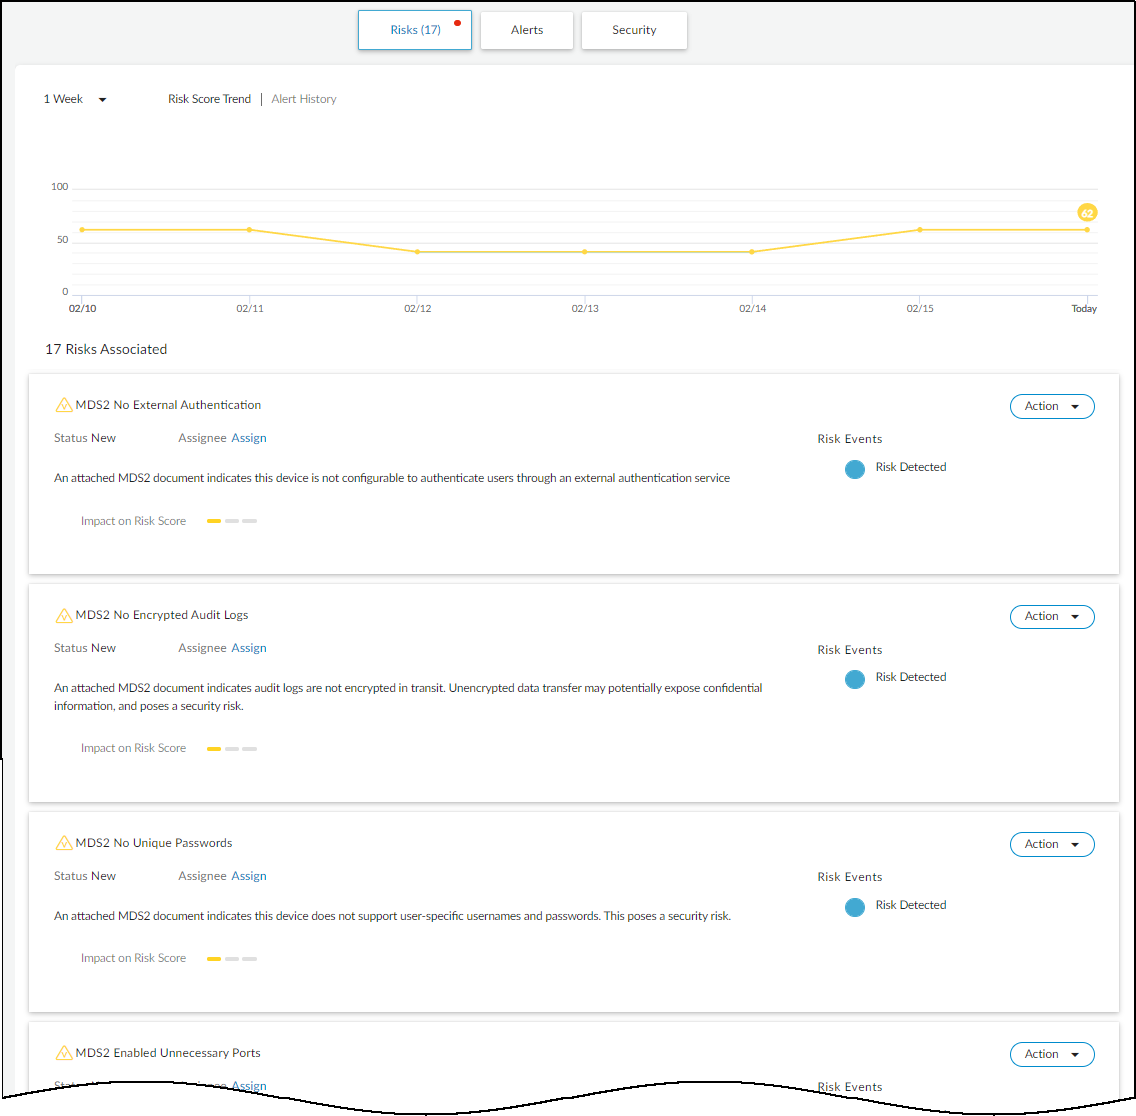
Risks : The Risks section contains the alerts, vulnerabilities, and anomalies that occurred to the device during the time range set at the top of the page. The events are displayed along a timeline and in a list with detailed information about each one.
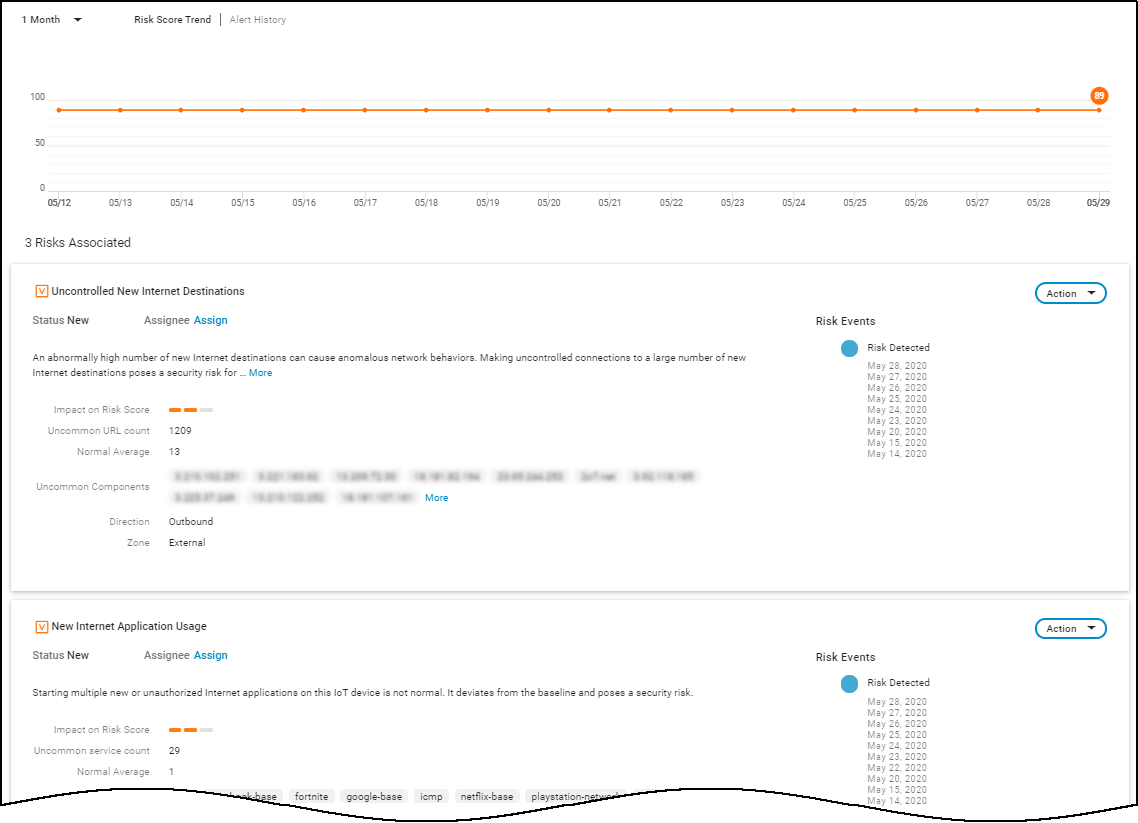
When IoT Security has recommendations for responding to a risk, it displays More Insights . Click it to expand the section and read more about how the impact of the risk on the device and network and what you can do to address it.
For medical IoT devices with MDS2 risks that were summarized near the top of the page, the risks are also listed with a few more details here. IoT Security displays them after any other detected vulnerabilities.
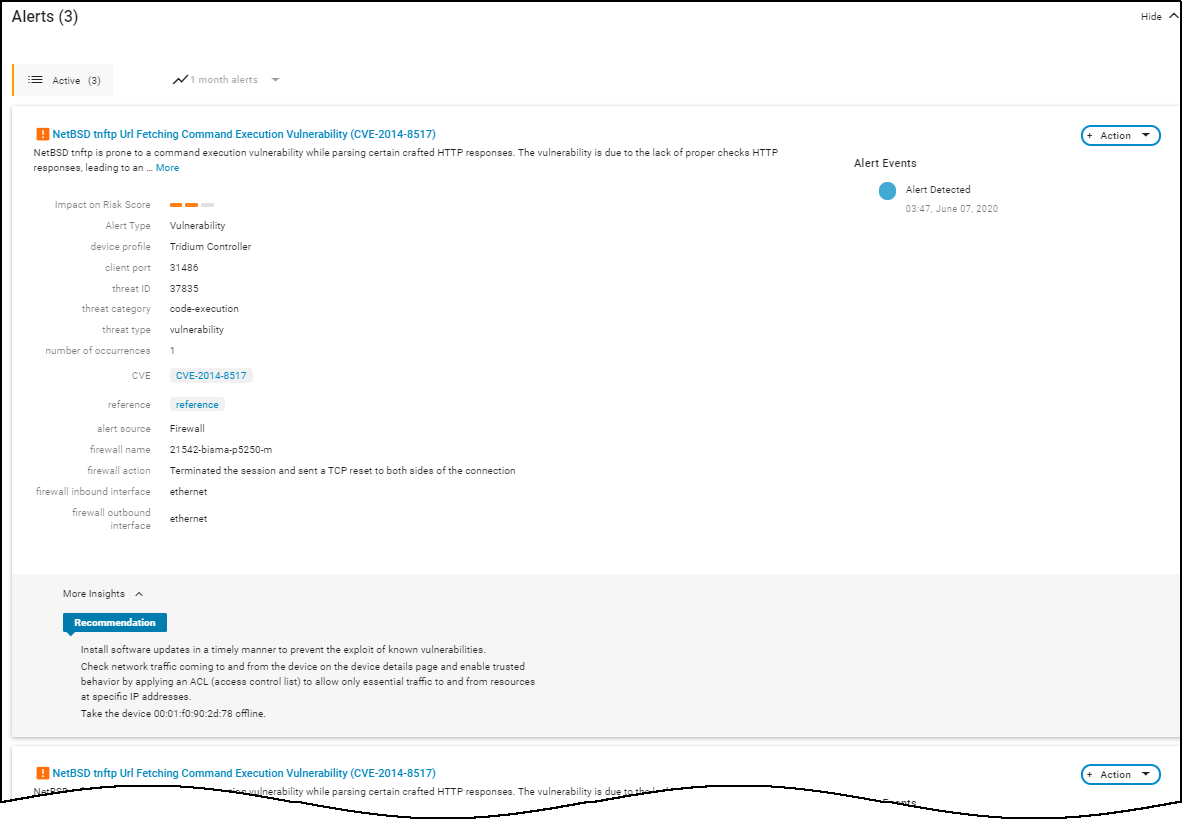
Alerts : This section contains only the alerts that the device raised during the specified time range. Alerts are a subset of risks, and IoT Security generates them when it detects irregular behavior and activity matching an alert rule. You can see when alerts occurred along a timeline, read details about them, and take action to resolve them.
Security : The Security section contains three subsections that show how a device connects to other devices on the network and which applications it’s using.
- Network Traffic : View a conceptual network topology displaying the nodes with which the device has formed connections. Use filters to display inbound or outbound connections; nodes with various alert levels; connections to nodes within the same VLAN, same intranet, or in the Internet; and so on.
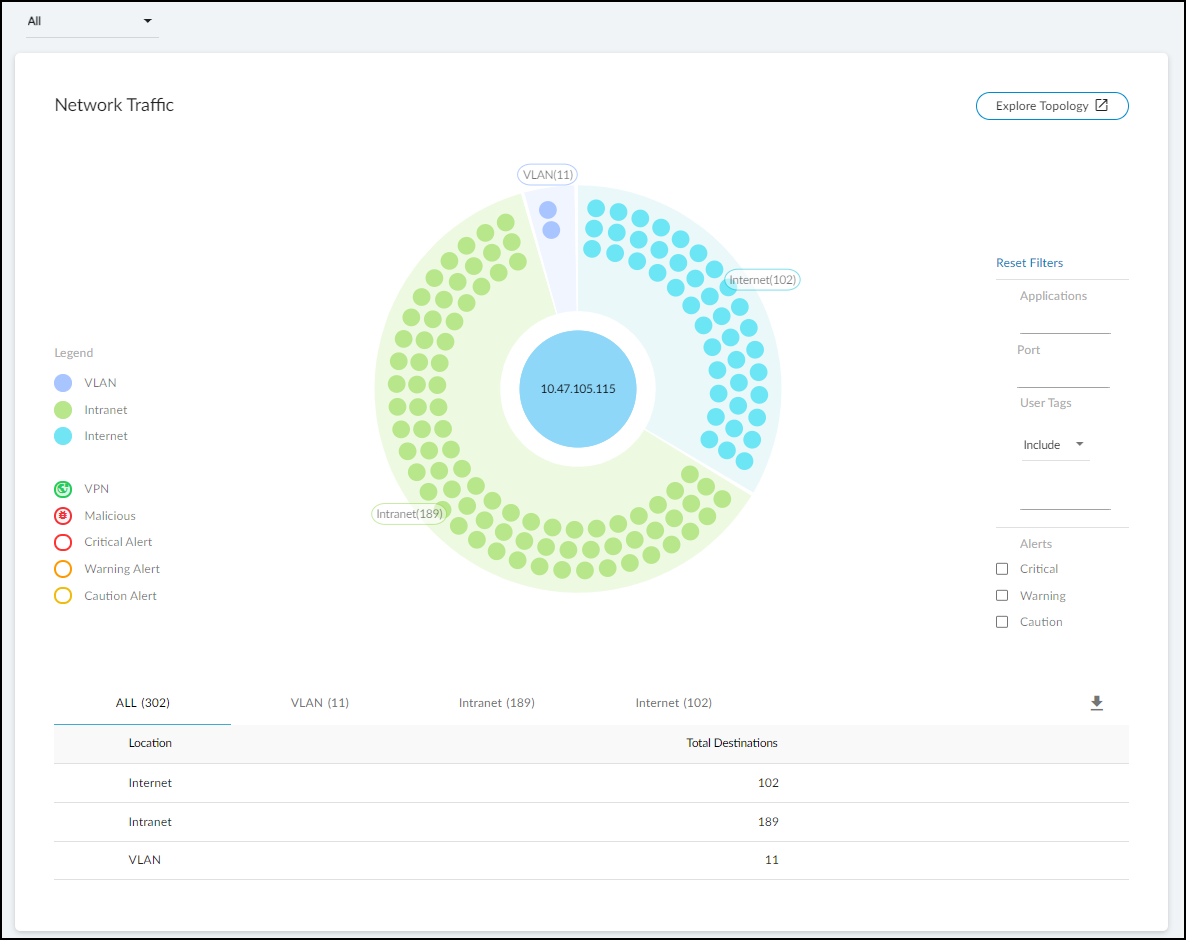
If you click Explore Topology , a new browser window opens with an informative display of internal and external connections from the device in focus. You can interact with the information, viewing details about each node and clicking different ones to put them in focus and see their connections.
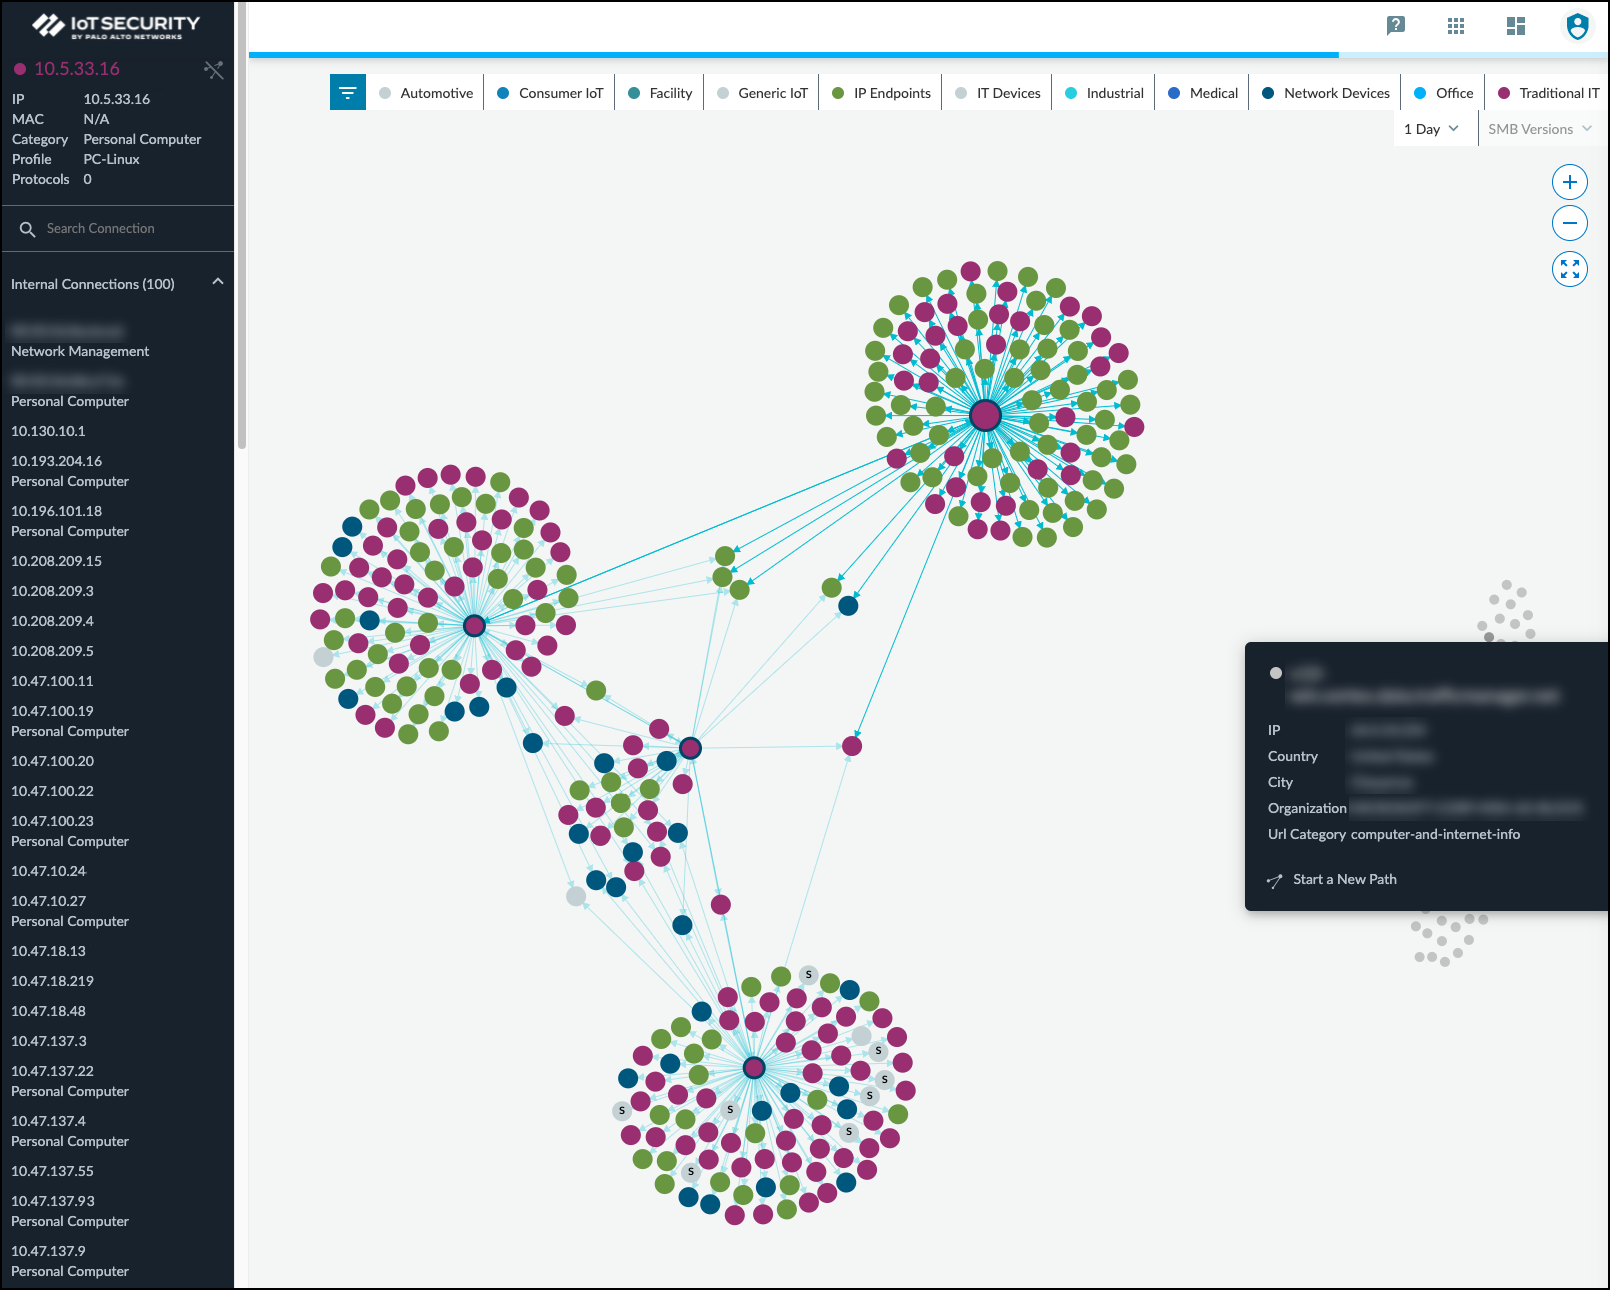
Any node with “S” on it is a server.
To learn more, watch a pair video explanations of the Topology Explorer. Part 1 covers navigation, information pop-ups, zoom, device category filters, and SMB filters. Part 2 looks at the information panel, how to explore the topology, and how to start a new path. Each video is about two to three minutes long.
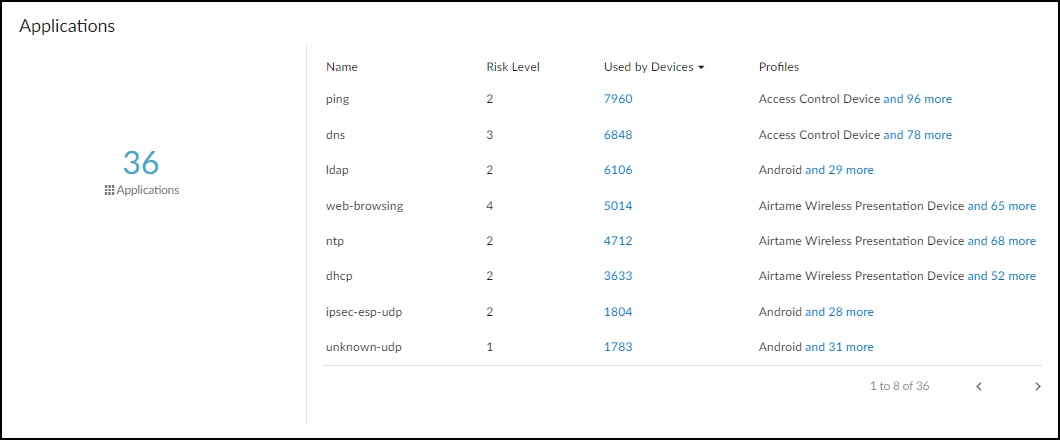
- Applications : This section shows the applications the device uses, their risk levels (a 1-5 scale with numbers closer to 5 indicating increased risk), and how many other devices and device profiles use the same application. Click a number in the Used by Devices column to open the Devices page with its contents filtered by the corresponding application. Hovering your cursor over the blue text of an entry in the Profiles column displays a list of all profiles that use that application.
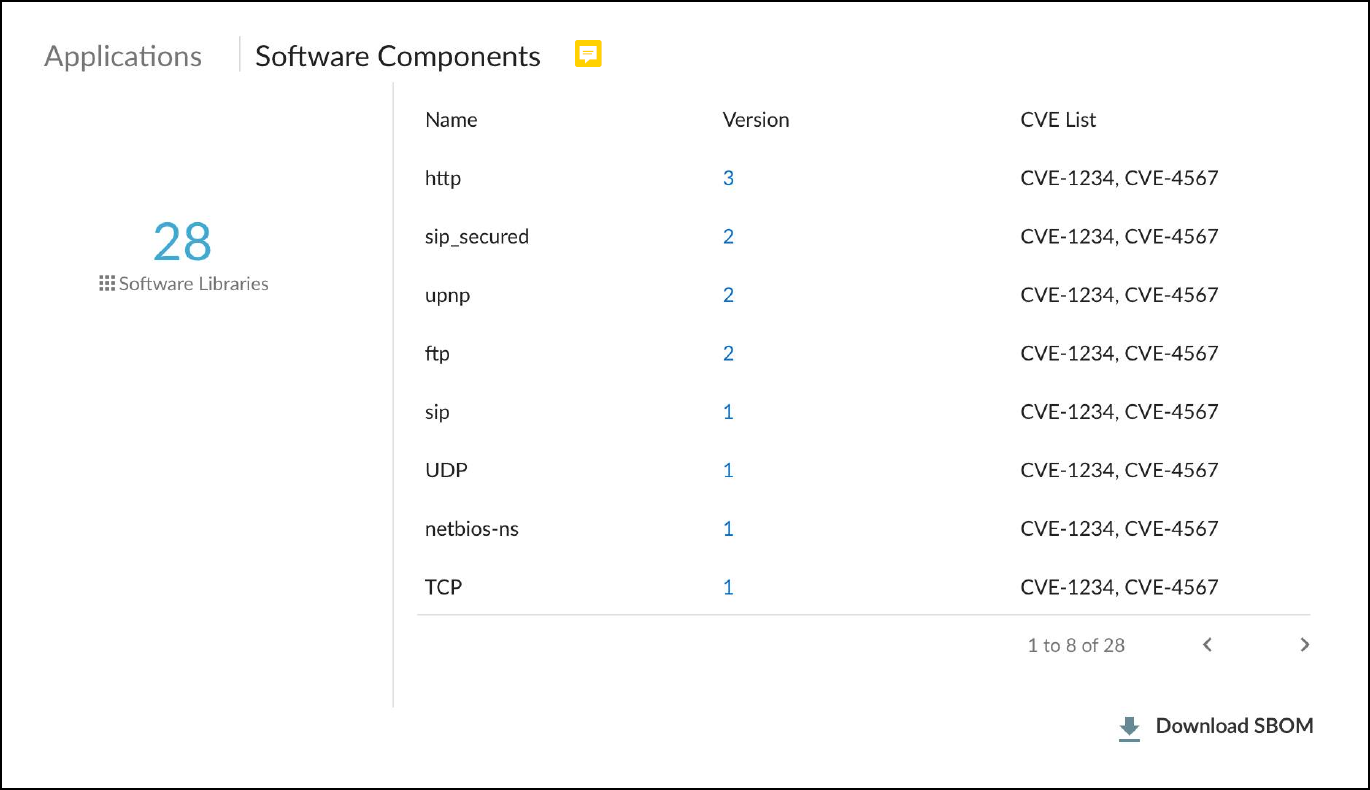
- Software Components : Most software makes use of various third-party software components such as libraries, modules, binaries, compilers, executables, files, and source code. The details of these components are increasingly being documented within Software Bills of Materials thanks to the Software Component Transparency initiative led by the U.S. National Telecommunication and Information Administration and with the participation of numerous manufacturers. A Software Bill of Materials (SBOM) is a comprehensive record detailing all the bits and pieces of software within a system or device and their relationships with each other. It’s essentially a nested inventory of software components and subcomponents, including firmware and embedded software. It also typically includes licensing, author, and version information plus other metadata. The purpose is to provide as much transparency as possible into the software contents running on devices so that we can better protect them from attack.
Some exploits specifically take advantage of the very lack of transparency and target vulnerabilities that occur in software components such as Spring4Shell, Urgent/11, Ripple20, and Log4j 2. Knowing which software components are on a device can expedite vulnerability detection, risk analysis, and remediation efforts. For example, the Log4j 2 vulnerability affects specific versions of the Apache Log4j 2 Java logging library, an open-source Java-based logging framework used by Java applications around the world. Attackers can exploit the vulnerability to launch denial-of-service attacks or gain remote control of target devices. The first step in responding to this threat is to identify which devices use the Log4j 2 Java logging library and, if so, if it’s a vulnerable version. With IoT Security, you can search your inventory for devices using this particular library and version–or for devices vulnerable to one or more of the related CVEs–in just seconds and save days or even weeks of response time.
IoT Security primarily learns SBOM information from traffic inspection of, for example, the user agent field in HTTP headers and to a lesser degree from other sources like FTP banners and HTTP URL information. It then shows the software components and version numbers identified in the SBOM for a device in the Software Components column on the Devices page. IoT Security also shows the software component name, version number, and any related CVEs in the Software Components section on the Device Details page.
You can download a device inventory report from the Devices page. The report includes a list of software component names and version numbers for all devices with software libraries detected by IoT Security.
You can also download the software library details for an individual device in Software Package Data Exchange (SPDX) format, which is one of the most common data standards for capturing SBOM data. To download the SPDX file, click Download SBOM at the bottom of the Software Components section. You can then open and read the SPDX file with any standard text editor.
The amount of data IoT Security learns is limited to whatever SBOM information devices send over the network and by what can be extracted from network traffic.
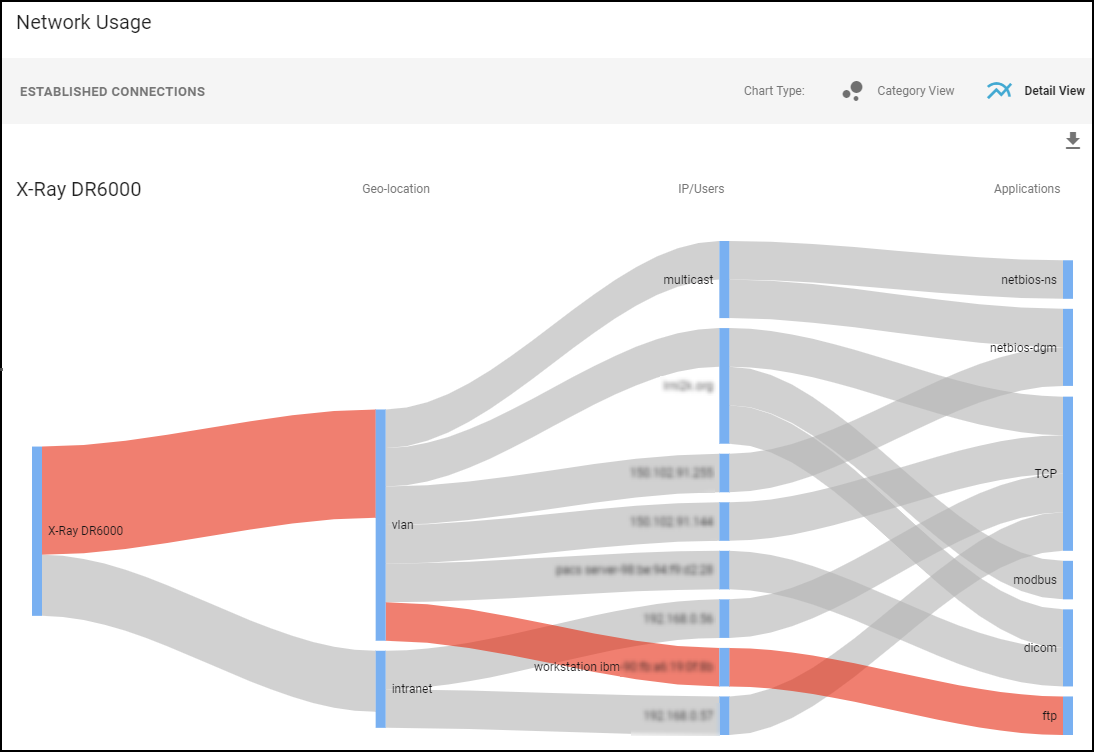
- Network Usage : The last section shows a Sankey diagram with lines indicating network connections. The red line indicates it’s involved in an alert of high severity. Click one of the blue bars and then click the Create Policy option that appears to create a policy with the following fields in the Policy Editor auto filled: (“Group #1” = source, and “Group #2 = destination).
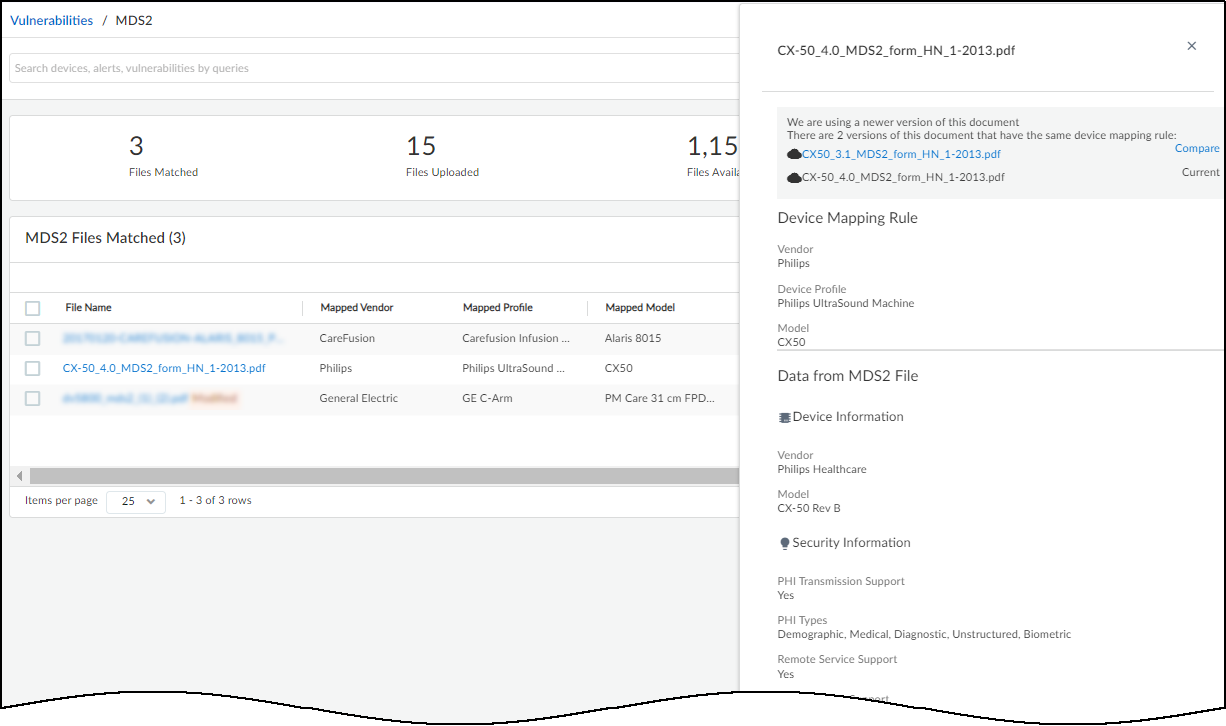
MDS2 (for medical IoT devices)
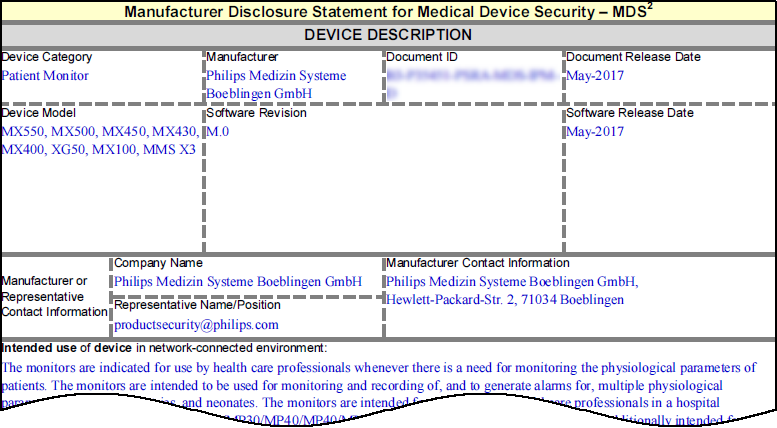
Medical device vendors often list the security-related features of their products in Manufacturer Disclosure Statement for Medical Device Safety (MDS2) forms, which they share with their customers. Vendors issue these MDS2 documents for each version of a medical device and include valuable information such as whether a device processes PHI (personal health information); if it stores PHI and, if so, if it's encrypted; and if antivirus software is installed on the device.
Over time, healthcare providers can collect thousands of MDS2 documents for thousands of medical devices. When used as intended, MDS2 documents can greatly enhance your security posture and incident response (IR). However, absorbing the details from these documents for the specific version of the software running on their connected devices is a daunting task. As a result, MDS2 files often go unused.
IoT Security simplifies the management and use of the MDS2 files you have. If you upload an MDS2 file for a device to IoT Security, it then includes this data along with other environmental factors when assessing the risk to the device. For example, if the software version of a device specified in an MDS2 file has a known vulnerability, IoT Security more precisely identifies it as a vulnerability instead of just a potential vulnerability. IoT Security supports MDS2 files in 2004, 2008, 2013, and 2019 formats.
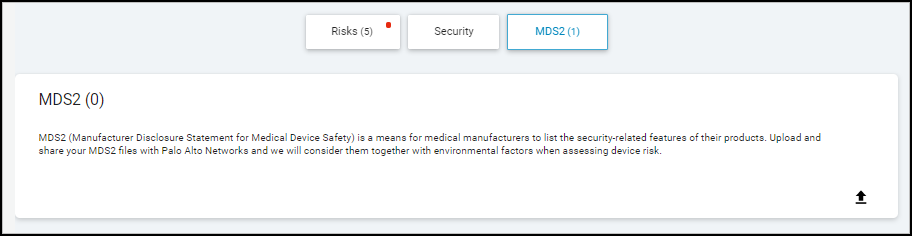
To upload an MDS2 file for one of your medical devices, click the MDS2 button on the Device Details page, click the upload icon in the lower right corner, and then navigate to your MDS2 document (its format must be PDF) and upload it.
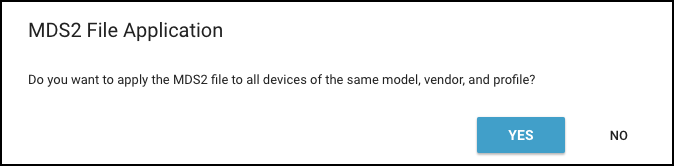
A prompt appears to apply the MDS2 file to all devices sharing the same model, vendor, and profile. To apply the MDS2 file to all devices with the same attributes, click Yes . To apply it to just this particular device, click No .
To upload MDS2 files and automatically apply them to all devices with matching model, vendor, and profile attributes, use the upload option on AdministrationMDS2 . For more information, see MDS2 .
An entry for the uploaded MDS2 file appears in the MDS2 section on the Device Details page with some upload details, device manufacturer name, and software revision number (if available). In addition, if you selected Yes when prompted to apply the MDS2 file to other devices with the same model, vendor, and profile and there are such devices, then IoT Security applies the uploaded MDS2 file to them as well.
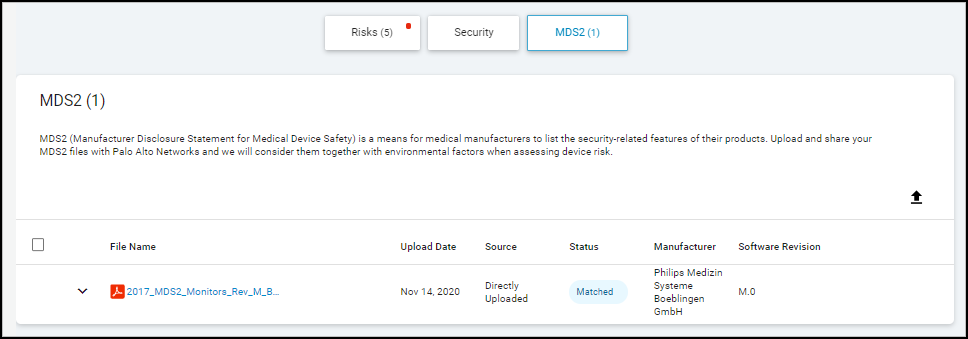
The upload date shows when this file was uploaded to IoT Security.
The timestamp uses the time zone specified on the Preferences page (
![]()
> Preferences).
The source of an uploaded MDS2 file is always Directly Uploaded , which means that a user manually uploaded the file to IoT Security.
The status of an uploaded file indicates one of the following states:
- Matched – The uploaded file is a PDF containing correctly formatted fields
- Cannot Extract Data – The file is a PDF with incorrectly formatted fields
- Unsupported File Type – The uploaded file is not a PDF
If the file status is either of the last two states, hover your cursor over the table row with the MDS2 file and then click the Delete icon that appears on the far right (
![]()
).

To see more details about the device and MDS2 file, expand the row.
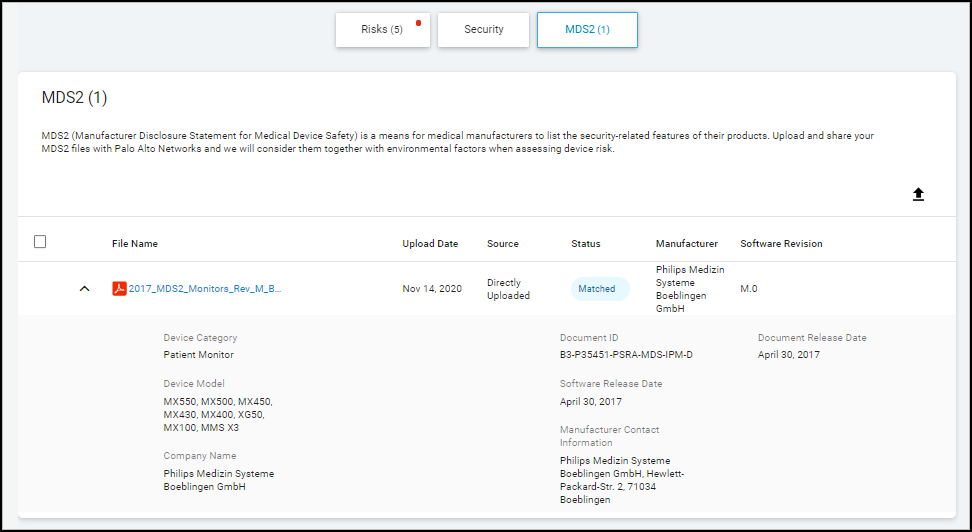
A manufacturer might release an updated MDS2, perhaps to add more models to the Device Model list, change its Manufacturer Contact Information, or for some other reason. If so, delete the first MDS2 file and then upload the new file.
To see a preview of an MDS2 file, hover your cursor over its table row, which causes the preview icon to appear (
![]()
). Either click the icon or hover your cursor over it to see the file in a pop-up preview window.
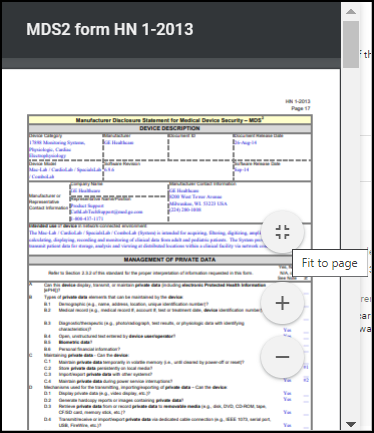
Use the viewing options to scroll through the file and zoom in and out.
To view the file itself, click the filename. IoT Security downloads the PDF file so you can open and view it locally.
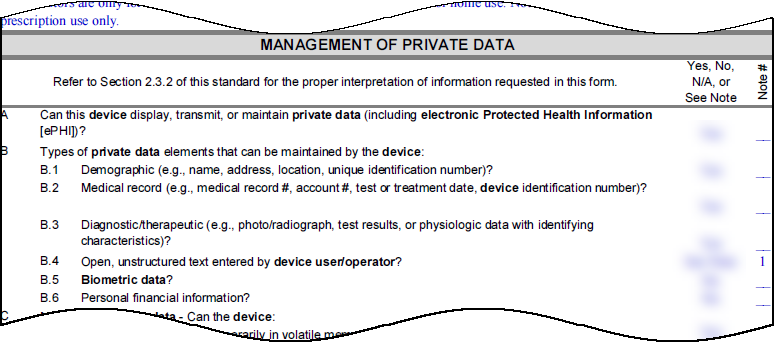
IoT Security uses several fields in MDS2 forms for risk detection:
- Can this device display, transmit, or maintain private data?
- What types of private data elements can be maintained by the device?
- Can security patches or other software be installed remotely?
The wording for these questions varies in different versions of MDS2.
This information can help IoT Security assess risk. For example, if an MDS2 file states that a device doesn't support remote servicing and IoT Security detects an inbound connection from an external source, it will flag this as anomalous behavior and generate a security alert. Similarly, if an MDS2 file states that a device cannot be remotely patched, any attempted inbound file transfer from an external location will also be treated as anomalous and trigger an alert.
Create Multi-interface Devices
IoT Security Device Details Page
Devices with Static IP Addresses
|
Where Can I Use This? |
What Do I Need? |
|
|
Some devices have multiple network interfaces. These can be networking and security devices like L3 switches and firewalls with multiple network ports or physical endpoint devices, such as printers, that can connect to both wired and wireless networks.
Because each interface on a multi-interface device has its own MAC address and IP address, IoT Security initially considers each interface as a separate single-interface device. This can result in duplicate devices in your asset inventory and duplicate vulnerabilities. When IoT Security detects two or more devices that share common attributes, such as hostname or serial number, it provides a recommendation for you to group them as different interfaces on the same multi-interface device. In addition to accepting the recommendation as is, you can modify or ignore the recommendation and merge other devices instead. The merge process involves assigning one “device” as the primary interface and the others as secondary interfaces. When you do this, IoT Security applies the device-level attributes of the primary interface to the entire multi-interface device while retaining the network-level attributes for each interface.
|
Device-level attributes originally learned from the device assigned to be the primary interface and then applied to all merged interfaces |
Network-level attributes originally learned on each previously unmerged device and retained for interfaces on the merged device |
|
Category |
IP address |
|
Device name |
MAC address |
|
Endpoint protection (vendor) |
OUI vendor (NIC vendor) |
|
Model |
Site |
|
OS group |
Status (network connectivity) |
|
OS combined (OS group + OS version) |
Subnet |
|
Patient health information support (Medical IoT only) |
Switch |
|
Profile |
Tags |
|
Risk level |
Wireless access point |
|
Risk score |
VLAN |
|
Serial number |
All network attributes except those for CMMS (computerized maintenance management system), EDR (endpoint detection and response), and External Inventory |
|
Type |
All traffic attributes except the following: Software, Software Components, and Restricted Traffic. |
|
Vendor |
– |
These attributes are assigned to a multi-interface device at the time individual devices are merged and become interfaces on a single device. After the merge, they can continue to change based on the network behaviors that IoT Security observes. IoT Security also merges vulnerabilities, security alerts, risk scores, and reports of the previously separate devices as they become interfaces on one device.
Merge Devices into a Multi-interface Device
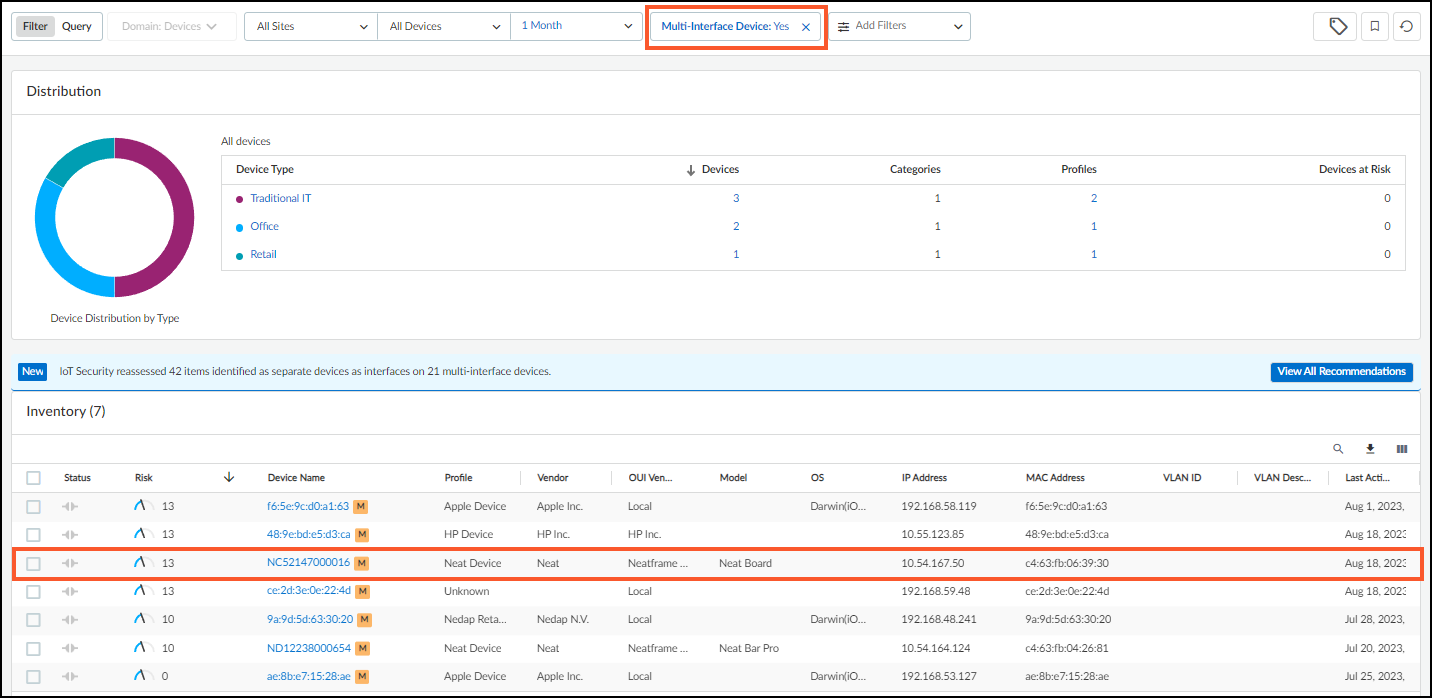
You can merge one or more devices into a single multi-interface device based on IoT Security recommendations or create your own multi-interface device without recommendations. When IoT Security has recommendations, it displays a notification above the Inventory table on the AssetsDevices page.

- View the groups of two or more single-interface devices that IoT Security recommends be merged into multi-interface devices.
- To see the list, click View All Recommendations above the Inventory table.
A panel opens on the right of the Devices page showing all the devices that IoT Security recommends merging together and the reason for each recommendation.
- Click the arrow to the left of a recommendation to see the individual devices to be merged.
IoT Security displays the name and profile of each single-interface device that it recommends merging into one multi-interface device.
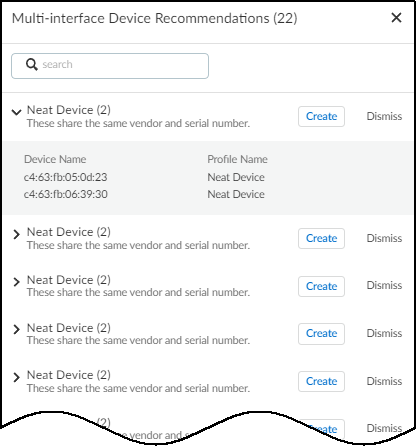
Clicking Create starts the merge process. Clicking Dismiss permanently dismisses the recommendation. However, if a dismissed recommendation changes—a device is added to the original recommendation or removed from it—IoT Security will make a revised recommendation.
- Merge individual devices into a single multi-interface device.
- Click Create for the multi-interface device you want to create.
This launches a three-step process, the first of which is the selection of devices to merge. The devices that IoT Security chose appear in a Selected Devices section above the rest of the devices in the All Devices section.
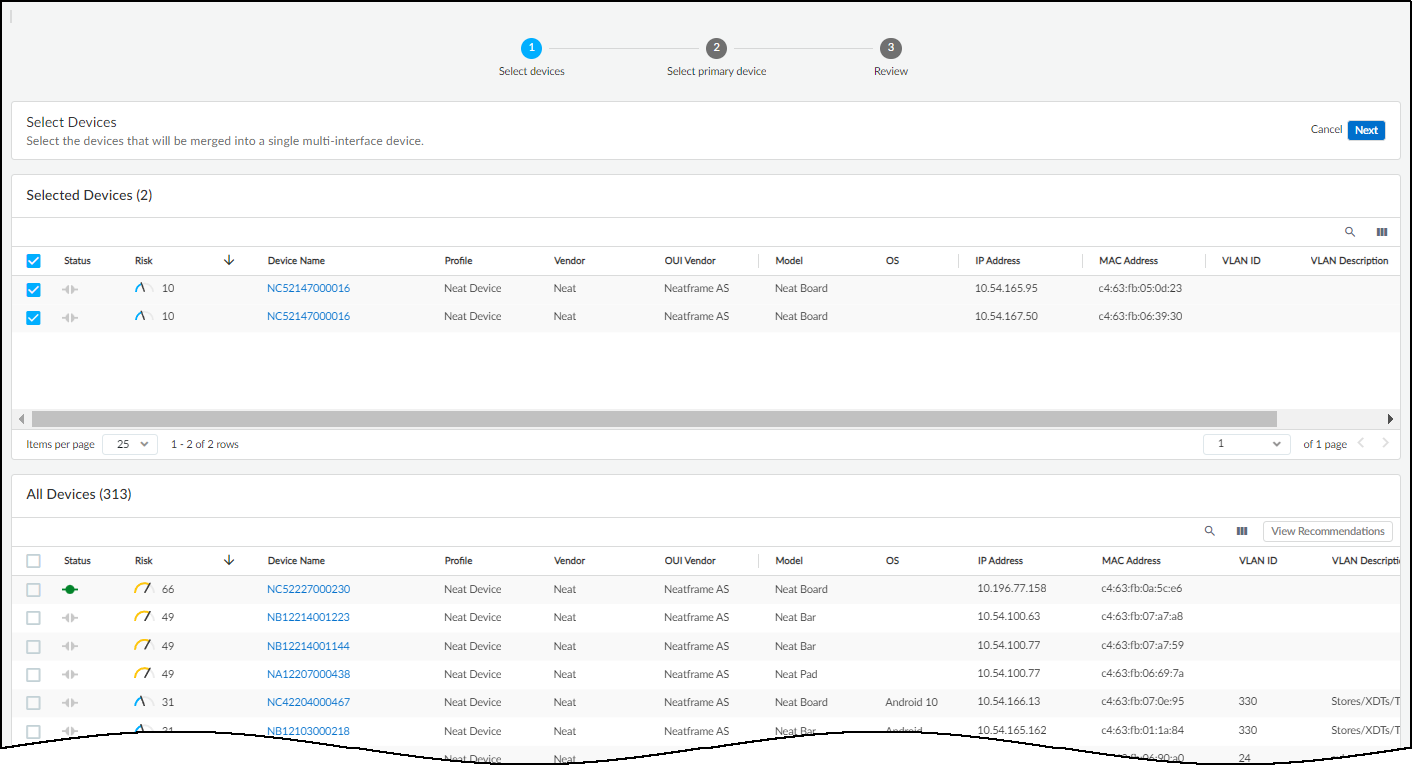
- Keep the IoT Security-recommended devices selected if you want to include them in the multi-interface device, clear any you want to exclude, and add more from the All Devices table if you think they should also be included.
Any devices that you select in All Devices are also shown in Selected Devices.
You can’t add a previously merged multi-interface device to another multi-interface device.
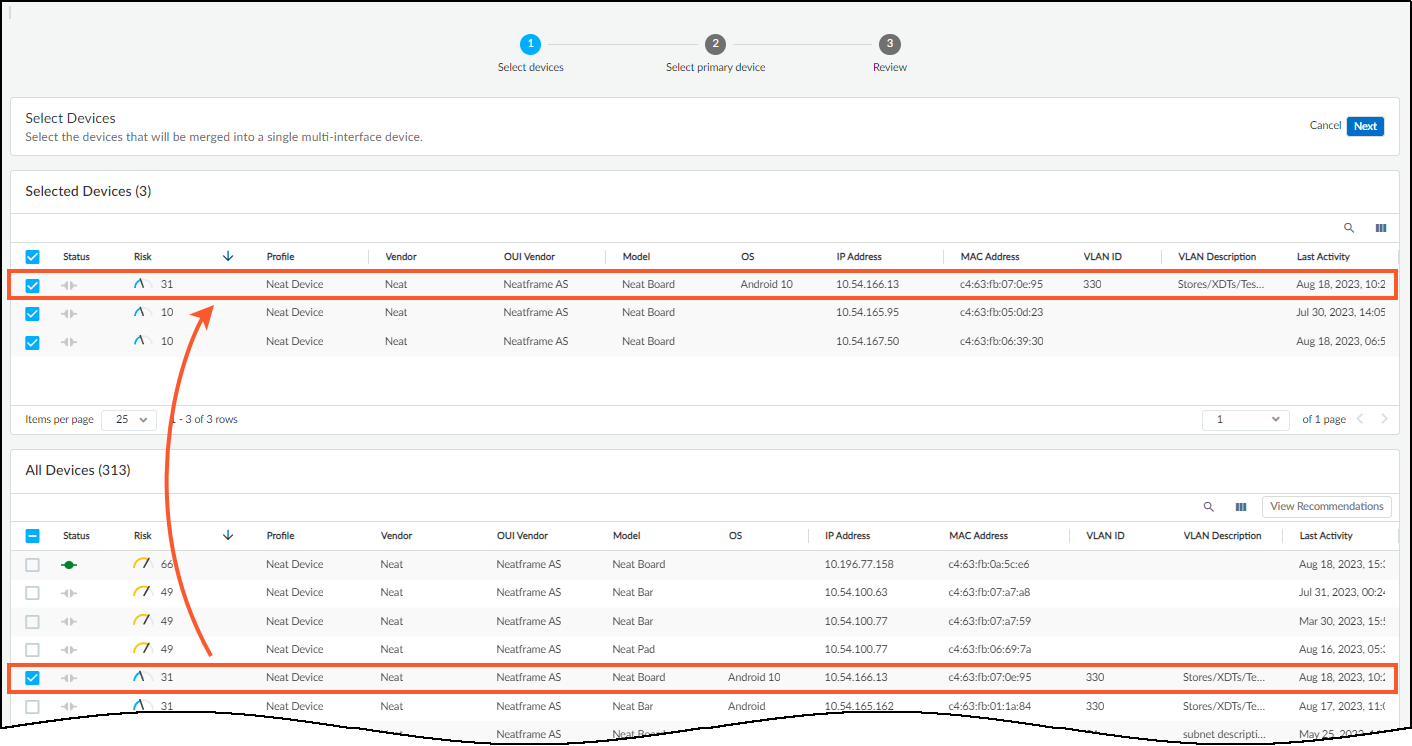
- When you’re satisfied, click Next .
- Select the primary interface of the multi-interface device.
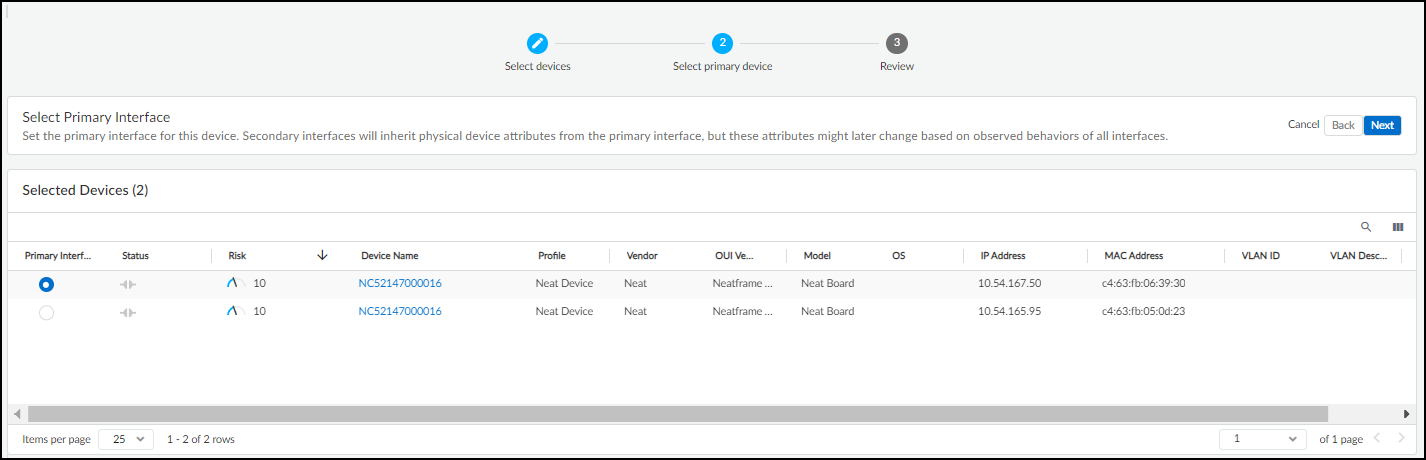
While all interfaces retain their network-specific attributes (IP address, MAC address, subnet, and VLAN), the merged device will use the physical device attributes from the primary interface. You might consider choosing the interface that processes the most traffic because IoT Security most likely has the most data from this interface and, therefore, the most accurate device identification and risk analysis. If you have a dedicated management subnet and VLAN on your network, another option is to choose the interface in that subnet and VLAN.
- After you’ve selected the primary interface for the device, click Next and then expand different sections to review the merged attributes.
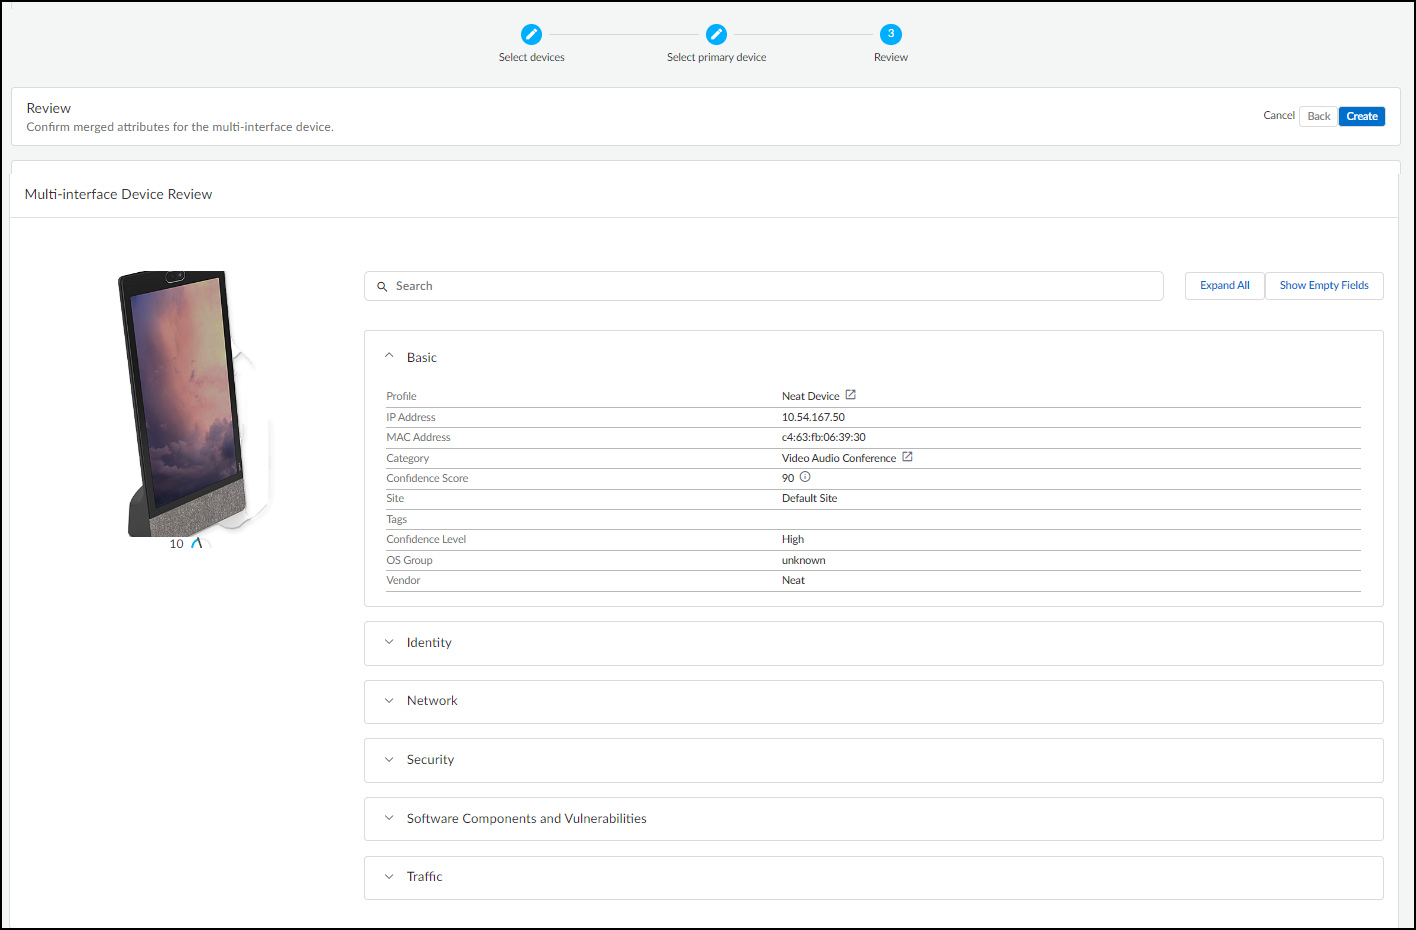
You can click Expand All to view all six sets of attributes at once and then Collapse All to close them together. You can reduce the height of expanded sections by clicking Hide Empty Fields . To see all fields-–both those with data and those without— click Show Empty Fields .
You can also see this information later in the Attributes section on the Device DetailsNew device page after you create the multi-interface device.
- When you’re satisfied and want to complete the merge process, click Create .
- To see the merged device on the Assets > Devices page, add a filter to show multi-interface devices.
The newly created multi-interface appears in the Inventory table with the multi-interface device icon (
![]()
) after its device name.
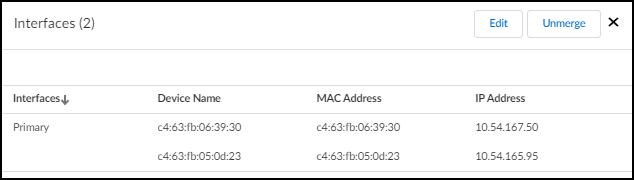
- Click the multi-interface device icon (
![]()
) to see its interfaces with the primary interface identified at the top, and to access the Edit and Unmerge options.
- ( Optional ) Edit a multi-interface device.
After creating a multi-interface device, you can later change the primary interface, merge more devices as interfaces into it, remove one or more interfaces from it, or unmerge all interfaces.
To change the primary interface on a multi-interface device:
- Select AssetsDevices , click the multi-interface icon (
![]()
) to open the Interfaces panel for the device whose primary interface you want to change, and then Edit .
- Click Next to advance to the step where you select a primary interface.
- Select the interface that you want to make the new primary interface and then click Next .
- Review the settings to make sure the new primary interface is the one you want it to be and then Create .
To add one or more interfaces to an existing multi-interface device:
- Select AssetsDevices , click the multi-interface icon (
![]()
) to open the Interfaces panel for the device to which you want to merge one or more single-interface devices as interfaces, and then Edit .
- Select one or more devices in the All Devices table that you want to convert from single, separate devices to interfaces on the multi-interface device and then click Next .
- Either keep the previously selected primary interface in its role or make another interface the primary if you want and then click Next .
- Create .
To remove one or more interfaces—but not all—and return them to the inventory as individual single-interface devices while keeping the multi-interface devices:
- Select AssetsDevices , click the multi-interface icon (
![]()
) to open the Interfaces panel for the device whose interfaces you want to remove, and then Edit .
- Clear the selection of the interfaces that you want to remove from the multi-interface device and then click Next .
- Either keep the previously selected primary interface in its role or make another interface the primary if you want and then click Next .
- Create .
To unmerge all interfaces:
- Select AssetsDevices , click the multi-interface icon (
![]()
) to open the Interfaces panel for the device whose interfaces you want to unmerge, and then Edit .
- Confirm the unmerge operation and return of each interface to an individual single-interface device.
Devices with Static IP Addresses
Create Multi-interface Devices
Upload a List of Static IP Devices
|
Where Can I Use This? |
What Do I Need? |
|
|
While most network-connected devices receive their IP addresses dynamically through DHCP, it’s common to reserve part of the network address space for use as static IP addresses for devices such as routers, printers, FTP servers, and DHCP servers. Beyond this common practice, there are some industries and facilities that use static IP addresses predominantly; for example, manufacturing, utilities, oil and gas, warehouses, order fulfillment centers, and processing and distribution centers. Because most automation and control applications use the IP address directly in their programs, it's important that robotic devices and controllers in assembly lines and processing centers have static IP addresses, which is why static addressing is so prevalent in these areas.
IoT Security can be deployed in networks where DHCP dynamically assigns IP addresses to devices, where network administrators manually configure devices with static IP addresses, and where there’s a combination of both. IoT Security uses multiple techniques for detecting and monitoring network activity and correlating it to individual devices. By examining the DHCP traffic logs that firewalls provide, it associates dynamically assigned IP addresses with device MAC addresses and adds these devices to its inventory. By looking at ARP logs, IoT Security also learns IP address-to-MAC address mappings and adds devices with static IP addresses, which might not otherwise be discovered through DHCP, to its inventory as well. However, by the very nature of ARP broadcasts, this only works for devices within the same Layer 2 broadcast domains as the reporting firewalls. For devices with static IP addresses beyond Layer 2 boundaries, IoT Security uses machine learning to discover network activity patterns indicating the likely presence of such devices. You also have the option of manually providing IoT Security with static IP address assignments through static IP device and subnet configurations.
Providing IoT Security with a static IP address configuration by itself is not enough to add a device to the inventory. IoT Security must also detect network traffic to or from a device with a configured static IP address. Then it adds the device to its inventory.
Use one of the following methods to add static IP devices and subnets to the IoT Security inventory:
Upload a List of Static IP Devices
Devices with Static IP Addresses
Add a Static IP Device Configuration
|
Where Can I Use This? |
What Do I Need? |
|
|
If you have a list of the static IP addresses for your devices, enter them in a CSV (comma-separated values) file and upload it to IoT Security.
There is a limit of 10,000 static IP devices for each uploaded CSV file. If you need to upload more than 10,000, upload multiple CSV files.
- Navigate to the User-Defined Static IP Devices page ( AssetsDevicesUser-Defined Static IP Devices ) and then click AddUpload Static IP Devices .
- Click the link to download the CSV template.
- Fill out the template with static IP device information or create a new file in the same format as the template and fill that out.
Enter the static IP address of each device you want to upload. Optionally enter its MAC address, vendor, and model in the columns indicated in the template. IoT Security accepts any of the following MAC address formats:
|
aa:bb:cc:00:11:22 |
AA:BB:CC:00:11:22 |
|
aa.bb.cc.00.11.22 |
AA.BB.CC.00.11.22 |
|
aa-bb-cc-00-11-22 |
AA-BB-CC-00-11-22 |
|
aa bb cc 00 11 22 |
AA BB CC 00 11 22 |
|
aabbcc001122 |
AABBCC001122 |
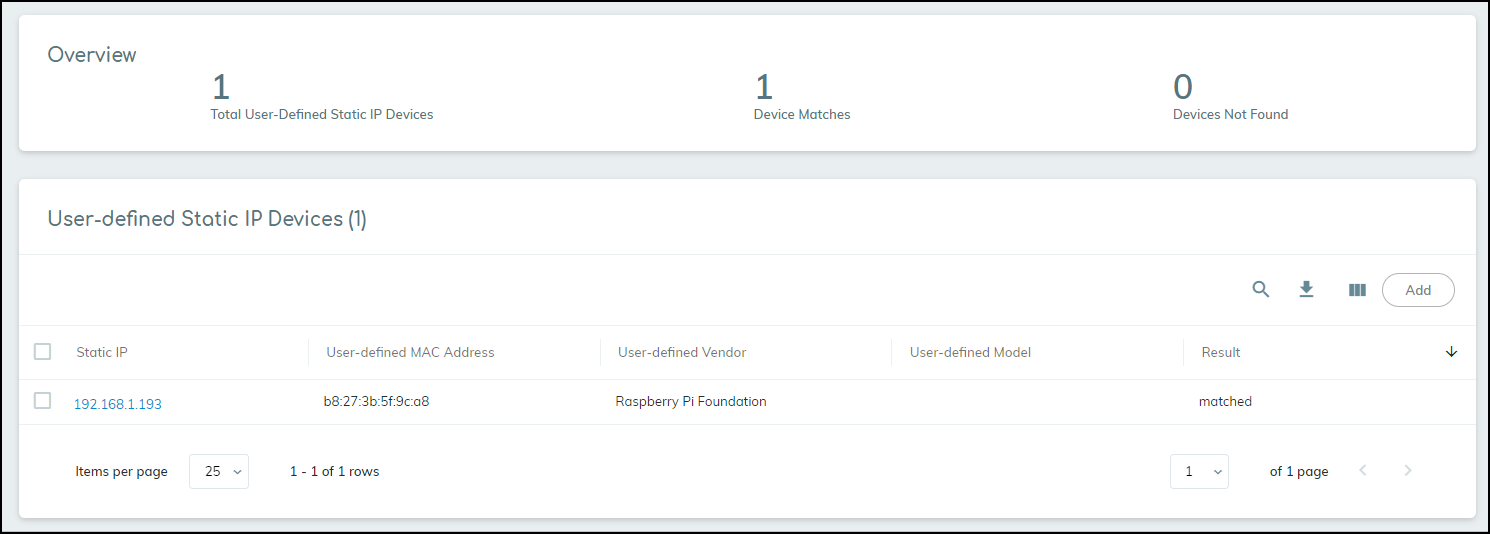
IoT Security uses IP addresses rather than MAC addresses to identify and track static IP devices. The additional user-configured attributes provide extra information when referring to entries on the User-Defined Static IP Devices page later. However, only the uploaded IP addresses and (if provided) MAC addresses will ever appear on the Devices and Device Details pages.
- Return to the User-Defined Static IP Devices page, click AddUpload Static IP Devices , choose or drag the completed CSV file onto the space in the dialog box, and then Upload .
If IoT Security previously detected network activity from one of the uploaded IP addresses, it’s considered a match. The Device Matches counter at the top of the page increases incrementally and “matched” appears in the Result column for this IP address. IoT Security then adds the static IP device to its inventory and displays it on the Devices and Device Details pages. It takes several minutes for IoT Security to check for potential matches with existing data and then update the inventory and static IP device list accordingly.
If IoT Security has not yet detected network activity for one of the uploaded IP addresses, it’s considered “not found”. In this case, the Devices Not Found counter increases incrementally and a dash appears in the Result column. If IoT Security later discovers network activity for this IP address, it moves it from “not found” to “matched”, adds the static IP device to its inventory, and begins displaying it on the Devices and Device Details pages.
If a user-defined MAC address is different from a MAC address IoT Security detects on the network, the detected MAC address overrides the user-defined one.
Add a Static IP Device Configuration
Upload a List of Static IP Devices
Upload a List of Subnets with Only Static IP Addresses
|
Where Can I Use This? |
What Do I Need? |
|
|
Instead of uploading a CSV file with a list of static IP devices (see Upload a List of Static IP Devices ), you can add them individually.
- Navigate to the User-defined Static IP Devices page ( AssetsDevicesUser-Defined Static IP Devices ) and then click AddManually Add a Static IP Device .
- Define a static IP device and then click Add .
IP Address : Enter the static IP address of the device you want to add to your inventory. The IP address is what IoT Security uses to track user-defined static IP devices.
MAC Address (optional): If you want, add the MAC address of the device in hexadecimal notation. IoT Security accepts any of the following MAC address formats:
|
aa:bb:cc:00:11:22 |
AA:BB:CC:00:11:22 |
|
aa.bb.cc.00.11.22 |
AA.BB.CC.00.11.22 |
|
aa-bb-cc-00-11-22 |
AA-BB-CC-00-11-22 |
|
aa bb cc 00 11 22 |
AA BB CC 00 11 22 |
|
aabbcc001122 |
AABBCC001122 |
If the user-defined MAC address is different from the MAC address IoT Security detects on the network, the detected MAC address overrides the user-defined one. If IoT Security does not detect a MAC address, the user-defined MAC address appears on the Devices and Device Details pages.
Vendor (optional): Enter the vendor for this device.
Model (optional): Enter the device model.
The vendor and model attributes provide extra information when referring to entries on the User-Defined Static IP Devices page later. However, they do not appear on the Devices and Device Details pages.
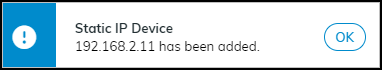
- Click Add to add the configuration to IoT Security and then click OK to close the confirmation message that appears.
After you add the static IP device, IoT Security initially treats it as “not found”. It incrementally increases the Total User-Defined Static IP Devices counter by one and the Devices Not Found counter by one. Although it adds an entry for it to the User-Defined Static IP Devices list, the Result column remains empty--there isn’t a “matched” entry, indicating that IoT Security detected network activity for this IP address, or a dash, indicating that no such activity was detected.
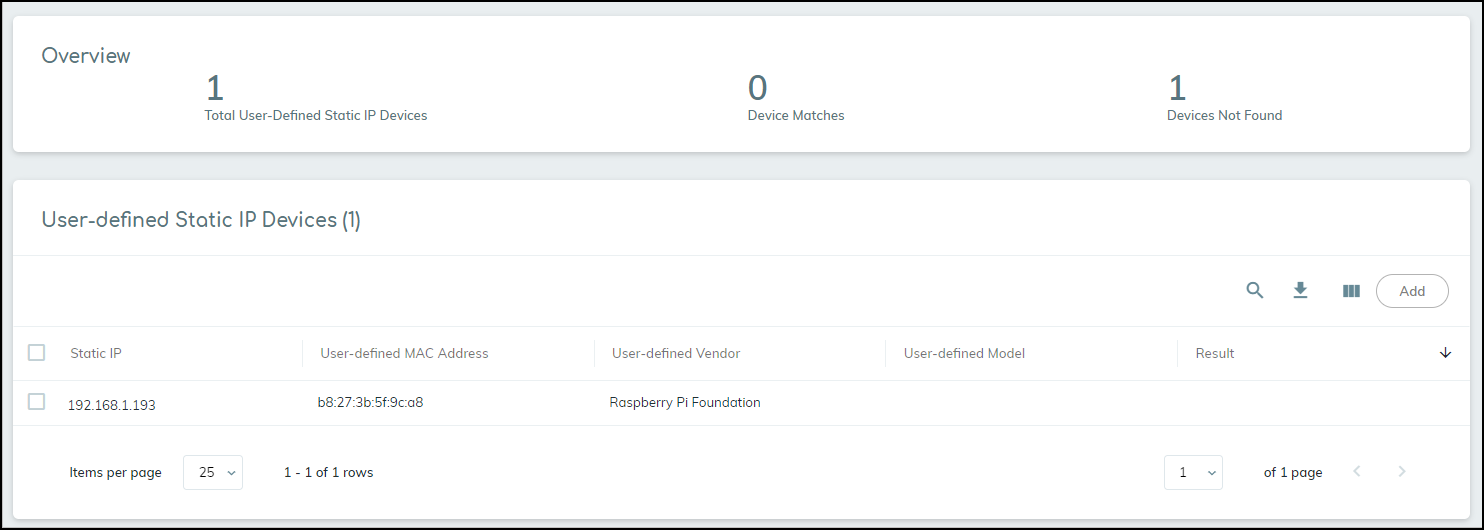
Because IoT Security periodically compares entries in the user-defined static IP devices list with those in its inventory and its internal database of detected IP addresses without accompanying MAC addresses, the page can remain in this initial state for several minutes.
If a match is found, the Device Matches counter increases by one and the Devices Not Found counter decreases by one. Also, “matched” now appears in the Result column.
If IoT Security does not find a match, it eventually displays a dash in the Result column.
You might have to reload the User-defined Static IP Devices page to see the updated data.
Upload a List of Subnets with Only Static IP Addresses
Add a Static IP Device Configuration
Add a Subnet with Only Static IP Addresses
|
Where Can I Use This? |
What Do I Need? |
|
|
In the case where an entire subnet consists of static IP addresses, it’s more efficient to add a subnet and define it as having static IP addresses than adding numerous static IP devices individually. When you have multiple subnets with static IP addresses, you can upload all of them in a CSV file at once.
There is a limit of 10,000 subnets for each uploaded CSV file. If you need to upload more than 10,000, upload multiple CSV files.
After you provide IoT Security with a subnet configuration specifying that it has static IP addresses and then IoT Security detects traffic from a device in that subnet, it considers the device a static IP device. Using the IP address as the device ID (instead of a MAC address), it adds the device to its inventory. IoT Security adds static IP devices to its inventory in this manner only for devices that are not discovered through other detection mechanisms such as ARP logs.
If you later remove a static IP subnet after IoT Security added static IP devices for this subnet to its inventory, IoT Security reverses this action and automatically removes them from its inventory.
- Navigate to the Networks page ( NetworksNetworks and SitesNetworks ) and then click AddUpload Subnets .
- Click the link to download the CSV template.
- Fill out the template with subnet information.
Enter the following for each subnet you want to upload:
prefix : Enter the IP address of the subnet in dot-decimal notation and its netmask in CIDR notation (example, 10.1.1.0/24). This appears on the Subnets page, and for a device in this subnet, the subnet and netmask appear on the Devices and Device Details pages.
vlan : (Optional) Enter a VLAN ID. If entered, this also appears on the Subnets page, and for a device in this subnet, it appears on the Devices and Device Details pages.
description : (Optional) Enter a description of the subnet/VLAN, perhaps noting the type of devices for which it’s intended. These special characters are not allowed in the description field: ~ ` ! # $ % ^ & * + = { } [ ] | \ < > ? This description only appears on the Subnets page.
static : Enter yes to define this as a subnet containing static IP addresses. When IoT Security discovers a device from a user-configured static IP subnet in a different L2 domain from the firewall and adds it to its inventory, the Source column on the Devices page shows User-Configured . (Leave it blank if you do not want the subnet to be static).
monitored : Enter yes if you want IoT Security to provide device profiling, behavioral analysis, and risk monitoring of the devices in this subnet. Leave it blank if you only want IoT Security to detect the devices in the subnet and perform a simplified device identity analysis. Based on this field, the IoT Security portal displays Yes or No in the Monitored column in the Networks table on NetworksNetworks and SitesNetworks tab and provides the appropriate level of device monitoring, analysis, and protection.
The Add a subnet option does not provide an option to specify a subnet as monitored or unmonitored. IoT Security automatically classifies an added subnet as monitored. However, you can change its classification after you add it by selecting the subnet and clicking Stop Monitoring above the Networks table. You can also make multiple selections to stop monitoring multiple subnets at the same time. Later you can select unmonitored subnets and click Start Monitoring above the table.
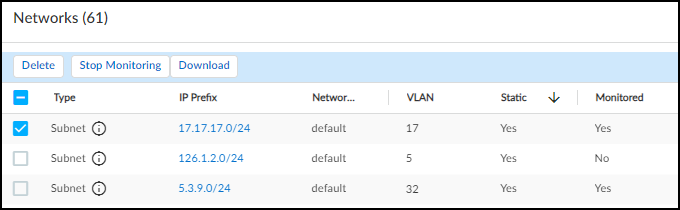
- Upload the CSV file.
On the Networks page, click AddUpload Subnets , choose or drag the completed CSV file onto the space in the dialog box, and then click Upload .
If IoT Security previously detected network activity from an IP address in one of the uploaded subnets, it now considers it a static IP address and automatically adds a static IP device to the inventory on the Devices page. Similarly, if IoT Security later detects traffic from an IP address in one of these subnets, it automatically adds an entry to the inventory at that time.
It can take several minutes for new entries to appear on the Devices page.
Add a Subnet with Only Static IP Addresses
Upload a List of Subnets with Only Static IP Addresses
Devices with Overlapping IP Addresses
|
Where Can I Use This? |
What Do I Need? |
|
|
Instead of uploading a CSV file with a list of static IP subnets (see Upload a List of Subnets with Only Static IP Addresses ), you can add them individually.
- Navigate to the Networks page ( NetworksNetworks and SitesNetworks ) and then click AddAdd a Subnet .
- Define a subnet and then Save .
Type : Select Subnet .
Prefix : Enter the IP address/netmask of the subnet you want to add. Enter the IP address of the subnet in dot-decimal notation and its netmask in CIDR notation (example, 10.1.1.0/24).
Name (optional): Enter a name for the subnet
VLAN ID (optional): Enter the VLAN ID for the subnet.
Description (optional): Enter a description of the VLAN/subnet, such as the type of devices for which it’s intended. These special characters are not allowed in the description field: ~ ` ! # $ % ^ & * + = { } [ ] | \ < > ?
Mark this subnet as static : Select.
It can take several minutes for new entries to appear on the Networks page. You might have to reload the page to see the updated data.
Devices with Overlapping IP Addresses
Add a Subnet with Only Static IP Addresses
|
Where Can I Use This? |
What Do I Need? |
|
|
Overlapping IP addresses, also known as shared IP blocks, occur when an IP CIDR block is reused across different networks. In industries where each site operates independently, such as retail or manufacturing plants, a shared IP block can exist at multiple sites. Other common use cases for overlapping IP addresses include guest networks, or local resources that don't need enterprise-wide access. In these scenarios, devices using shared IP blocks don't communicate with other devices using the same shared IP block.
IoT Security uses network segments to identify when there are overlapping IP addresses because multiple networks are using a shared IP block. A network segment is an association of one or more firewalls that is assigned to a site. Each firewall can only be assigned to one network segment, and each network segment can only be assigned to one site. This helps IoT Security distinguish devices with overlapping IP addresses, based on what firewall and IP address the traffic is coming from.
Because IoT Security relies on a combination of both network segment and IP address block assignments to a site, you must use IP address-based site assignment to support device identification when there are overlapping IP addresses. Deployments that use firewall-based site assignment cannot use network segments.
Using a combination of IP address and network segment, IoT Security identifies distinct devices within overlapping IP blocks that different firewalls observe and creates more accurate IP address-to-MAC address bindings. THis improves the completeness of the asset inventory by accurately representing the unique devices, their attributes, and behaviors within each shared IP block. Additionally, by matching traffic from overlapping IP addresses to the correct devices, IoT Security creates a more accurate behavior baseline for both devices and profiles. In turn, an accurate behavior baseline provides higher confidence in risk assessments and policy recommendations, while reducing false positives due to inaccurate anomaly detections.
To support identification of devices in a network with shared IP block groups, add and manage network segment configurations.
Add a Network Segment
Devices with Overlapping IP Addresses
|
Where Can I Use This? |
What Do I Need? |
|
|
A network segment helps IoT Security identify distinct devices with overlapping IP addresses . To take advantage of network segments, create a network segment and then specify which IP block groups in your network overlap across sites. IoT Security automatically detects most networks based on observed traffic, but you can also manually add networks.
- Create a Network Segment
- Create a Network Shared Block
- Verify the Network Segment Configuration
Only users with an owner or administrator role can create and manage network segment configurations.
Create a Network Segment
- Navigate to NetworksNetworks and SitesNetwork Segments Configuration .
- Add a network segment.
This brings up the Add Network Segment dialog box.
- Enter the network segment configuration details.
- Name : Enter a name for the network segment.
- Optional Description : Enter a brief description for the network segment.
- Firewall : Select the firewalls that you want to assign to the network segment. You can search by a firewall's serial number and name, or use the drop-down selector. The drop-down selector shows if firewalls are assigned to a network segment or not. If you select an already assigned firewall, it will be removed from its existing segment after saving the configuration. A network segment must have at least one firewall assigned to it.
- Optional Assigned to site : Select or create the site that the network segment is assigned to. If you don't choose a site, the network segment is assigned to the default site. You can only assign a network segment to one site.
- Add the network segment.
- Verify that the net network segment appears in the Segments table, with the correct firewalls and site.
Create a Network Shared Block
- Navigate to NetworksNetworks and SitesNetworks .
- Optional If the shared IP block group doesn't appear in the Networks table, add the subnet or IP address block.
- Convert the shared IP block group from a Subnet or Block to a Shared Block.
- In the Networks table, find the Subnet or Block that is reused across multiple sites.
- Click the three vertical dots at the far right of the subnet or block row and select Change to IP Shared Block .
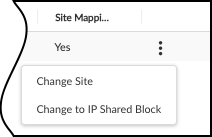
- After the Networks table refreshes, find the IP Prefix that you changed, and verify that the Type is Shared Block.
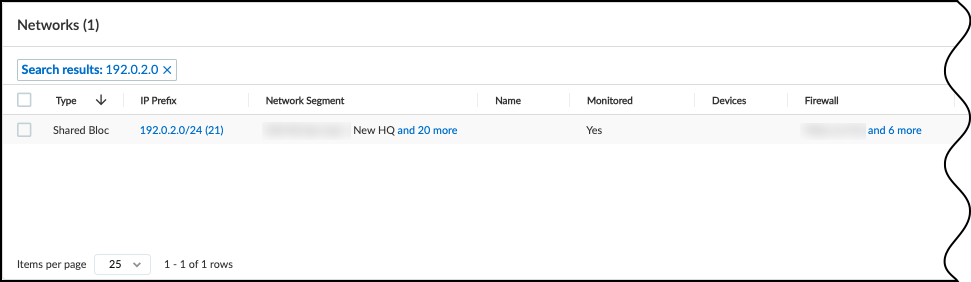
- Verify that the shared block only has segment types, and that there is a segment for all configured network segments.
- Check that the shared block consists of segments.
Click the IP Prefix field for the shared block. This updates the Networks table to show the shared IP prefix. For all the rows, the Type should be Segment.
- Check that the shared block segment information matches your network segment.
Verify that there is a segment row with a Network Segment attribute that matches the name of each of the network segments in the Segments table under NetworksNetworks and SitesNetwork Segments Configuration . The Site attribute should match the site that each network segment is assigned to.

Verify the Network Segment Configuration
- Verify the network segment.
- Navigate to NetworksNetworks and SitesNetwork Segments Configuration .
- Verify that your network segment appears in the Segments table, with the correct firewalls and sites.
- Verify the shared block and the network segment mapping.
- Navigate to NetworksNetworks and SitesNetworks .
- In the Networks table, find the shared block that you configured earlier, and select the IP Prefix field.
- In the updated Networks table for the shared block, verify that there is a row where the Network Segment attribute is the name of the network segment that you created earlier.
- For the same row, verify that the Site attribute is the name of the site that your network segment is assigned to.
- Optional Verify that the shared block and the network segment belong to the correct site.
- Navigate to NetworksNetworks and SitesSites .
- Find the site the network segment belongs to, click the three vertical dots at the far right of the site's row, and select Edit Site .
- In the Edit Site dialog box that appears, verify that the following appears in the respective fields.
- IP Prefix (Optional) : The IP prefix of the shared block that you created.
- Network Segment (Optional) : The name of the network segment that you created.
- Verify that distinct devices and device attributes are assigned correctly in the devices inventory table.
Information in the devices inventory table may take time to populate. IoT Security needs to see enough traffic from the network segments to identify devices and device attributes.
- Navigate to AssetsDevices .
- In the Inventory table, select the Columns icon (three vertical bars) to open the column fields pop-up.
- Select the following column options.
- IP Address under the Basic category.
- Network Segments under the Network category.
- Firewall under the TRAFFIC category.
- Return to the Inventory table and verify that devices with overlapping IP addresses have the correct network segment attribute, and the firewall matches one of the firewalls assigned to the corresponding network segment.
Manage Network Segments
|
Where Can I Use This? |
What Do I Need? |
|
|
In some instances, you may need to update or delete network segments for IoT Security to properly learn about devices with overlapping IP addresses . For example, if you redeploy firewalls or add firewalls to a new site, update your network segments to ensure that the traffic maps to the correct devices.
Whenever you change the firewalls assigned to a network segment, or change the network segment's site assignment, reset the network segment. If you don't reset the network segment, device attributes and behaviors learned from new traffic may be associated with different devices previously learned through the network segment.
When you no longer need a network segment, delete the network segment to ensure that attributes and behaviors get associated with the correct devices.
When you reset or delete a network segment, all devices and attributes learned through the network segment assignment are deleted from the assets inventory. Devices and attributes must be relearned from traffic through the updated network segments.
Follow these procedures to manage network segments:
- Update the Assigned Firewalls
- Update the Site Assignment from Network Segments Configuration
- Update the Site Assignment from Sites
- Delete or Reset Network Segments
Update the Assigned Firewalls
- Navigate to NetworksNetworks and SitesNetwork Segments Configuration .
- Click on the name of the network segment that you want to update to bring up the Edit Network Segment dialog box.
- In the Firewall field, add or remove firewalls.
You can search by a firewall's serial number and name, or use the drop-down selector. The drop-down selector shows if firewalls are assigned to a network segment or not, including the network segment you're editing. If you select a firewall that is assigned to a different network segment, it's removed from its existing network segment after saving the configuration. There must be at least one firewall assigned to the network segment.
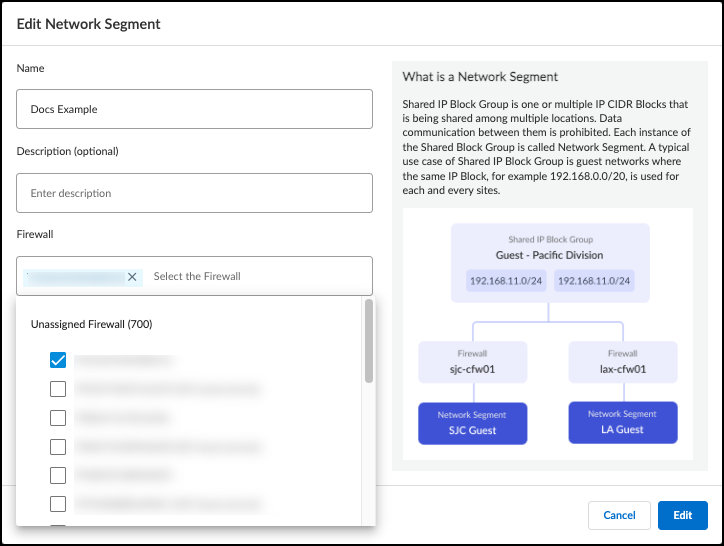
- Select Edit to save your changes and close the dialog box.
- Select the check box next to the updated network segment and Reset the network segment.
- Optional If you moved a firewall from one network segment to another, select the network segment that the firewall was removed from and Reset that network segment.
Update the Site Assignment from Network Segments Configuration
- Navigate to NetworksNetworks and SitesNetwork Segments Configuration .
- Click on the name of the network segment that you want to update to bring up the Edit Network Segment dialog box.
- In the Assigned to Site (optional) field, select or create the new site that you want to assign the network segment to.
Select or creating a new site replaces the existing site assignment in the Assigned to Site (optional) field. A network segment can only be assigned to one site.
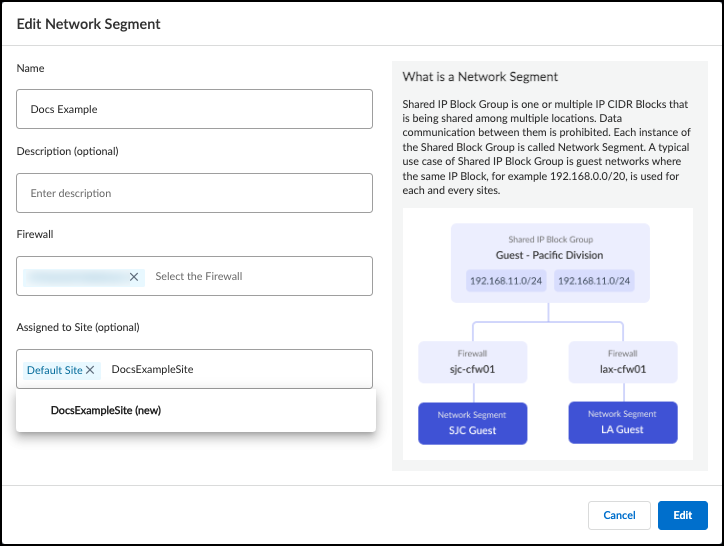
- Select Edit to save your changes and close the dialog box.
- Select the check box next to the updated network segment and Reset the network segment.
Update the Site Assignment from Sites
- Navigate to NetworksNetworks and SitesSites .
- Edit the site.
- In the Sites table, find the site that the network segment belongs to.
- Click the three vertical dots at the far right of the row and select Edit Site to bring up the Edit Site dialog box.
- In the Network Segment (Optional) field, add or remove network segments assigned to the site.
If you remove a network segment from the site, the network segment is reassigned to the default site after saving the configuration.
If you add a network segment, it is removed from its existing site after saving the configuration.
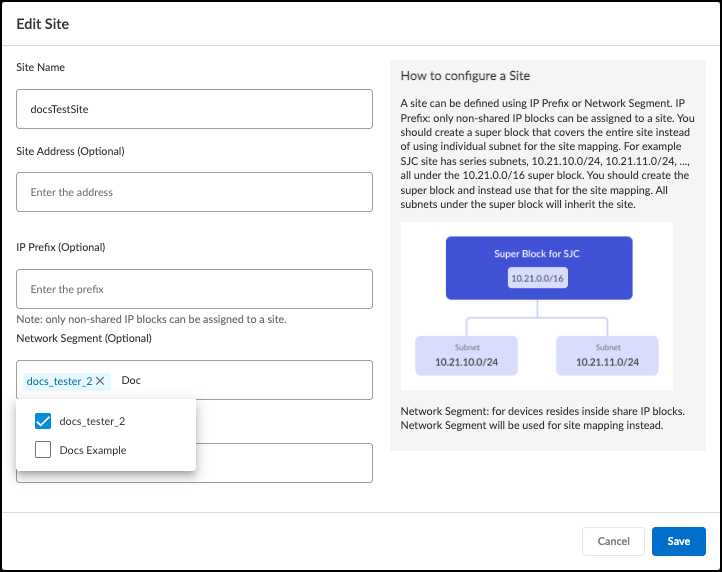
- Save the site configuration.
- Navigate to NetworksNetworks and SitesNetwork Segments Configuration .
- Select the check boxes next to the network segments that were removed from a site or added to a new site and Reset the network segments.
Delete or Reset Network Segments
- Navigate to NetworksNetworks and SitesNetwork Segments Configuration .
- Select the check box next to the network segments that you want to delete or reset.
You need to select at least one network segment to see the Delete and Reset options.
- Delete or Reset the network segments.
IP Endpoints
Parse Industrial OT Device Files
|
Where Can I Use This? |
What Do I Need? |
|
|
When IoT Security receives sufficient network traffic metadata, it uses AI and machine learning to identify the devices generating the traffic. However, there are times when it doesn’t receive enough to identify devices uniquely. For example, IoT Security might be aware that there is traffic to and from a specific IP address but, because the device is in a different Layer 3 domain from the firewall logging the network traffic metadata, it never learns its MAC address. The device might be behind a router, a NAT device, or a wireless tethering device, so the firewall only gets its IP address. If DHCP is providing network settings to network devices, it’s possible that different devices use the same IP address at different times. As a result, the network behavior associated with the IP address will keep changing as different types of device take turns using it. When IoT Security is aware of an IP address that is the source and destination of traffic but it doesn’t know its MAC address and the network behavior isn’t stable enough to deduce that it’s a statically assigned IP address, IoT Security categorizes it as an IP endpoint.
Another way that IoT Security can learn about IP endpoints is through third-party integrations. IoT Security can receive device data by integrating with a network management or asset management solution and by using SNMP to query network switches about the devices connected to them.
If IoT Security observes stable traffic patterns associated with an IP endpoint and there are no changes to any of its major device attributes for seven days, it moves it to the Devices page. There are eight major device attributes that IoT Security watches for changes: device profile, category, vendor, model, OS, hostname, serial number, and site ID. A change to any of these attributes indicates that the device using the IP address has changed, so if they all remain unchanged for seven days, it’s reasonable to assume that the device identity is stable.
After adding the IP endpoint to the Devices page, IoT Security continues tracking its attributes on a daily basis. If there’s a change to any of its device attributes later, IoT Security immediately moves it to the Identified IP Endpoints table where it continues tracking these attributes. You can see a total of all IP endpoints discovered on the network or learned from integrated third-party products and a total and a list of all identified IP endpoints on AssetsDevicesIP Endpoints .
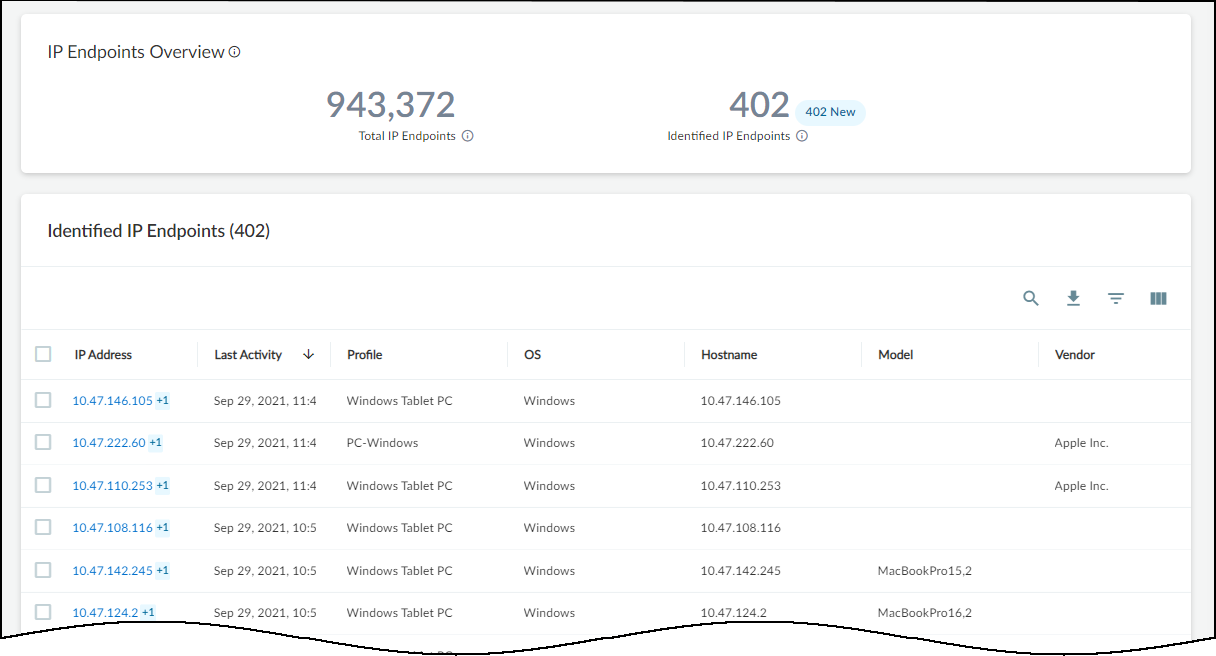
At the top of the page are data filters for sites, device types, and time periods (1 Day, 1 Week, and 1 Month). The sites filter controls the data displayed for IP endpoints and identified IP endpoints per site, per site group, or for all sites. The filter for device types controls the display of data by types such as Industrial, Medical, Office, Traditional IT, All IoT, and All Devices. The time filter displays data that IoT Security discovered or learned within the past day, week, or month.
You might wonder why the device type filter affects the total number of IP endpoints. After all, IoT Security is not yet able to identify what type of device an IP endpoint is. However, for some of them, it already has an approximate idea—enough to distinguish an IT device from an IoT device, for instance. That’s why you might see a different total number of IP endpoints when the filter is, say, All Devices and when it’s All IoT .
To see the history of an identified IP endpoint, click its IP address. For example, the history below shows that IoT Security initially identified this IP endpoint as a Windows PC and then revised that to a Windows tablet. IoT Security maintains a history of up to 10 changes over the past 30 days.
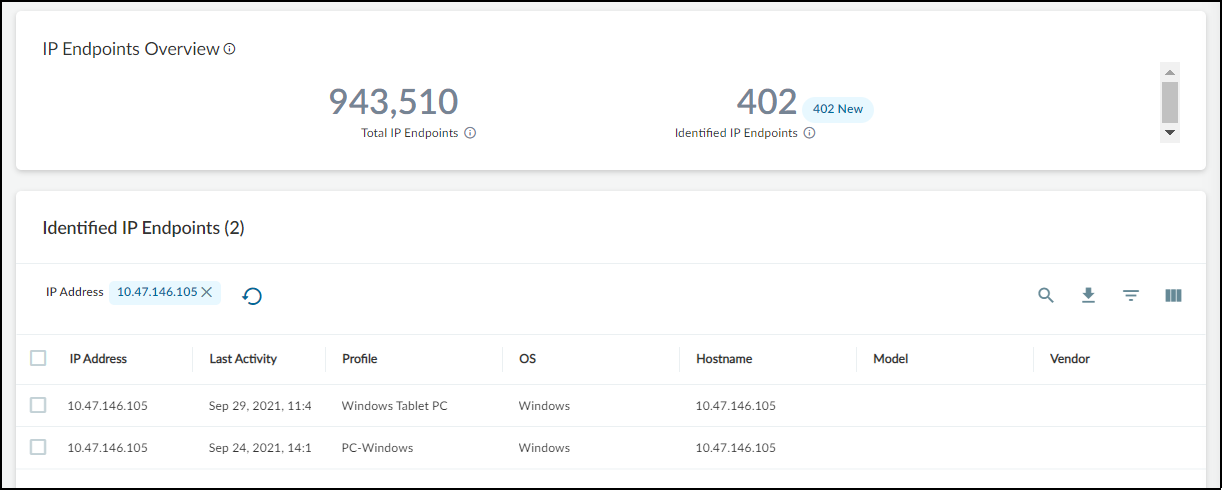
If the behavior of an identified IP endpoint eventually settles to a consistently stable pattern again and there are no further changes to its major device attributes for seven consecutive days, IoT Security moves it back to the Devices page. You can also see the historical record of the last ten changes on its Device Details page.
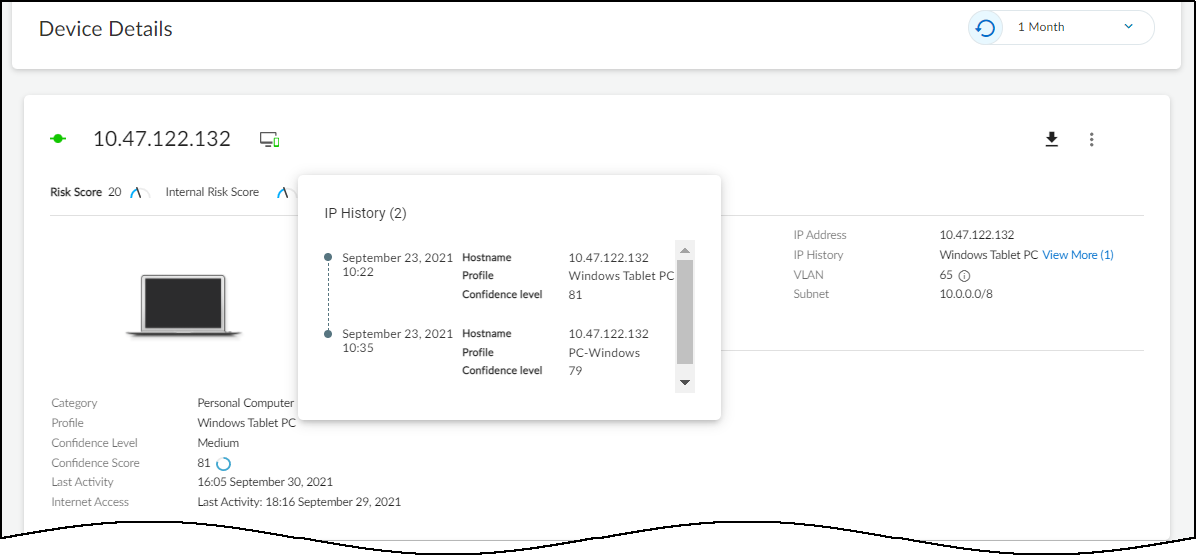
The relationship between the internal database of IP endpoints, the Devices table, and Identified IP Endpoints table is shown below.
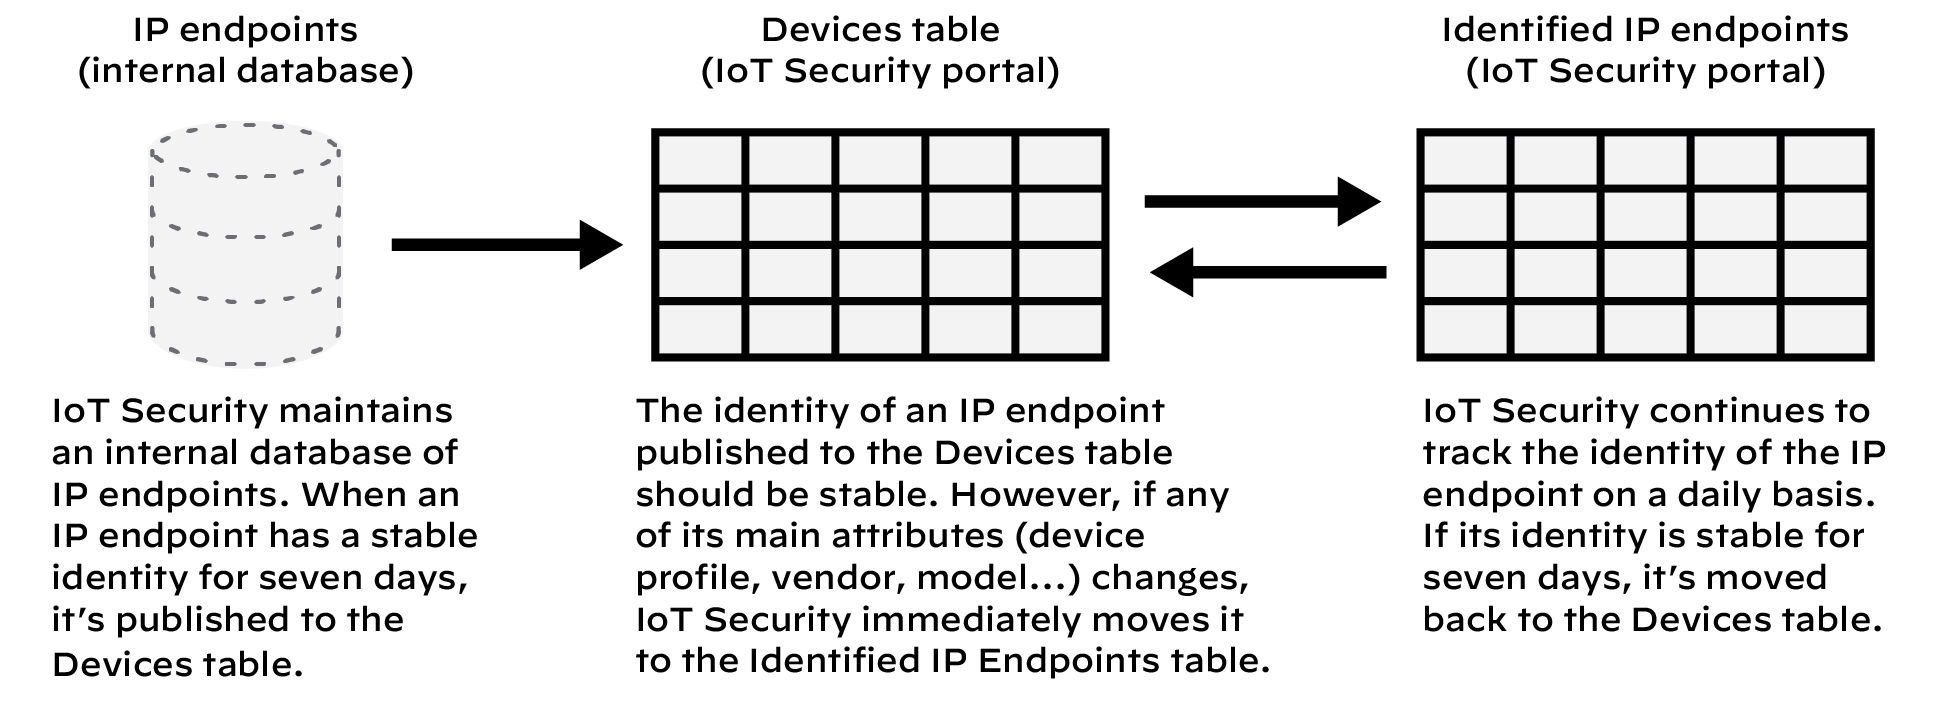
Parse Industrial OT Device Files
Discover Mobile Device Attributes
|
Where Can I Use This? |
What Do I Need? |
|
|
Programmable Logic Controller (PLC) configuration, program, and inventory files, referred to as device files, control and manage machinery and processes for industrial opeartional technology (OT) devices. Because device files define parameters and customize industrial devices to suit operational requirements, they contain detailed asset information. This can include information such as the name, model, vendor, and firmware of devices, as well as information about hardware components and downstream devices. In particular, device files can contain information for industrial OT equipment that operate in isolated network segments. If firewalls don't see traffic from those industrial OT devices, IoT Security can't learn about those assets from passive traffic monitoring.
Use device files along with IoT Security features, such as Network Discovery Polling and third-party integrations , to enrich your asset inventory. To use device files to augment your IoT Security asset inventory, you need to have an Industrial OT subscription. On an Industrial OT IoT Security tenant, view and add devices files at AssetsDevice Files .
On the Device Files page, the Overview section shows a summary of files added, devices learned, and devices enriched from device files in the past 30 days. Below the Overview section, the Parsing History table displays all device files uploaded to your IoT Security tenant. This table includes information such as the parsing history of each file, and how many devices were updated or how many devices were missing critical information, such as MAC and IP address, in each file. You can also download previously uploaded device files from the table.
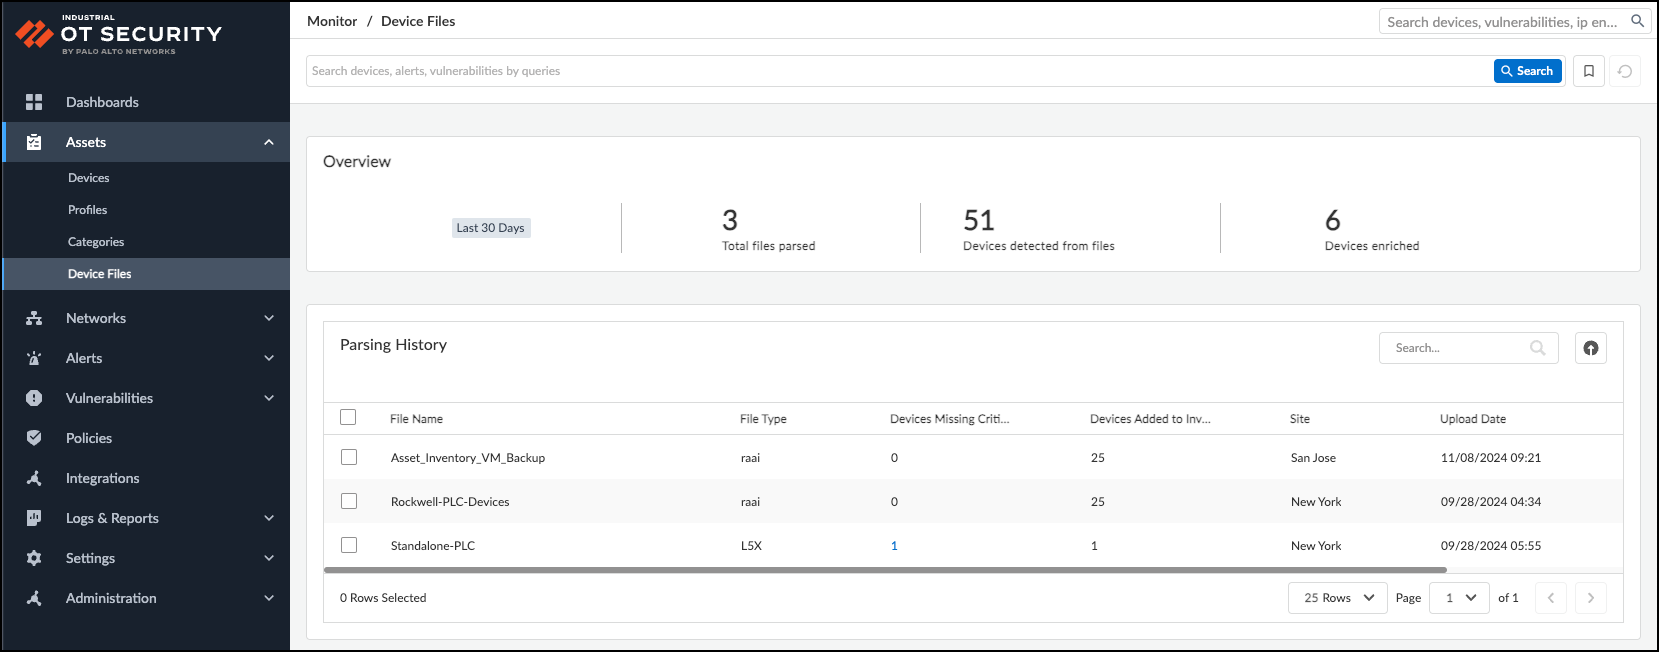
When adding a device file, you need to choose a site association before uploading a file. The site association helps avoid potential conflicts with overlapping IP addresses, and it serves as the site assignment for any new devices learned. You can upload only one file at a time, and each file can't exceed 100 MB in size. IoT Security supports the following device file types for parsing:
- Rockwell AssetCentre (.raai)
- Studio 5000 Logix Designer (.l5x)
- Unity Application Exchange File (.xef)
- Siemens TIA Portal (.zip file containing a Project Library File (.plf) and an Index File (.idx))
Device files parsing only supports Siemens TIA Portal version 17 files.
- Beckhoff TwinCAT (.tnzip file containing a Project Solution File (.sln) and a project file (.tsproj))
Upload Device Files
You can only upload one device file at a time. Verify the parsed content and submit a device file before adding another device file.
- Login in to your Industrial OT Security portal and navigate to AssetsDevice Files .
- In the Parsing History table, click on the Upload icon to open the File Parsing side panel.
- Select the site to associate your device file with.
- Drag and drop your device file into the Select Files box, or Browse your folders and select the device file to upload.
- Review the result of the parsed device file.
After IoT Security parses a file, it displays a table with the parsed output. The table lists the names of all devices discovered from the device file, as well as whether those devices are new or if they match to an existing device in the IoT Security assets inventory.
When a device matches an existing device in IoT Security, you can click on the Device Name field to open up the corresponding Device Details page in a new tab or window. After you submit the device file, the data from the device file will supplement the information on that existing device identity.
If the Parsing Output field says Additional Info Required , then IoT Security can't determine if the device is new or if it matches an existing device. Click on Additional Info Required to add an IP address and a MAC address. A device that has an IP address but no MAC address will be created as a static IP address. If you don't want to add the information right away, you can submit the device file first and update the information from the Parsing History table later.
- After verifying the results of the parsed device file, Submit the file to add the devices and device information to IoT Security.
After submitting the device file, you can view the submitted device file in the Parsing History table.
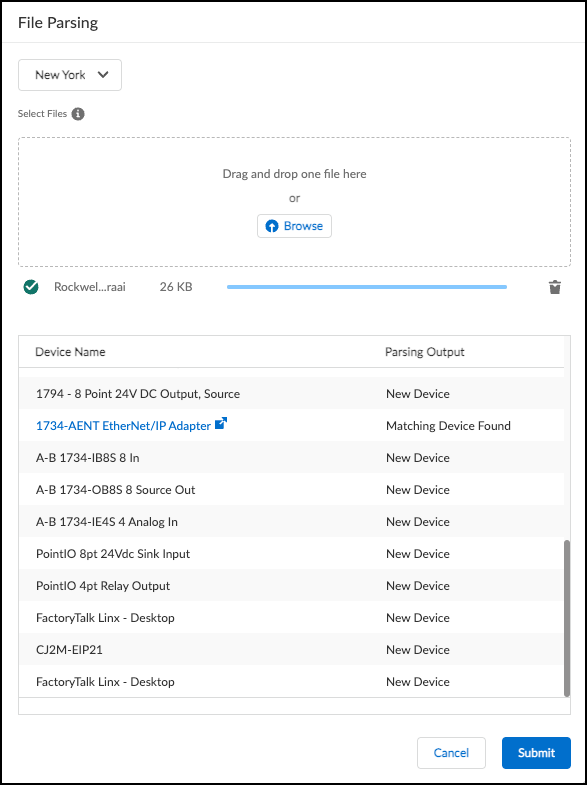
Update Devices Missing Critical Information
When viewing the Parsing History table, some rows may have a value under the field Devices Missing Critical Information. This field indicates the number of devices in that file that are missing an IP address and maybe a MAC address. Update the devices with this information to help IoT Security determine if those devices are new or if they match existing devices in the asset inventory.
- Click on the number in the Devices Missing Critical Information field for a device file.
This brings up the File Parsing Side panel, where you can review the list of devices that are missing an IP address and maybe a MAC address.
- For each device, click Additional Info Required in the Parsing Output field to bring up the Device Attributes pop-up.
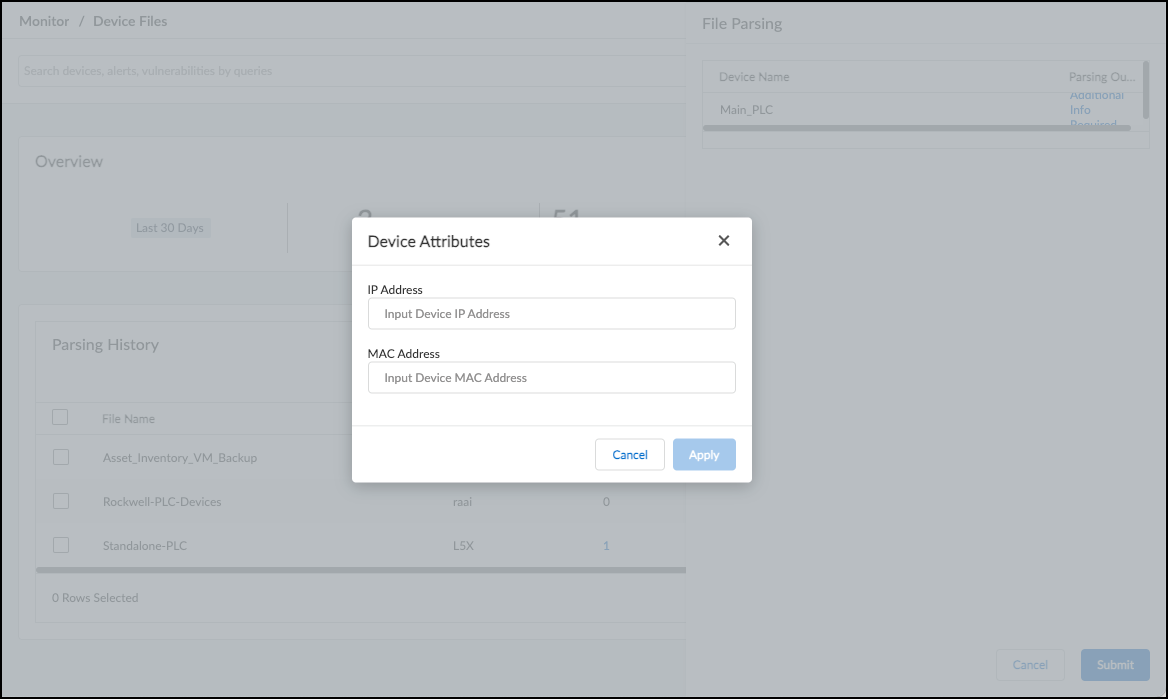
- Enter the IP Address for the device.
- Optional Enter the MAC Address for the device.
Providing a MAC address in addition to the IP address helps IoT Security determine if a device already exists in the asset inventory, and enrich the device data accordingly.
If you don't provide a MAC address, IoT Security adds the device as an IP endpoint rather than as an asset.
- Apply the updates.
- Continue updating all devices that are missing critical information, and then Submit the changes after you're done.
Download Past Device Files
- Navigate to AssetsDevice Files and view the Parsing History table.
- Select the check box next to the device files that you want to download.
- Download the device files.
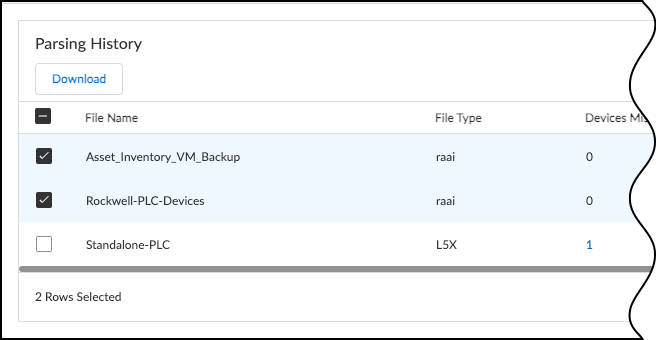
Discover Mobile Device Attributes
Parse Industrial OT Device Files
|
Where Can I Use This? |
What Do I Need? |
|
|
IoT Security can learn mobile (cellular) device attributes, add the devices to its inventory, and track them by the IMEI numbers. You can then see various mobile device attributes for them on the AssetsDevices and Device Details pages. You can also use the mobile device attributes when creating custom alerts. However, because they are classified as Traditional IT, IoT Security doesn’t make policy rule recommendations or send firewalls IP address-to-device mappings for mobile devices.
Set up PAN-OS to Send IoT Security Mobile Device Attributes
This assumes that IoT Security is already onboarded on your firewall, it has the required licenses and certificates , and logging is enabled.
- Enable GTP Security on the firewall.
- Log in to PAN-OS, select DeviceSetupManagement , and then click Edit (the gear icon) for General Settings.
- Select GTP Security and then click OK .
- Commit your changes and then select DeviceOperationsReboot Device .
- Create a Log Forwarding profile that includes GTP logging.
- Log back in and select ObjectsLog ForwardingAdd .
- Enter a name for the log forwarding profile like Mobile Device Logging, select Enable enhanced application logging to Strata Logging Service , and then click OK .
- Create a Mobile Network Protection profile for the types of mobile devices on the network.
The following are the recommended settings that enable the correlation of user IDs and equipment IDs to user equipment IP addresses (UEIP) for different mobile devices. For details about each setting, see the Mobile Network Protection Profile help in PAN-OS.
Expand all
Collapse all
- 5G mobile devices with RADIUS
- 5G mobile devices with Packet Forwarding Control Protocol (PFCP)
- 3G and 4G mobile devices with GTP-C
- Create Security policy rules to log mobile device traffic and forward the logs to the logging service.
Create Security policy rules to log mobile device traffic and forward logs to the logging service for IoT Security to analyze. The rules you create depend on the generation of mobile devices on the network and whether the network uses RADIUS or PFCP.
Expand all
Collapse all
- 5G mobile devices with RADIUS
- 5G mobile devices with PFCP
- 3G and 4G mobile devices with GTP-C
- Commit the configuration
View Mobile Device Attributes in IoT Security
After the firewall begins logging mobile device traffic, it forwards the traffic metadata in GTP logs to the logging service, which in turn streams it to IoT Security. To check the status of the GTP logs, log in to the IoT Security portal and select AdministrationFirewalls . There you can see if IoT Security is receiving GTP logs, the time of the latest log, and how many GTP log events and bytes it’s received.
To see mobile device attributes in the device inventory on the Devices page, select AssetsDevices . Because the Mobile Device columns are hidden by default, click the icon with three vertical bars to open the column selection panel, and select all the columns you want to see. All the columns displaying mobile device attributes are available in the Mobile section:
- Mobile Equipment Identity – The 15-to-17-digit code assigned to every mobile device to uniquely identify it International Mobile Equipment Identity (IMEI)
- Mobile Subscriber Identity – A unique identifier issued on a Subscriber Identity Module (SIM) card. In 2G, 3G, and 4G networks, this identifier is referred to as International Mobile Subscriber Identity (IMSI). In 5G networks, it is called Subscription Permanent Identifier (SUPI).
- Mobile Subscriber ISDN – The Integrated Services Digital Network number is a mapping of a cellular telephone number to a mobile subscriber
- Mobile APN (Access Point Name) – Term used to identify the external Packet Data Network (PDN) to which mobile devices connect through the 2G, 3G, or 4G cellular network. In a 5G network, it refers to the Data Network Name (DNN).
- Radio Access Technology – The underlying connection method mobile devices use for wireless radio communications; for example, Bluetooth, Wi-Fi, UMTS, LTE, or 5G NR
- Mobile Base Station Code – The identification number that uniquely identify a cellular base station
- Mobile Area Code – The area code of the user’s location
- Mobile Network Code (MNC) – A two-digit (European standard) or three-digit (North American standard) number identifying the Public Land Mobile Network (PLMN) of the mobile subscriber
- Mobile Country Code (MCC) – A three-digit number identifying the country of the mobile subscriber
- Mobile TAC (Type Allocation Code) – An eight-digit number that identifies the manufacturer of a mobile device
- Network Slice – The logically discrete section of network operating over a common infrastructure
- Mobile Device – The end user device operating on a wireless network
In addition to showing columns with these attributes in the inventory table, you can also use them in filters and queries at the top of the Devices page. They are displayed on the Device Details page of mobile devices and are available for use when creating custom alert rules .
Network Visualizations
Discover Mobile Device Attributes
|
Where Can I Use This? |
What Do I Need? |
|
|
IoT Security monitors and analyzes network traffic to provide a data-rich, dynamically updated inventory of the devices on your network. Through its extensive monitoring and analysis of network activity, IoT Security can also expose communication patterns among devices of interest by visualizing them in user-defined network visualization maps. By focusing on different groups of devices and different facets of the network, trends, patterns, and aberrations can emerge in the visualization of device communications and in the relationship between devices and the network segments on which they operate or—for Operational Technology (OT) devices—between the OT devices and the Purdue levels to which they’re assigned.
IoT Security provides various methods to group devices for visualization: by device attributes such as subnet, VLAN, vendor, category and profile, and by Purdue level. It also provides the option to create visualization maps with either one or two layers. That is, you first organize devices into groups based on a particular attribute, such as the VLAN they’re in. This results in a set of device groups organized by VLAN, allowing you to see the distribution of devices across the different VLANs in your network. So far, this is a one-layer map. However, if you want, you can also organize the devices within each VLAN by another attribute such as device profile. Then, by drilling down into different VLANs, you can enter a second layer of the map and see the distribution of devices within each VLAN by profile.
Create a Visualization Map
View Data in a Visualization Map
|
Where Can I Use This? |
What Do I Need? |
|
|
- Select NetworksNetwork Visualizations .
Before you create your first network visualization map, the Network Visualizations page displays a map of the world. Any existing sites whose location has been defined appear in those locations on the map. Sites without a defined location appear in an Unknown Sites list in the lower left corner of the map. To define a location for a site, select NetworksNetworks and SitesSites , click N/A in the Location column (or click the three vertical dots icon at the right end of a row and then Edit Site ), enter a city name in Site Address, and then Save .
After you add and save a visualization map, it appears on this page so that you can return to view the map later by clicking View Map .
- Create a network visualization map.
There isn’t a maximum number of visualization maps you can create, but there is a maximum of 500 nodes (subnets, profiles, devices, and so on) that a map can display. If the number of nodes exceeds 500, IoT Security hides the map and presents the information in table format only.
- Select NetworksNetwork Visualizations+ Create Map , select one or more sites, and Add to Scope .
- After you set the site scope, click Next .
- Click Device Grouping to configure the method for grouping devices on the map based on your needs. You can change this later.
The device grouping you select determines the type of map you create. First, group devices by one of the following attributes: Category , Profile , Vendor , Subnet , VLAN ID , or Purdue Level . Then, optionally, depending on the attribute you used, organize them within each first-layer group by another type of attribute in a second layer:
|
First set of groups |
Second set of groups (optional) |
|
Category |
– |
|
Profile |
– |
|
Vendor |
Risk Level |
|
Subnet |
Category or Profile |
|
VLAN ID |
Category or Profile |
|
Purdue Level* |
Category or Profile |
* Before creating a device visualization map based on Purdue levels, you must first indicate the Purdue level to which various devices belong. You can do this by defining custom attribute rules that apply Purdue levels to devices automatically. This involves the following process:
- Make a list of device attributes, such as profiles, for all OT devices at Purdue levels 0-3 on your network. Optionally, make a list of subnets for all other IT and IoT devices that are separate from OT and are in levels 4-5.
- Create six filters on the Devices page, each filter listing a set of profiles or subnets for the devices at a particular Purdue level. For more information about filters, see IoT Security Devices Page .
- Use the six pre-defined values for Purdue Levels 0-5 to create custom attribute rules to assign Purdue Levels to devices based on the filters you created (a default filter is used to assign a Purdue Level to devices based on Category). IoT Security assigns any device that doesn’t match one of these rules to the “Unknown” level.
For example, if you set the first set of groups as Subnet and the second set of groups as Category , you’ll create a map that first shows devices organized into various subnets. Then if you navigate to the second layer of the map by clicking one of the subnets, you’ll see devices grouped by device category within it.
- Continue to refine the map scope by entering more parameters to define the scope of the visualization map and then click Update .
IoT Security displays a visualization based on the scope you define. The scope must include a time range during which devices were active on the network (the past day, week, or month). The scope also typically contains at least one site; however, it’s possible to make a map without specifying any specific site, in which case the map includes all sites. In addition to a time range and sites, you can optionally add numerous filters to narrow the map scope further. Doing so lets you more easily find the types of devices you’re looking for and also reduces the number of nodes that the map displays.
- Review the visualization and, if necessary, continue adjusting the scope and device grouping until the map shows the data you want to see.
- When you’re satisfied with the content of the visualization map, click Build Map , and then enter the following:
Name : Enter a name for the visualization map
Description : Optionally enter a description of the visualization map for later reference.
Scope : Review the filters that define the parameters of the map. Because a map can contain up to 500 nodes, define a scope that stays within this range. You can narrow the scope by filtering devices by type as well as by various device, alert, and vulnerability attributes. This filtering behaves much like the query builder.
Device Grouping : Review the device grouping of the map. You can edit the grouping method here and while viewing a saved map.
- Click Confirm .
The map immediately becomes available to view on the Networks Visualization page.
- Purdue Levels Manually reassign devices individually if necessary.
After setting up the filters and letting the rules automatically assign devices to Purdue levels, periodically do spot checks of important devices to make sure they are assigned to the correct Purdue level on the visualization map. If any device isn't properly assigned, note its IP and MAC address to look it up by device ID in the IoT Security inventory. Then manually reassign it to the right level on its Device Details page.
View Data in a Visualization Map
|
Where Can I Use This? |
What Do I Need? |
|
|
Options for navigating a visualization map and viewing its data apply to both types of visualization methods: device attributes and Purdue levels.
Nodes (Groups and Devices)
The nodes on each level of a map are depicted as circles and the dashed lines between nodes represent network connections. A node can be a group of objects such as subnets, VLAN-IDs, device categories, device profiles, vendors, or risk levels, or a node can be a single device within one of these groups. The number that’s shown within the circle of a group indicates how many devices are in it. Some groups have colored segments around the edge of their circle. These indicate the proportion of devices within it that have a particular risk severity. Critical is red, high is orange, and medium is yellow. A low risk level is the remaining gray that circumscribes the circle. (In other parts of the IoT Security portal, blue represents a low severity level; however, because blue is used to highlight nodes in visualization maps, it’s not used here to indicate a low risk level.) The size of the circle for a group indicates the proportion of devices in it in relation to other groups on the map.
Highlight
The highlight tool, located at the top of a visualization map, helps you find devices with certain characteristics. To use it, enter one or more filters using query language and then click Highlight . IoT Security highlights (with a blue ring or partial ring) all groups and devices that match the filters. The length of the ring denotes the proportion of items in a group matching the highlight definition. You can then drill down to the highlighted devices that match the filters.
Interactions
- Hover : Hover your cursor over a group of devices to see a pop-up panel with information about the groups and devices within it. You can hover your cursor over a group that contains other groups to see information about devices within all the groups or you can hover your cursor over one of the inner groups to see information just about that one. Hovering over a device displays a pop-up panel with information about that device.
- Click once : Clicking a group or device once puts it in focus and displays an information panel about it on the right side of the map. Clicking the External Link icon at the top of the device information panel opens the Device Details page for the device, where you can see relevant information.
- Click twice : Clicking a group twice (double-clicking or clicking on a focused group or device) drills into it to see its contents and the network connections of its contents to other groups. Clicking a device twice shows its network connections to other devices.
- Reposition nodes : You can also drag groups and devices to reposition them on the map. This feature only works on the main map display. When you double-click a particular group, the new group in focus always appears centered on the map.
- Use the table and breadcrumbs : Use links in the table to navigate through map layers by clicking links in table columns to drill down deeper into the map and clicking links in the breadcrumbs above the table to move up to higher layers.
- Use the Back button : In addition to clicking the breadcrumbs above the table to move back to a higher map layer, you can also click the Back button between the IoT Security logo and map name at the top of the page. When you’re already at the top map layer, clicking the Back button exits the current map and returns to the visualizations landing page.
Map Name and Totals
A summary of various totals appears below the map name in the upper left of the page.
For example, the first number might be the number of subnets, the second the number of categories, and the third the number of devices on a map. If the scope contains more than 500 nodes, consider reducing the scope so the map can display them.
After creating a map and engaging with it, you might make some changes and tweaks and decide you want to save the edited map. To do that, click the Edit Map icon next to the map name. IoT Security displays the Update Network Visualization Map panel where you can change the map name, description, the visualization method, and scope and then Confirm your changes. Another option in the Update Network Visualization Map panel is Map Builder. Click Map Builder to view the map and make edits to the visualization method (Device Grouping) and scope. By clicking Update after adding or removing filters to the scope, you can see how your changes affect the contents of the map. When done, click Update Map , which returns you to Update Network Visualization Map. Review your modified settings and, if satisfied, Confirm the changes. If you aren’t yet satisfied, click Map Builder again to return to the map and continue making adjustments as necessary.
Legend
On the left of a visualization map are zoom in (+) and zoom out (-) icons and an information icon that opens a legend of what the colors and icons mean. Click to expand it.
Basic
- When viewing an individual device, its risk level is indicated by the color at 1:00 on the circle.
- When viewing a device group, the risk level or levels of the devices within it are indicated by red, orange, and yellow around the edge of the circle. The amount of each color is the proportion of devices at that risk level in relation to the overall number of devices in the group.
- When using the highlight tool to find devices with a particular attribute, a blue ring—or segment of a ring—appears within the edge of a group, its length indicating the proportion of devices with the highlighted attribute in the group. The longer the blue segment is, the more highlighted devices there are proportionally.
Risk Level
- The color for each risk level is identified.
Icons
- A green globe indicates that one or more devices in a group have connections to normal Internet sites.
- A red globe indicates that one or more devices have connections to malicious Internet sites.
- A three-pronged yellow icon indicates that there are one or more connections to off-map devices; that is, to devices that are on the local network but aren’t within the scope defined for this visualization map.
- A laptop icon indicates that one or more devices have connections to IP endpoints on the local network. An IP endpoint is the source or destination of a network connection for which IoT Security has learned an IP address but not a MAC address.
Map Management
In the Map Management section, you can control what types of devices and connections to display on the map. By selecting and clearing their check boxes, you can toggle the icons on and off on the map.
- Inner Connection : Select or clear the check box to show or hide inner connections, which are connections within the same device grouping. Because connections between groups are typically of more interest, this is toggled off by default. To see inner connections (connections between devices in the same group), toggle on Inner connections .
- Device visualization maps sometimes include IP Endpoints , Off-map Devices , and Internet Connections ( Normal and Malicious ) whenever it’s necessary to show connections between devices defined within the scope of a visualization map and destinations outside that scope. Off-map devices (dark yellow shaded circles) and IP endpoints (gray shaded circles) are located in the local, private network, and Internet addresses are sites in the external public network (green shaded circles for normal sites and red shaded for malicious sites). An IP endpoint is a device for which IoT Security knows an IP address. An out-of-scope device is one for which IoT Security knows both an IP address and a MAC address but is outside the map scope. As with other device groups, you can also drill into groups of out-of-scope devices and endpoints and Internet addresses. Click the group once to put it in focus and open an information panel. Click it twice to zoom into it and view its contents.
Custom Attributes
View Data in a Visualization Map
|
Where Can I Use This? |
What Do I Need? |
|
|
IoT Security provides a large number of attributes for the devices it discovers and learns. A few of these are the device model, vendor, OS, VLAN ID, risk level, and location. For the full list, see the columns for the inventory table on the Devices page. When viewing the devices in your inventory, you can sort and filter by these device attributes, making it easier to find and track those of interest. However, if these attributes don’t accommodate all your needs, you can create custom attributes that better align with the device attributes you use. IoT Security allows up to 50 custom attributes per tenant.
Create a Custom Attribute and Apply It Automatically
You can configure a custom attribute with a conditional statement, so that IoT Security automatically applies a value when a condition is met.
Before you start, make sure you’ve already created and saved one or more data filters on the Devices page ( AssetsDevices ). You will use a filter in the “IF” clause of each IF/THEN statement, indicating the condition that’s required for IoT Security to apply the value in the “THEN” clause to devices.
The automatic assignment of custom attributes through the use of simple IF/THEN statements provides an efficient approach to their application. For example, when devices are managed by different departments in an organization, custom attributes can indicate which department manages which device. To do this, first create a data filter that groups together all the device profiles that a particular department manages. Then create another data filter for all the device profiles that another department manages. Continue as necessary until all the devices are divvied up by profile among the various departments that manage them. Then create a custom attribute with conditional statements that say IF a device matches <filter-1>, then apply <name of department-1> to it; IF another device matches <filter-2>, then apply <name of department-2> to it; and so on. After you're done, you can then sort the devices in your inventory on the Devices page by the departments that manage them.
- (Optional) Create a filter to use in the attribute.
If you don’t already have a filter to use in the custom attribute, log in to the IoT Security portal and select Devices . Define a data filter at the top of the page and then save it.
- Create a custom attribute that IoT Security will apply to devices automatically.
- Select SettingsCustom Attributes+ (Create Custom Attribute).
- Enter the following in the Create Custom Attribute pop-up panel that appears:
Attribute Name : Enter a name for the custom attribute. It cannot contain special characters and it cannot be longer than 50 characters.
Default Value (Optional) : Enter a value for IoT Security to apply by default to all the devices in your inventory. If you don’t include a default value, IoT Security will enter N/A in the field for this attribute.
Value Automation (Optional) : Add an IF/THEN conditional statement to determine when a value is applied to the device attribute. Choose a previously defined filter for the IF a device matches this filter field and then enter a value in the THEN apply this value to the attribute field. You can add more IF/THEN statements (up to five). The logical relationship between them is “or” and their order is important because IoT Security checks the conditions from the top down and will apply the value of the first match it finds.
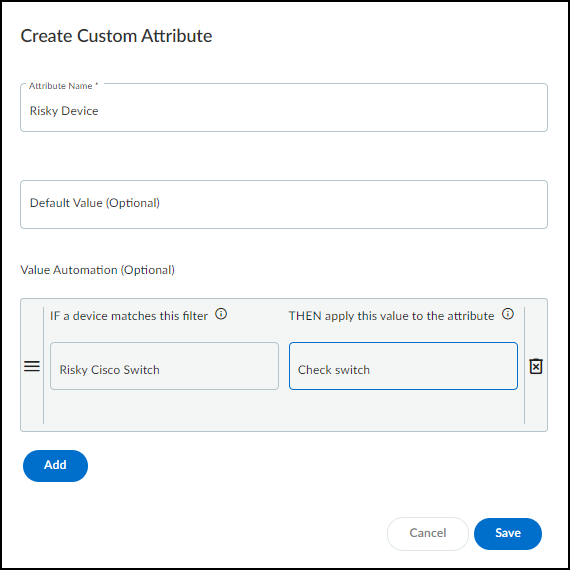
- Save the custom attribute configuration.
IoT Security searches through its inventory for any devices that match the condition—or one of several possible conditions—in the Value Automation section and then applies the prescribed value. This search can take several minutes to complete. Going forward, IoT Security applies the value to any device whose condition matches that in the attribute configuration.
Manually Apply Custom Attribute Values to a Device
In addition to creating custom attributes that IoT Security automatically applies to devices based on specified conditions, you can create custom attributes and manually apply values to them per device yourself.
- Create a custom attribute whose value you will manually apply to devices.
- Log in to the IoT Security portal and select SettingsCustom Attributes+ (Create Custom Attribute).
- Enter the following in the Create Custom Attribute pop-up panel that appears:
Attribute Name : Enter a name for the custom attribute. It cannot contain special characters and it cannot be longer than 50 characters.
Default Value (Optional) : Enter a value for IoT Security to apply by default to all the devices in your inventory. If you don’t include a default value, IoT Security will enter N/A in the field for this attribute.
Value Automation (Optional) : Do not configure this section.
- Save the custom attribute configuration.
- Apply the custom attribute to a device.
- Select AssetsDevices and use the search, filter, and sort tools to display the devices in the inventory to which you want to apply the attribute you just created.
- Click the device name, which opens the Device Details page.
- Click Edit next to Custom Attributes.
- Remove any you don’t want to apply to the device and edit or add any you do.
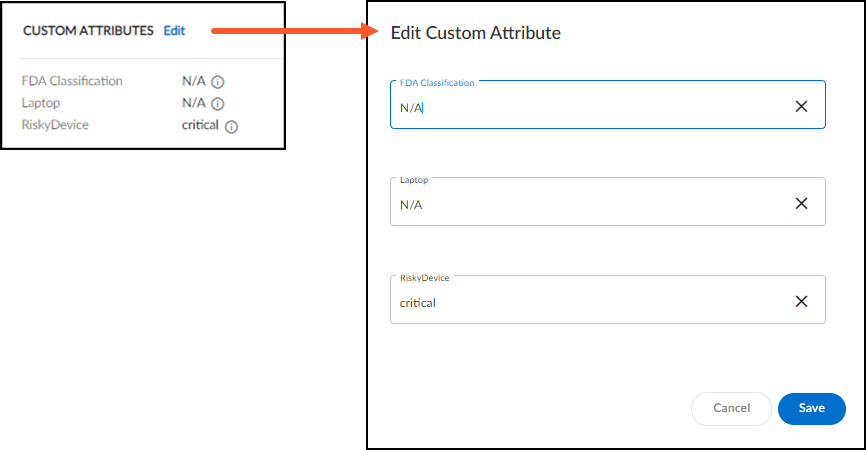
- Save your configuration changes.
View Devices by Custom Attribute
After applying custom attributes to devices, you can then show custom attribute columns on the Devices page. Click the column icon (
![]()
) and select one or more custom attributes whose columns you want to display on the page.
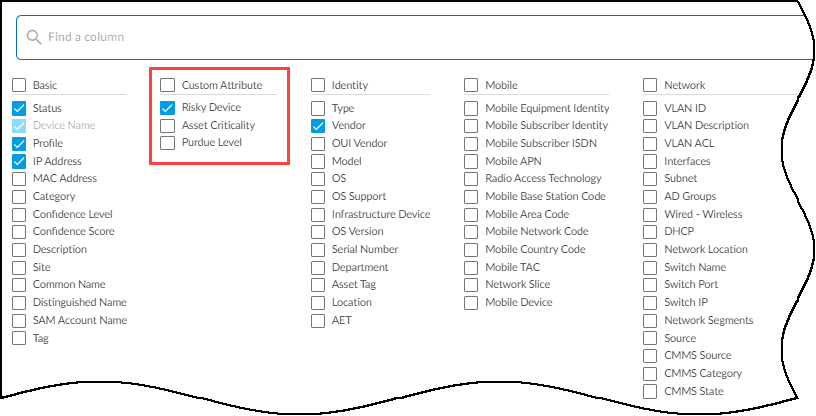
The selected columns appear in the inventory section of the Devices page.
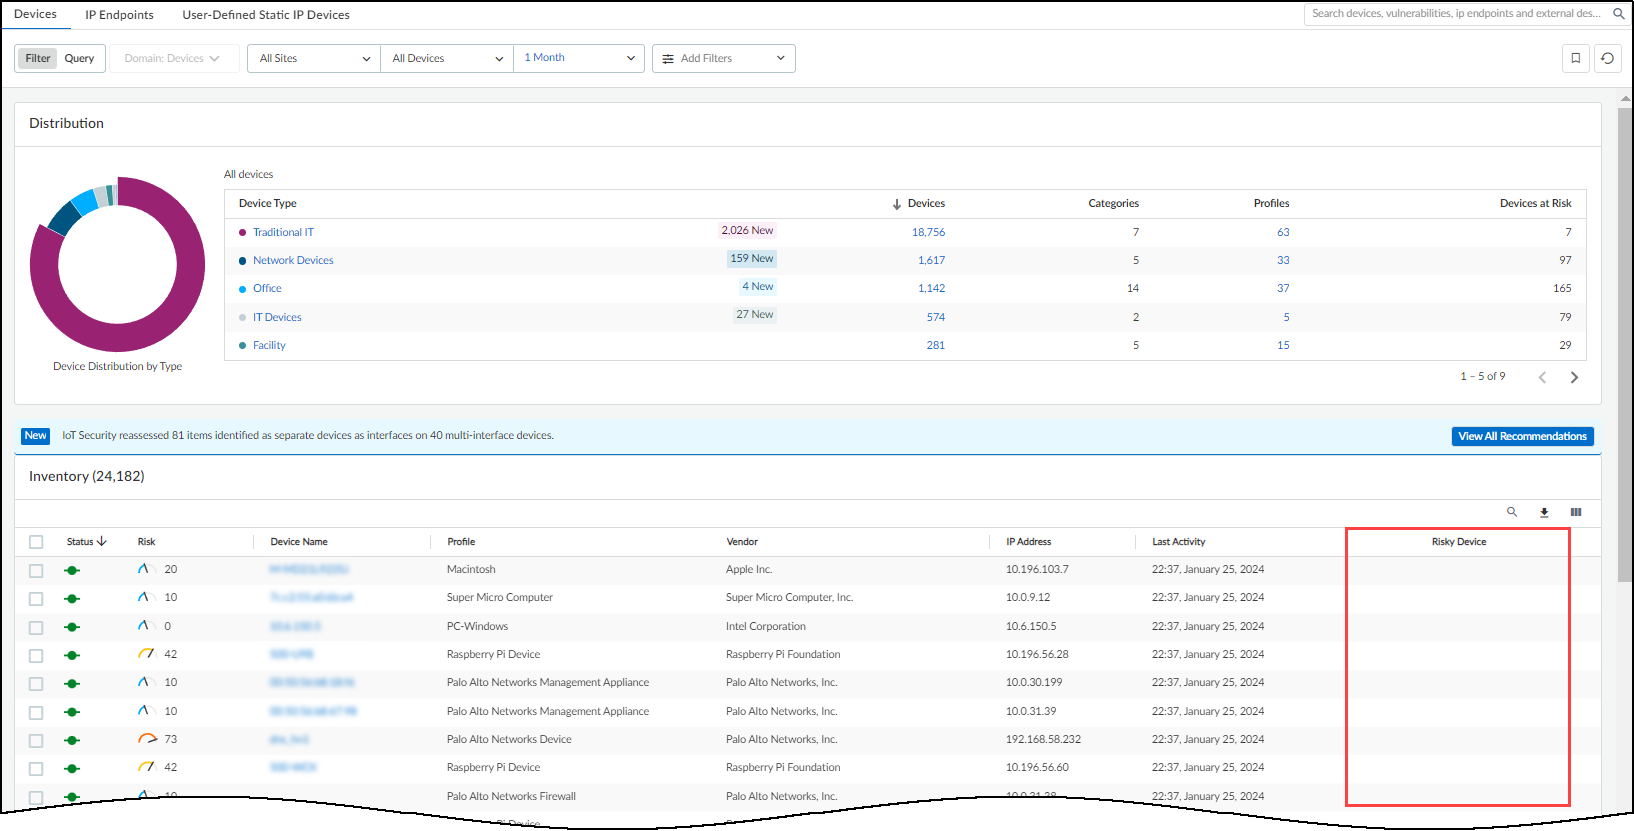
To hide the column, click the column icon again and clear the check boxes for custom attributes you no longer want to see.
Edit Custom Attributes and Delete Them from Devices
To edit or delete a custom attribute, select SettingsCustom Attributes , click the three vertical dots at the far right of the a custom attribute, and then click either Delete or Edit .
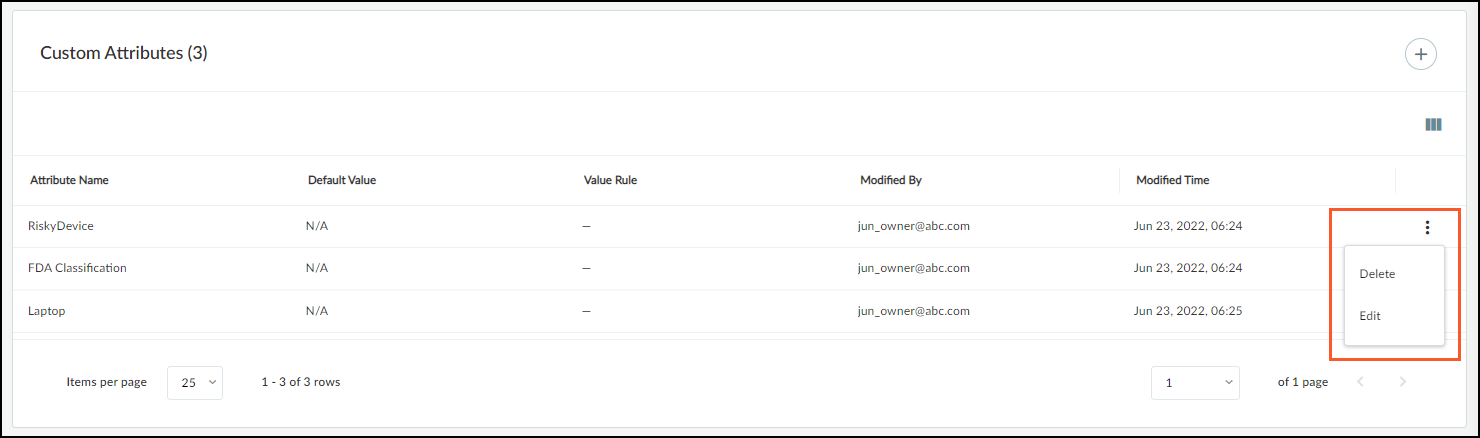
Tag Management
Discover IoT Device Applications
|
Where Can I Use This? |
What Do I Need? |
|
|
The SettingsTag Management page contains a list of all tags that you can apply to the devices in your inventory. There are two tabs on this page: System Tags with predefined system tags and Custom Tags with user-defined custom tags.
You can create your own custom tags and use them to add meaningful labels to your devices. IoT Security creates system-defined tags based on the types of devices detected in your environment. If manufacturing devices are found, for example, then it creates system tags for Purdue levels 1 through 5.
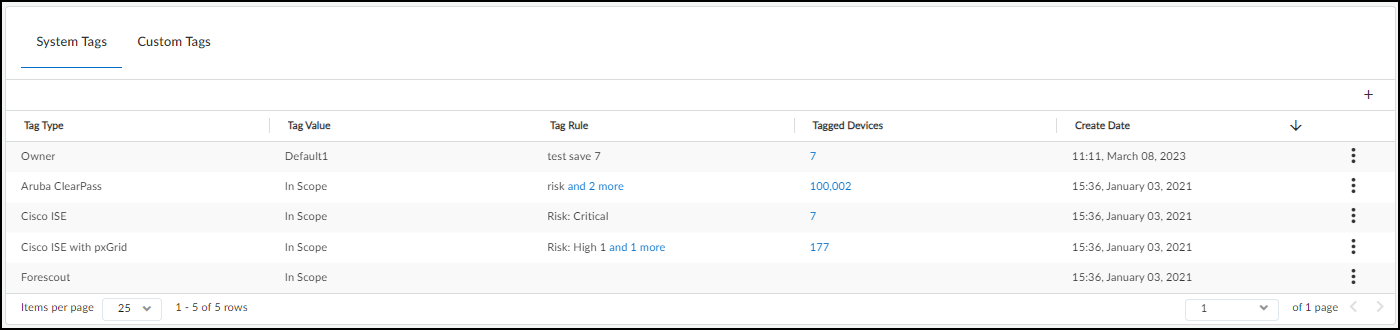
Follow these procedures to manage device tags:
- Create a Custom Tag and Apply It Automatically
- Manually Apply Tags to One or More Devices
- Manually Apply Tags to an Individual Device
- Remove Manually Added Tags from Devices
Create a Custom Tag and Apply It Automatically
- Define a tag.
To create a custom tag, click the + icon in the upper right corner of the Custom Tags tab.
The Create custom tag window opens with fields for a tag type and a tag value. The type is optional and the value is required.
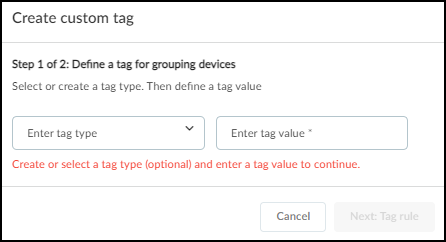
Optionally select or create a tag type, define a tag value, and then click Next: Tag Rule .
- Optionally define a tag rule to apply the tag automatically.
A tag rule defines a condition for applying a tag. When a device matches the filter or filters in a tag rule, IoT Security automatically applies the specified tag. IoT Security not only does this when you initially define a tag rule but it also applies the tag if it later finds new matching devices in the future. Conversely, if a device no longer match the filter, IoT Security automatically removes the tag from it.
If you want to apply the tag when a device matches a filter, choose a previously saved filter from the list. You can also add one or more filters to apply the tag to more devices. If there are multiple filters, IoT Security applies a tag to a device if it matches any one of them.
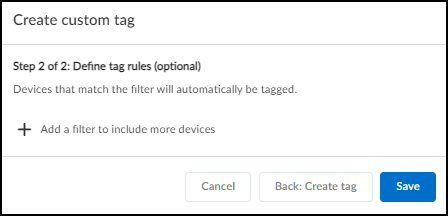
If you want to apply the tag manually to one or more devices on the Devices page or individually on the Device Details page instead of automatically through a tag rule, don’t select or add any filters.
When done, Save the tag.
You can create a maximum of 1000 unique tags and manually apply them to a maximum of 100,000 devices. A single device can have a maximum of 100 tags applied to it.
Manually Apply Tags to One or More Devices
There are two ways to apply tags to devices:
- Manually apply tags to one or more devices on the Devices page or to an individual device on the Device Details page
- Automatically apply tags through the use of special filters called tag rules on the SettingsTag Management page
The quickest way to tag your devices is to do so manually through the device inventory on the Devices page.
- Filter the devices to tag.
Open the AssetsDevices page and use the filter tool to refine the devices in the list.
After the correct devices are listed, click the Tag icon (
![]()
) to tag the filtered devices. In fact, you’re not only tagging this set of filtered devices but you’re tagging the filter itself. If IoT Security detects devices matching this filter in the future, it will tag them as well.
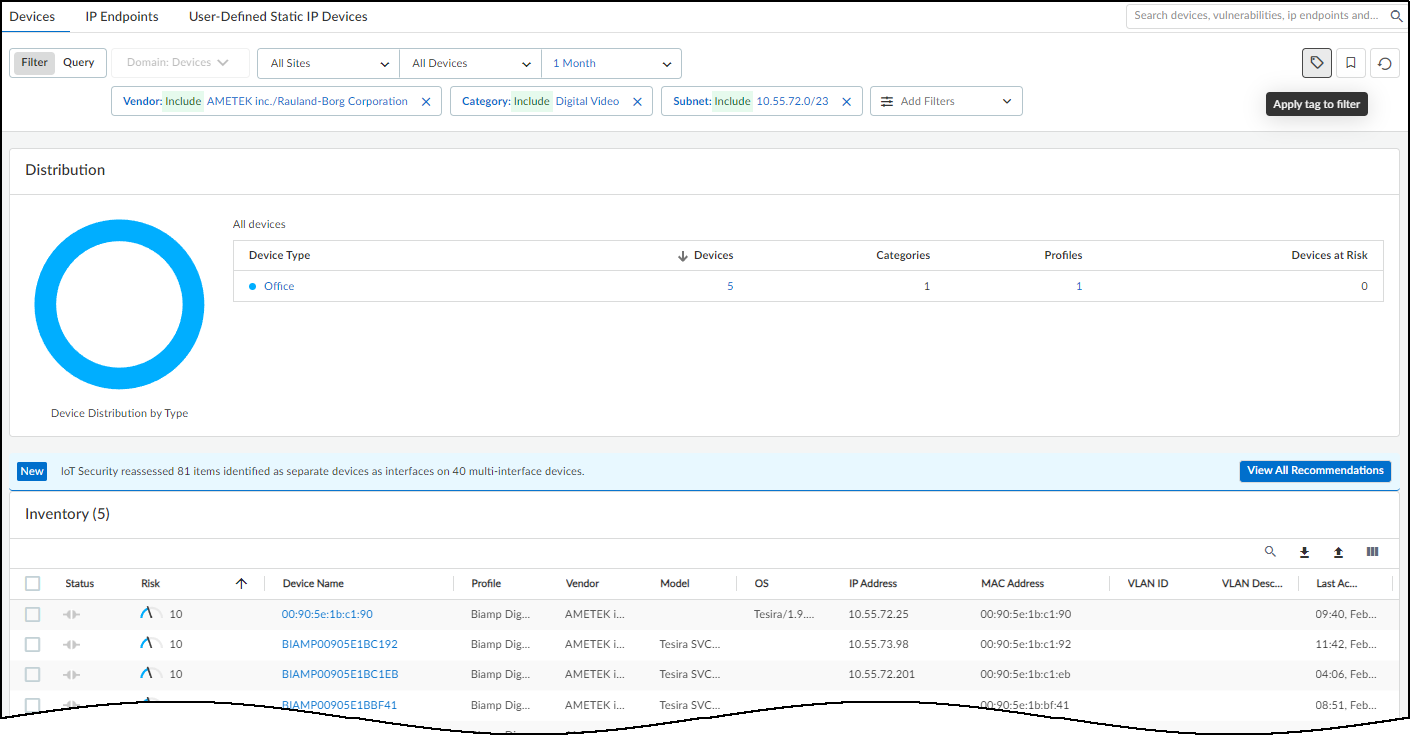
- Confirm the filtering parameters before applying tags.
Check that the filters are the ones you want to use. If not, Cancel and modify the filters before tagging the devices.
To include the global filters for site and device type at the top of the Devices page, select Include global filters for site and device type in this filter . Clear the check box to exclude the site and device type global filters.
When done, click Next: Select tag .
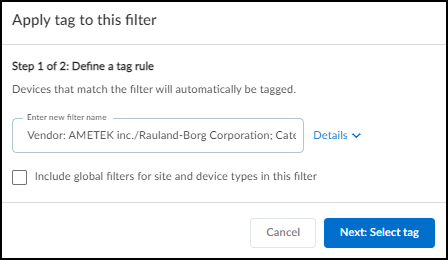
- Select one or more tags and apply them.
The Apply tags to this filter window opens with fields for a tag type and a tag value. The type is optional and the value is required.
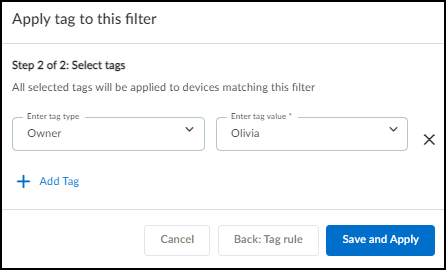
Optionally select or create a tag type, and select or create a tag value.
To apply more than one tag, click + Add Tag .
When done, Save and Apply .
IoT Security tags the filtered devices, and if it detects new devices that match your filters in the future, it will automatically tag them as well. Likewise, if any tagged devices no longer match filters, IoT Security will automatically remove tags from them.
The initial tagging process can take a few moments to complete, depending on how many devices IoT Security must tag.
Manually Apply Tags to an Individual Device
In addition to tagging devices on the Devices page, you can tag an individual device from its Device Details page.
- Open the Manage Tags window for an individual device.
From the Devices page, click a device name to open the Device Details page for this device.
Click the Action menu icon (
![]()
) in the upper right of the page and then click Manage Tags .
- Apply one or more tags to the device.
Optionally select or create a tag type and select or create a tag value.
To apply additional tags, click + Add Tag . You can apply a maximum of 100 tags to a single device.
When done, Save .
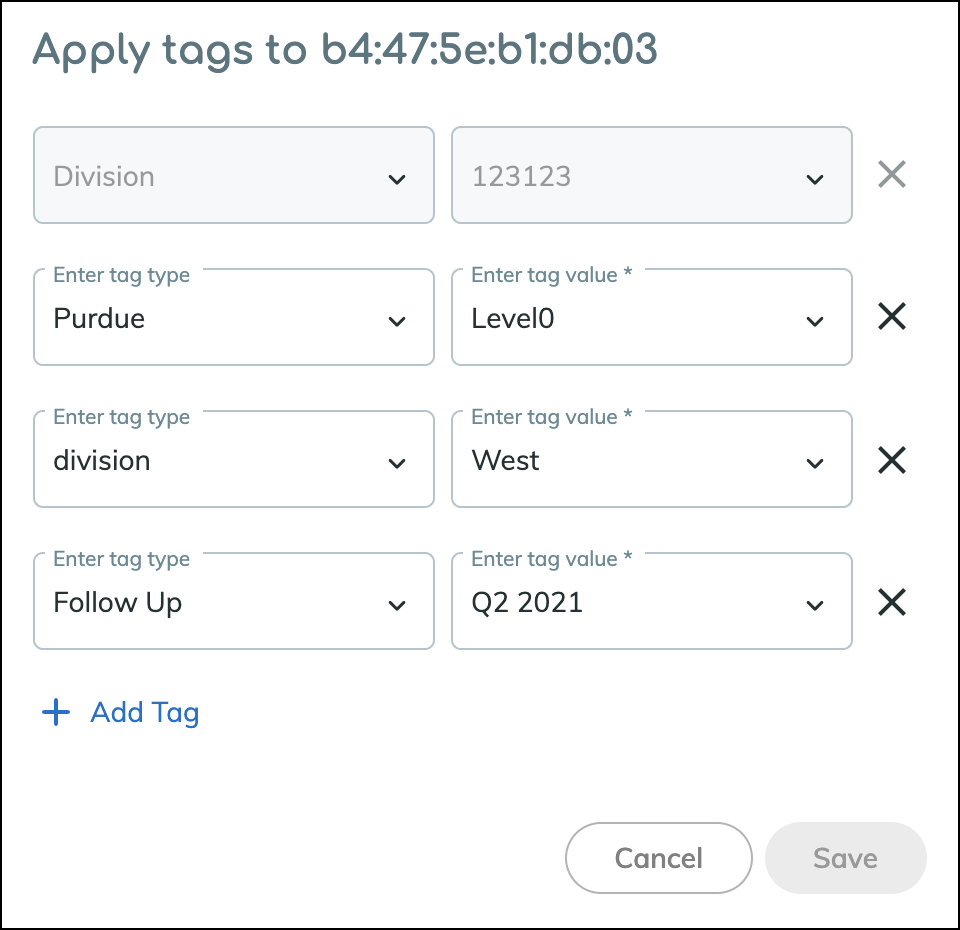
Remove Manually Added Tags from Devices
It's possible to remove tags from individual devices. You can only remove manually applied tags from an individual device because IoT Security would reassign any removed tags that are automatically assigned as a result of tag rules. To remove automatically assigned tags, you must remove them completely from the system.
To remove a manually applied tag from an individual device:
- Navigate to the Device Details page.
- Click the Action menu icon (
![]()
) and then click Manage Tags .
- Click the X next to a tag entry to remove it and then Save .
Remove a Tag from the IoT Security System
To remove a tag from the entire IoT Security system:
- Select SettingsTag Management .
- Click the Action menu icon (
![]()
) in the far right column and then click Delete Tag .
When you delete a tag on the Tag Management page, IoT Security removes it from all devices. This operation cannot be undone, so remove tags with caution.
Discover IoT Device Applications
IoT Device Vulnerability Detection
|
Where Can I Use This? |
What Do I Need? |
|
|
Knowing which applications your network-connected IoT devices use and how many devices use them can prove useful, especially when defending against a potential threat. For example, if you know a widely used application was recently compromised, you can check which devices use it and respond in proportion to how critical the application is. If it’s non-essential for business, you can create policy recommendations for firewalls to block that application. If it is essential and there is a new version, you can assign operations the task to upgrade all devices that use it. And if it is essential and there isn’t a new version yet, segment all devices that use it and restrict access to them only to people and resources that are necessary for them to function. Having visibility into the applications on your network allows you to take swift action to safeguard your assets when danger threatens.
On the NetworksApplications page, IoT Security displays all the applications that have been spotted in use by the IoT devices on your network.
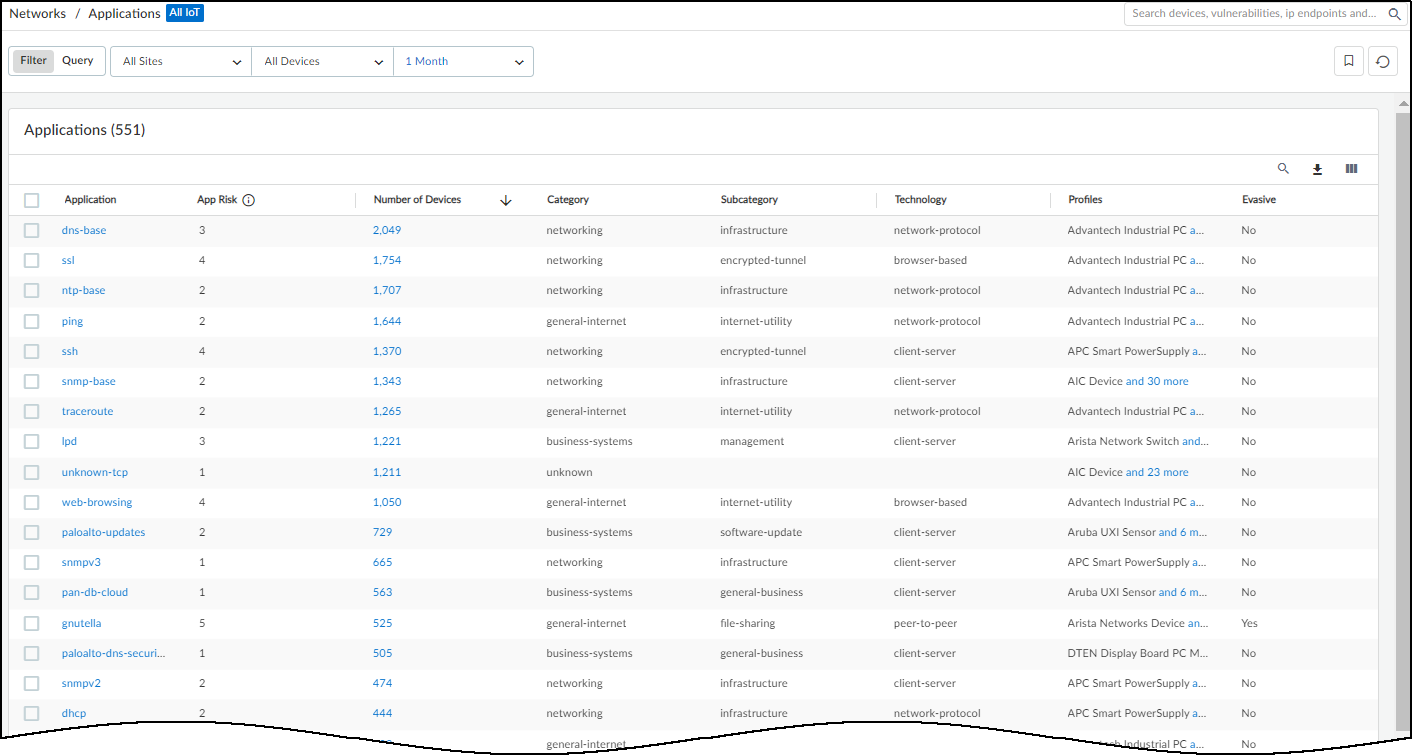
The Applications page shows the total number of unique applications detected for IoT devices matching the site and time-range filters set at the top of the page.
The IoT Security portal disregards the device-type filter on this page and always shows applications for "All IoT" devices, as indicated by the blue icon at the top of the page.
Although IoT Security displays devices and networks as soon as it discovers and identifies them, it collects data about detected applications over the course of a day and then compiles a list. It then displays that list on the Applications page until it compiles the next daily list of applications detected on the network. When you start using IoT Security, you might notice that it begins showing data on the Devices and Networks page before showing anything on the Applications page. This can happen because IoT Security hasn't generated a list of applications yet. After it does, it will continue doing that every day thereafter.
If you set the time-range filter for 1 Day , 1 Week , or 1 Month , the Applications page shows numbers for the time range you set. However, because IoT Security organizes the applications it detects into daily lists, the time-range filter for 1 Hour shows the same set of unique applications as 1 Day , which is the smallest list of applications you can see. In addition, IoT Security doesn’t maintain application details for more than a month. Therefore, the time-range filter for 1 Year shows the same set of unique applications as 1 Month , which is the largest list of applications you can see.
IoT Security provides data from Applipedia about each of the applications it monitors. When a new application appears, you can use this data to determine if it's expected or not and also to see the level of risk it introduces to your network. For example, the following shows the application description, characteristics, and security information that IoT Security retrieves from Applipedia for DNS:
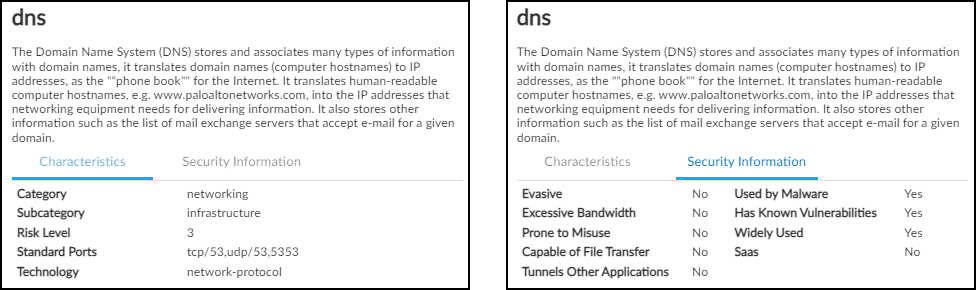
Here's the same information about DNS presented in Applipedia:
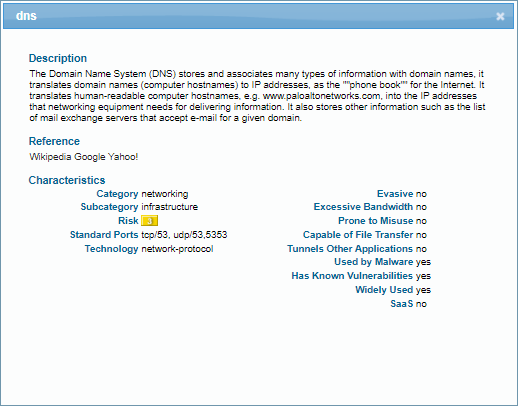
The following summarizes the different characteristics and types of security information that IoT Security retrieves from Applipedia and displays for each application.
|
Application Characteristics |
|
|
Category |
A broad application type to which an individual application belongs |
|
Subcategory |
A more specific application type for an individual application |
|
Risk Level |
The level of risk that’s inherent in an application as determined by the characteristics listed in the next table, on a scale of increasing risk from 1 to 5 |
|
Standard Ports |
The protocol and standard service port numbers that the application uses |
|
Technology |
How an application functions: network-protocol, client-server, peer-to-peer, or browser-based |
|
Application Security Information |
|
|
Evasive |
Yes = The application uses a port or protocol for something other than its originally intended purpose with the intention of evading firewall policy enforcement. |
|
Excessive Bandwidth |
Yes = The application consumes at least 1 Mbps on a regular basis through normal use. |
|
Prone to Misuse |
Yes = The application is often used for nefarious purposes or is easily set up to expose more than the user intended. |
|
Capable of File Transfer |
Yes = The application has the capability to transfer a file from one system to another over a network. |
|
Tunnels Other Applications |
Yes = The application can transport other applications inside its protocol. |
|
Used by Malware |
Yes = Malware has been known to use the application for propagation, attack, or data theft, or the application has been distributed with malware. |
|
Has Known Vulnerabilities |
Yes = The application has at least one publicly reported vulnerability. (Web-based applications are always set to Yes because HTTP always has vulnerabilities.) |
|
Widely Used |
Yes = The application likely has more than 1,000,000 users. |
|
SaaS |
Yes = The application is cloud based and provided through Software as a Service (SaaS). No = The application is hosted on premises. |
Many of these explanations come from the KB article "How to Determine Risk Level of Application, Spyware, and Anti-Virus" . There you can read more about the information that Applipedia provides and how risk scores are calculated.
To see data from Applipedia about applications on the Applications page, either click or hover your cursor over an application name to view a pop-up with information about the application taken directly from Applipedia.
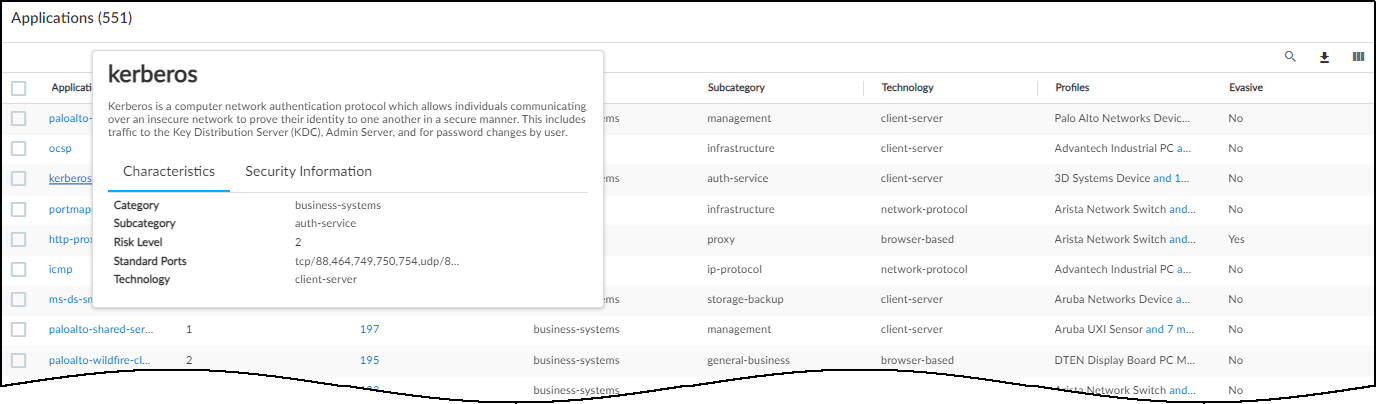
In addition, use the column picker to show information from Applipedia in columns on the Applications page.
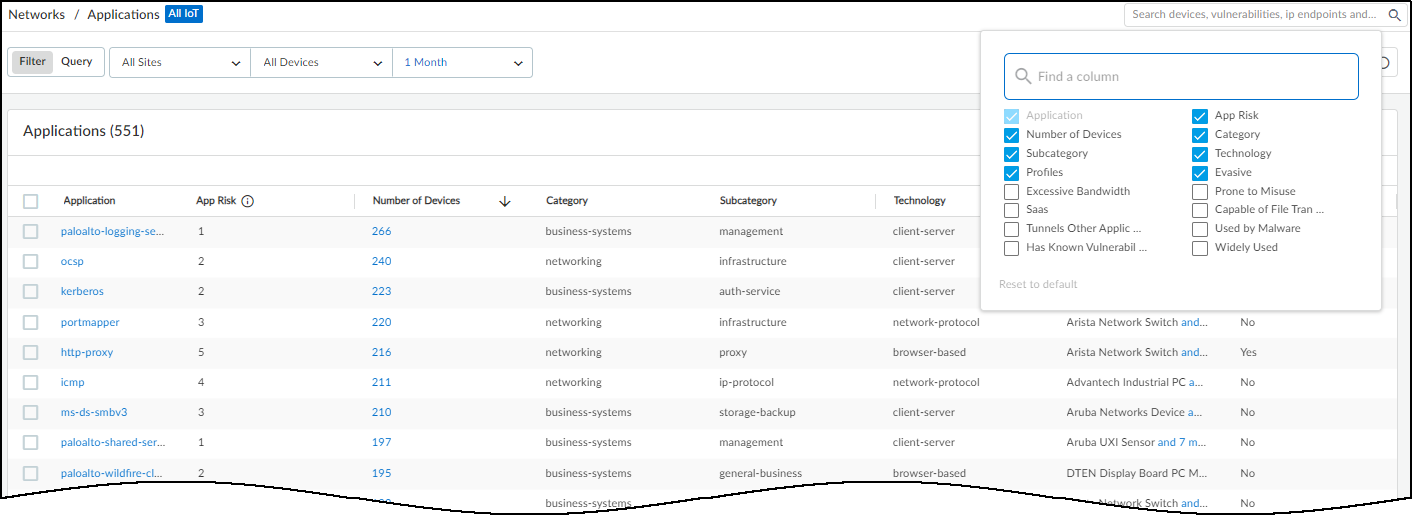
Click a number in the Number of Devices column to open the Devices page with a filter applied to show only devices that use the corresponding application.
Clicking or hovering your cursor over the blue text of an entry in the Profiles column displays a list of all profiles that use that application.
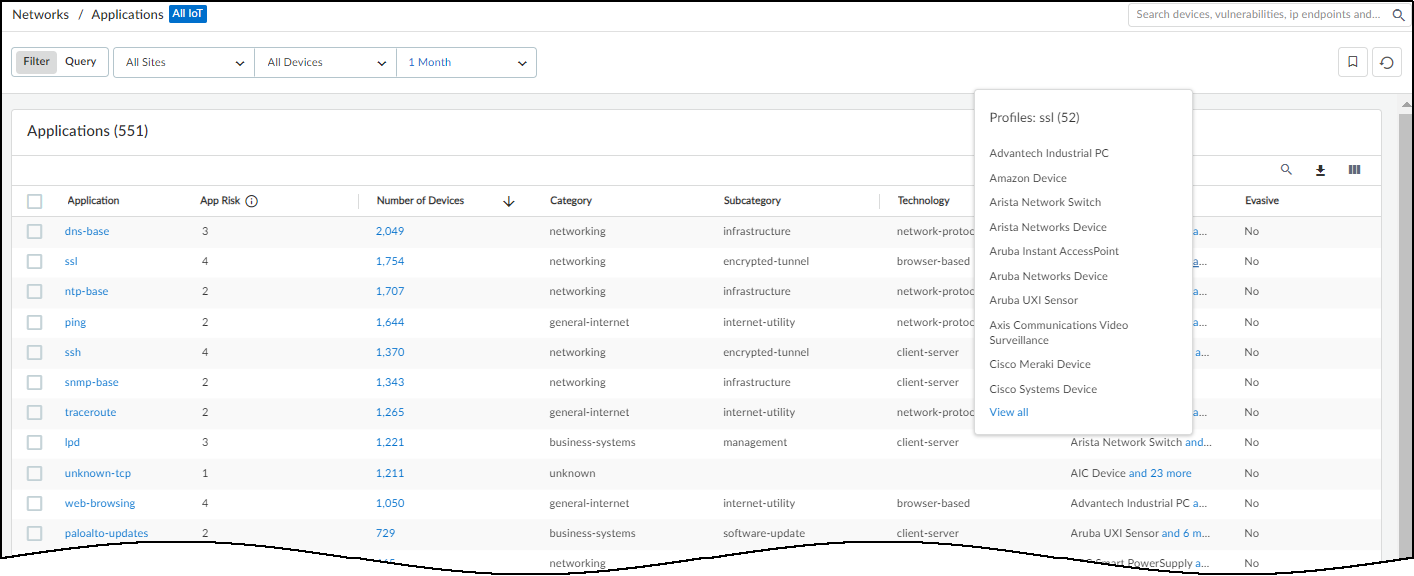
IoT Device Vulnerability Detection
Discover IoT Device Applications
Vulnerability Overview Dashboard
|
Where Can I Use This? |
What Do I Need? |
|
|
A vulnerability refers to an intrinsic flaw built into the software or hardware of a device that is often well-known and can be exploited in some way. A risk, on the other hand, considers environmental, configuration, behavioral, and security policy-related factors in addition to one or more underlying vulnerabilities. This distinction is important because some risks appear in the device details page but not on the Vulnerabilities page, and yet they can influence the severity level that IoT Security assigns to a vulnerability.
IoT Security considers a vulnerability to be potential when it applies to a specific device type, model, and version number and one or more devices match the specified device type but their model and/or version number are unknown. Similarly, a device is considered to be potentially vulnerable for the same reason.
A vulnerability can also be considered potential if it only applies to devices with certain serial numbers and there are devices whose serial numbers are unknown but match the vulnerability description in all other regards.
IoT Security detects vulnerabilities for IoT devices only. It does not provide vulnerability detection, alerts, policy recommendations, and network behavior analysis for IT devices. For IT devices, IoT Security provides device identification only.
Vulnerability Overview Dashboard
IoT Device Vulnerability Detection
|
Where Can I Use This? |
What Do I Need? |
|
|
The Vulnerability Overview dashboard ( VulnerabilitiesVulnerability Overview ) lets you customize how information about vulnerabilities and vulnerability instances is presented so you can view their impact on your devices from different perspectives. By setting filters, you determine the scope of the information displayed, and by defining queries and settings, you control the types of vulnerabilities and the types of devices you want to see.
The filters you set at the top of the page do not affect the Vulnerabilities of Interest section. The vulnerabilities displayed there are determined by the settings you configure within that section itself.
The dashboard consists of four main sections to help you easily see key statistics, identify top vulnerabilities of interest, gain insights into their distribution among different groups of devices, and track vulnerability instances trends.
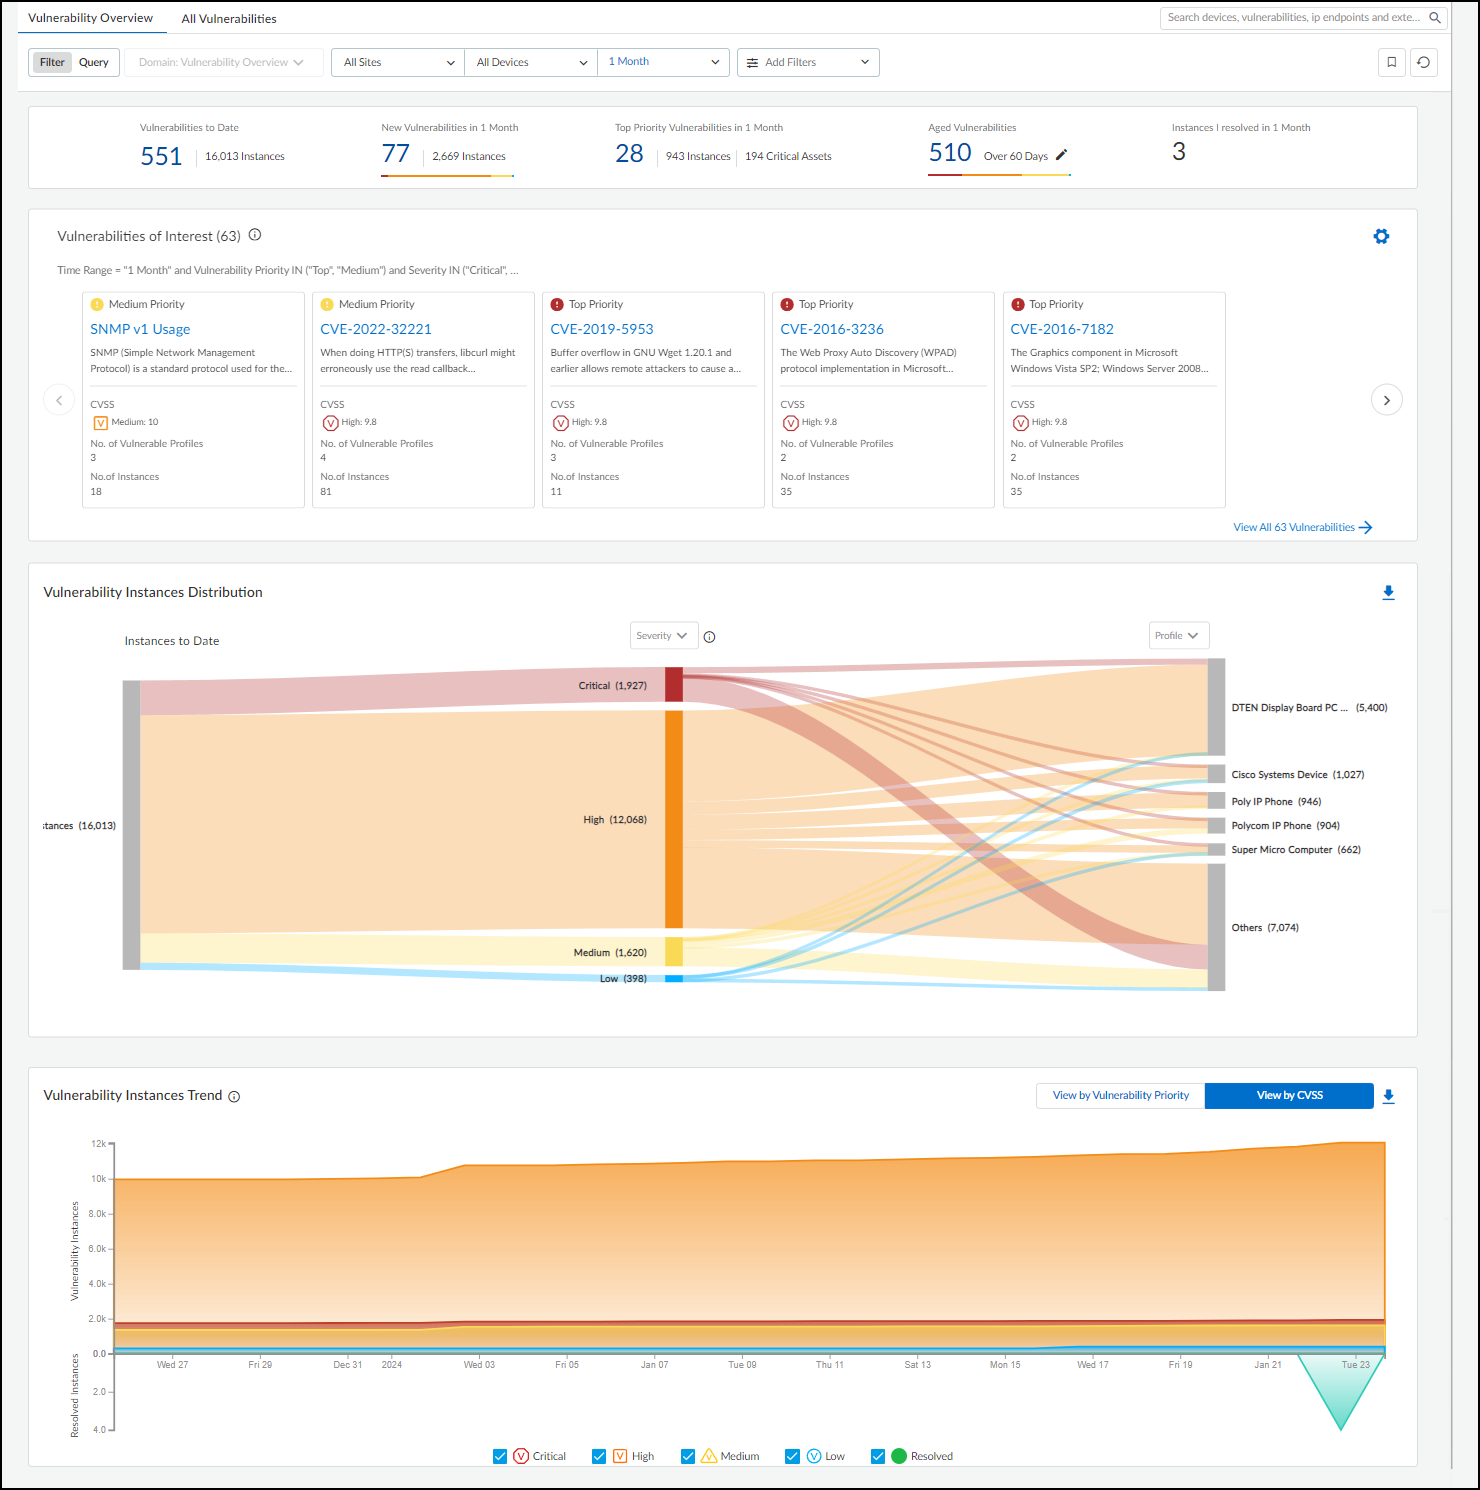
At the top of the page is a summary of key vulnerability statistics within the parameters defined by the filters for sites, device category, and time range.
- Vulnerabilities to Date – This is the total number of vulnerabilities detected since you began using your IoT Security tenant.
Although IoT Security retains security alerts in its database for up to one year, it does not impose this time limit on vulnerabilities. If you've been using IoT Security longer than a year, it will continue showing vulnerabilities detected more than a year before.
- New Vulnerabilities in <time range> – This is the total of vulnerabilities that were detected within the time range specified in the data filter at the top of the page.
- Top Priority Vulnerabilities in <time range> – This is the total number of vulnerabilities that IoT Security prioritized as "Top". (There are also "Medium" and "Low" priorities.) It's followed by the number of instances for these vulnerabilities and the number of critical assets they affect. If you click one of the links here, IoT Security opens All Vulnerabilities with filters applied to show only top-priority vulnerabilities within the site, device type, and time range set on Vulnerabilities Dashboard .
- Aged Vulnerabilities – This is the total of all vulnerabilities that remain unresolved beyond the specified time range (30, 60, 90, or 180 days).
- Instances I resolved in <time range> – This is the total of vulnerability instances that were assigned to the person currently logged in and which were resolved during the time range specified in the data filter at the top of the page.
Vulnerabilities of Interest – Define criteria for vulnerabilities that matter most to you. IoT Security will then display the top ten vulnerabilities in response to your query with the most severe CVSS scores and those affecting the most device profiles displayed first. For example, if you want to see vulnerabilities for a specific vendor or profile that were detected within the last week, click the gear icon (
![]()
) and configure a query to show the vulnerabilities that interest you. IoT Security then displays the ten most severe vulnerabilities with the broadest impact that match your terms.
By default, IoT Security uses the predefined "Risky Vulnerabilities" query to search for confirmed critical vulnerabilities for which a proof of concept (PoC) is publicly available. You can edit this query to define other attributes of interest and then click the bookmark icon (
![]()
) to save it for reuse.
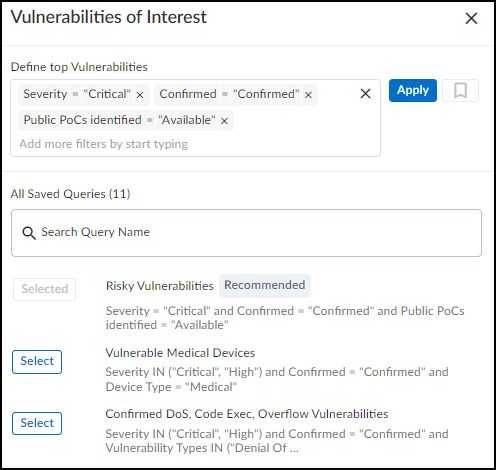
Vulnerability Instances Distribution – The Sankey chart lets you see the distribution of vulnerability instances across different groupings of devices. Reading the chart from left to right, you start off on the left with all the vulnerability instances that match the site and device category filters at the top of the page. (Regardless of the time range filter set for the page, this chart shows all vulnerability instances to date.) The chart then relates these instances to a type of grouping in the middle and relates these again to another type of grouping on the right. The choices for these groupings are Severity , Vulnerability Type , Status , Device Type , Device Category , Profile , Vendor , Exploit Status , Attack Vector (the type of access required to exploit a vulnerability, as defined in a CVE), and Vulnerability Priority (Top, Medium, Low). Vulnerability instances are distributed vertically in the chart by severity (when Severity is the chosen grouping), priority (when Vulnerability Priority is chosen), or by instance count (for all other types). Those groupings with the highest severity, highest priority, or most instances are at the top of the chart. When there are more than five groupings, the Sankey chart shows the top five and then gathers everything else in an "Others" group. Hover your cursor over Others to see a list of the next ten groupings, and click View all to see a pop-up panel with a complete list.
When you use Profile to group instances and then hover your cursor over an area on a post for a particular profile, IoT Security displays an Action pop-up panel that lets you create a set of recommended policy rules with this profile as the source.
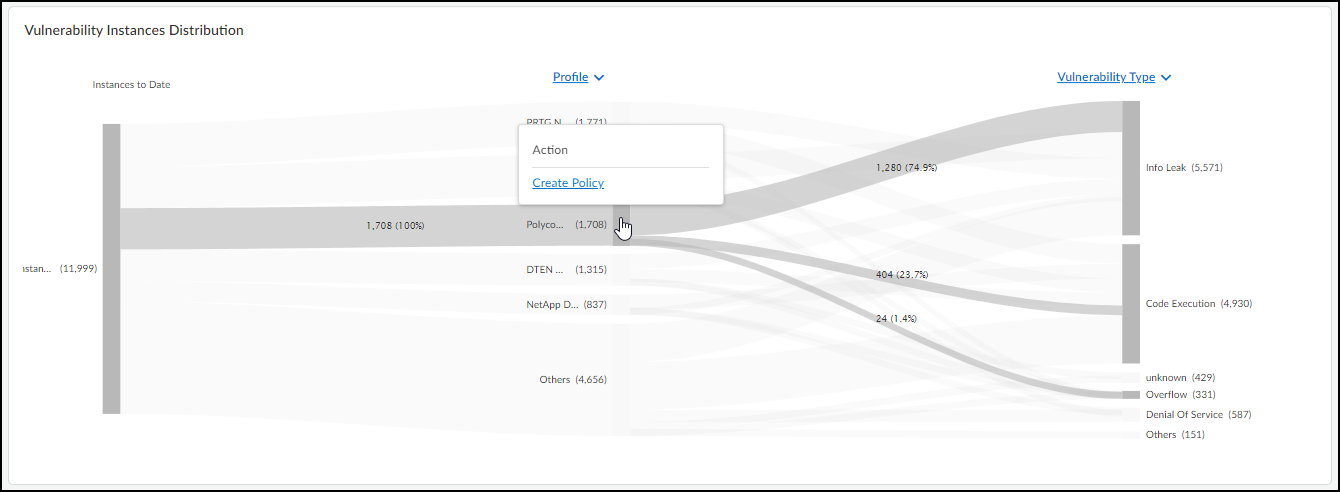
When you click Create Policy , IoT Security opens AssetsDevices> profile-name > Create New Policy Set . From there, you can modify the automatically generated policy set if necessary, save it, and then activate it for firewalls to import.
For example, to see the ratio of vulnerability instances among different device profiles and different vulnerability types, choose Profile for the middle post and Vulnerability Type for the right post. The gray bands between the left and middle posts show how many instances pertain to each of the top five device profiles, and the gray bands between the middle and right posts show how many instances in each profile belong to different vulnerability types. Each band is labeled and shows the total number of vulnerability instances per profile (on the left) and for that profile per vulnerability type (on the right). The width of the bands lets you see at a glance the relative quantities of vulnerability instances. Hovering your cursor over a section of a post shows the percent of instances for the adjacent bands.
Colors only convey meaning to denote vulnerability severity levels: red = critical, orange = high, yellow = medium, and blue = low. For other types of groupings, semi-transparent shades of gray are used solely to distinguish one band from another.
To download the data from the Sankey chart for your records or reports, click the download icon (
![]()
) in the upper right above the chart. IoT Security saves it as an .xlsx file with vulnerability instance distribution information on the first sheet and a complete list of vulnerability instances on the second.
Vulnerability Instances Trend – The Instance Trend chart displays a cumulative count of vulnerability instances over the specified time period and a daily noncumulative count of resolved instances. This visually shows vulnerability instance trends to help vulnerability management teams see if the number of vulnerability instances has been increasing or decreasing over time. You can view data presented either by vulnerability priority (Top, Medium, Low priorities) or CVSS score (Critical, High, Medium, Low). Use the toggle on the right above the chart to switch between the two views. When using the CVSS score view, the chart also displays data for resolved vulnerability instances, which can help teams gauge their progress in regard to vulnerability resolution. Hover your cursor over different points on the chart to see the number of vulnerability instances with different priorities or CVSS scores for different dates.
To download data from the Instance Trend chart for reports or records, click the download icon (
![]()
) in the upper right above the chart. IoT Security saves it as an .xlsx file with the number of vulnerability instances to date and resolved instances over the specified period of time.
Vulnerabilities Page
Vulnerability Overview Dashboard
|
Where Can I Use This? |
What Do I Need? |
|
|
The Vulnerabilities page ( VulnerabilitiesVulnerability OverviewAll Vulnerabilities ) lists the vulnerabilities that IoT Security has detected or learned about through a third-party integration .
You can search for a text string in any of the columns, download the list of vulnerabilities, create a filter to show only the vulnerabilities you want to see, and control which columns you want to show and hide.
![]()
Although the Severity column in the table shows only icons, you can still search by the severity level words Critical, High, Medium, and Low.
You can also set the number of rows you want to see on each page (from 5 to 200) and navigate among multiple pages.

|
CVSS Score Range |
Severity Level |
|
9.0 – 10.0 |
Critical |
|
7.0 – 8.9 |
High |
|
4.0 – 6.9 |
Medium |
|
< 4.0 |
Low |
While a severity level in the IoT Security system reflects a Common Vulnerability Scoring System (CVSS) score, there isn’t always a direct correlation between the two. IoT Security bases the severity level not only on the CVSS score but on other determing risk factors as well. For example, a hard-coded password in a device might have a CVSS score of 10.0, but an IoT Security severity level of High rather than Critical. This can happen when there isn’t proof that the device can be accessed from the Internet or by an unauthorized user. While the National Institute of Standards and Technology (NIST) assigns a CVSS score to a vulnerability generically, IoT Security assigns a “risk severity” level to vulnerabilities based on the specifics of each case.
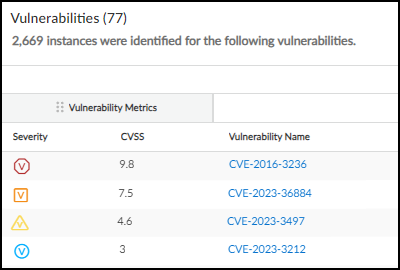
The Vulnerabilities table columns are organized into five categories: Risk, Basic, Vulnerability Metrics, Threat Metrics, and Impact Metrics. While the Risk and Basic categories each contain a single column, the three metrics categories each contain a group of columns. You can click-drag columns to rearrange them within their respective groups or click-drag the groups to rearrange their order on the table. However, you can't click-drag columns outside of their groups while grouping is enabled. To disable grouping, click the three vertical dots icon above the table on the right and click Ungroup columns . With the columns ungrouped, you can reposition them so that they mingle with columns that were previously separated into other groups.
As with other tables in the IoT Security portal, you can control which columns are shown. Click the three vertical dots above the table on the right, click Edit columns , and then select the columns you want to see and clear the ones you want to hide.
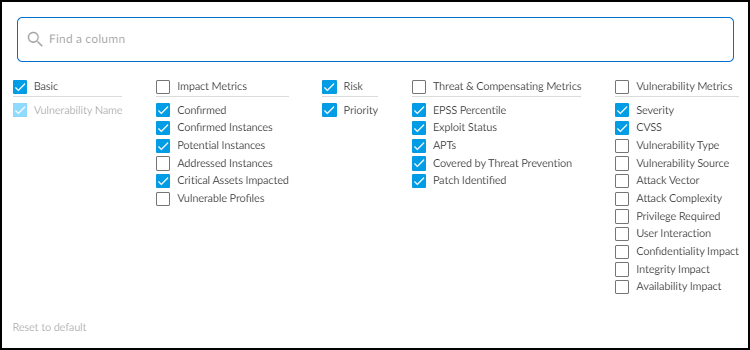
Risk – The risk is a sort of ranking of the potential danger a vulnerability poses. It's the result of various factors that, when combined, help you prioritize which vulnerabilities to watch and address.
- Priority – IoT Security determines a ranking of Top, Medium, and Low by weighing various factors that calculate the likelihood of an attack and the impact it would pose on your resources. Hover your cursor over a priority to see a summary of the indicators of risk that contribute to its ranking.
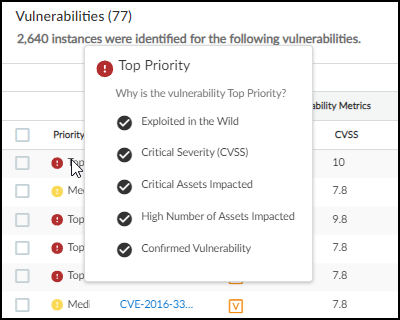
When Processing... is displayed here, it indicates that IoT Security is still determining the priority of a vulnerability. Because IoT Security runs a service to determine priority on a daily basis, it can take up to 24 hours to determine the priority of a device.
IoT Security automatically assigns a high asset criticality level to industrial and medical devices and a medium level to all other devices by default. It does this through the system-defined Asset Criticality attribute, which you can see in SettingsCustom Attributes . You can also define filters on AssetsDevices and add them to the Asset Criticality attribute to assign different asset criticality levels to devices based on attributes such as device category, profile, or vendor. For example, you might first define a filter for patient monitor profiles on AssetsDevices and then add a rule to the system-defined Asset Criticality attribute, the rule stating that if a device matches the filter for patient monitor profiles, then IoT Security will apply an asset criticality level of Critical to it.
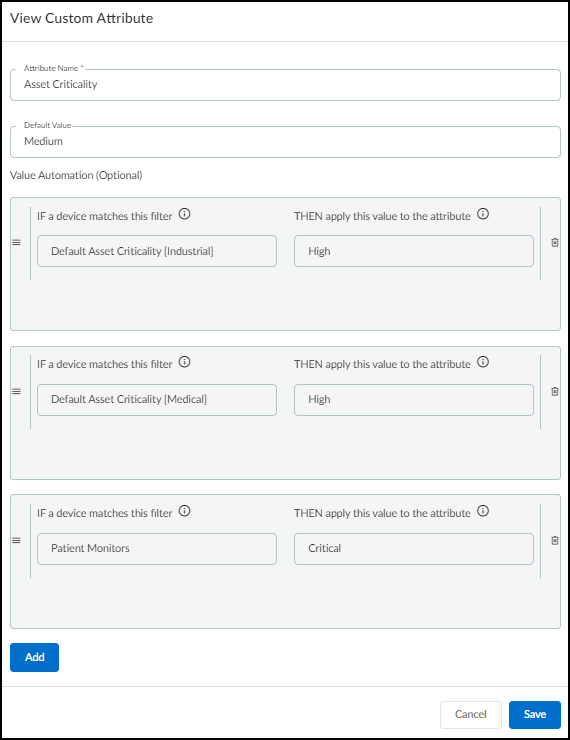
You can also edit asset criticality for an individual device on its Device Details page. Click Edit in the Custom Attributes section and change the Asset Criticality field to the level you want.
Basic – This is the name of a vulnerability.
- Vulnerability Name – The name or Common Vulnerabilities and Exposures (CVE) number of a vulnerability. This links to the Vulnerability Details page .
Vulnerability Metrics – These metrics are about vulnerabilities and the attacks that exploit them
- Severity – The severity level of a vulnerability: critical, high, medium, or low.
- CVSS – The CVSS (Common Vulnerability Scoring System) score of a vulnerability.
- Vulnerability Type – (Not shown by default) This identifies the type of vulnerability, such as Info Leak, Overflow, or Code Execution.
- Vulnerability Source – (Not shown by default) The source that identified the device vulnerability: IoT Security, a third-party integration (Rapid7, Qualys, Tenable), or IoT Security Device Software Library.
- Attack Vector – (Not shown by default) Also referred to as "Access Vector", this is the type of access an attacker must have to exploit a vulnerability. The metric values are defined in the CVE. The vulnerability score increases as the possible distance from the target increases:
- Physical – An attacker must physically touch or control the vulnerable device.
- Local – An attacker must launch an exploit locally or use social engineering to dupe a user into helping launch it.
- Adjacent – An attacker must have access to the same physical or logical network as that of the vulnerable device.
- Network – An attacker can launch an exploit remotely from anywhere on a network that can access the vulnerable device.
When an attack vector is not defined, it's classified as "Unknown".
- Attack Complexity – (Not shown by default) Indicates the level of complexity required to exploit a vulnerability "Low" or "High".
- Privilege Required – (Not shown by default) Indicates the level of administrative privilege necessary to execute an exploit on the vulnerability, which can be "None", "Low", or "High".
- User Interaction – (Not shown by default) Whether a user, other than the threat actor, must participate in exploiting a vulnerability in some way. The values shown here are "None" or "Required".
- Confidentiality Impact – (Not shown by default) Whether sensitive information would be accessible to an attacker exploiting the vulnerability and the degree of sensitivity that might be disclosed. The values are "None", "Low", and "High".
- Integrity Impact – (Not shown by default) Whether protected information might be altered in any way. The values are "None" (no loss of data integrity), "Low" (a small amount of data can be modified), and "High" (any or all data can be modified).
- Availability Impact – (Not shown by default) Whether an exploit of the vulnerability makes data or devices inaccessible. The values are "None" (no loss of availability), "Low" (either poor performance or occasional loss of accessibility), and "High" (complete loss of accessibility).
Threat Metrics – These metrics focus on the threat that vulnerabilities pose to the security of your network and the devices on it.
- EPSS – The Exploit Prediction Scoring System (EPSS) provides a daily estimate of the probability that a vulnerability will be exploited within the next 30 days. To learn more about EPSS, see the EPSS Model .
- Exploit Status – (Not shown by default) Shows if a proof of concept has been identified for the vulnerability ("POC") or not ("Unknown").
- APTs – (Not shown by default) Shows if there have been any known exploits of a vulnerability for Advanced Persistent Threats (APTs). The values are "Yes" or "No".
- Covered by Threat Prevention – (Not shown by default) Indicates if a vulnerability is covered by the Palo Alto Networks Threat Prevention application ("Yes") or not ("No").
Impact Metrics – These metrics provide insight into how extensive and severe the impact would be of an exploited vulnerability.
- Confirmed – Indicates if a vulnerability is confirmed to apply to one or more devices. An empty field indicates that it is a potential vulnerability .
- Confirmed Instances – The number of devices to which a vulnerability is confirmed to be applicable. This number links to the Vulnerability Details page .
- Potential Instances – The number of devices to which a vulnerability might be applicable but has not been confirmed. This number also links to the Vulnerability Details page .
- Addressed Instances – (Not shown by default) The number of instances of the vulnerability that have been addressed.
- Critical Assets Impacted – The number of assets categorized as critical that the vulnerability impacts.
- Vulnerable Profiles – The number of device profiles to which a confirmed or potential vulnerability applies.
When you hover your cursor over an entry in the Vulnerability column, a panel pops up with showing its description and impact.
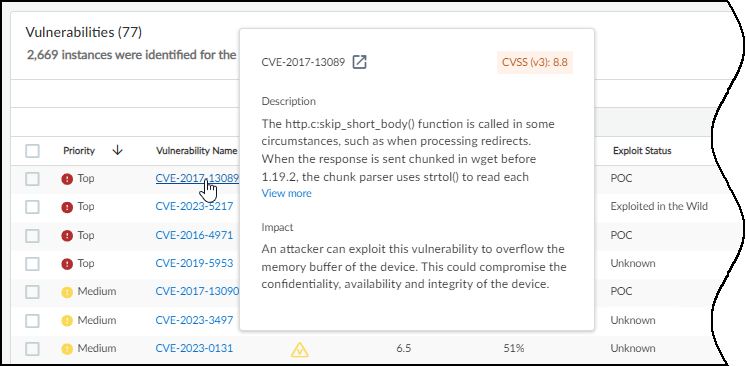
Clicking the name of a vulnerability entry opens the Vulnerability Details page.
Vulnerability Details Page
|
Where Can I Use This? |
What Do I Need? |
|
|
Clicking the CVE (Common Vulnerabilities and Exposures) link in the Vulnerability column or a number in the Confirmed Instances or Potential Instances column on the Vulnerabilities page opens the Vulnerability Details page for that vulnerability ( VulnerabilitiesVulnerability OverviewVulnerabilitiy Details ). Here you can read a description of the vulnerability, see details about it, and learn which device profiles it affects. You can also see which devices the vulnerability affects or potentially affects.
At the top of the Vulnerability Details page are several important attributes:
- The CVE ID links to a page about the vulnerability in the National Institute of Standards and Technology (NIST) database. For example, clicking CVE-2022-4436 opens https://nvd.nist.gov/vuln/detail/CVE-2022-4436 .
- The CVSS (Common Vulnerability Scoring System) score ranks the vulnerability on a scale of 0-10, where 0 is the least severe and 10 is the most.
- The IoT Security rating system, which is based on the CVSS, categorizes a vulnerability score into one of several severity levels. There are two CVSS versions and both are presented:
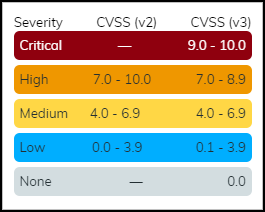
Next is a section describing what the vulnerability is, how it was detected, and the source of its discovery. It also explains the impact the vulnerability can cause if exploited and recommended actions you can take to remediate it. Finally, there is a chart that shows the total number of affected devices grouped by profile and the relative sizes of each group.
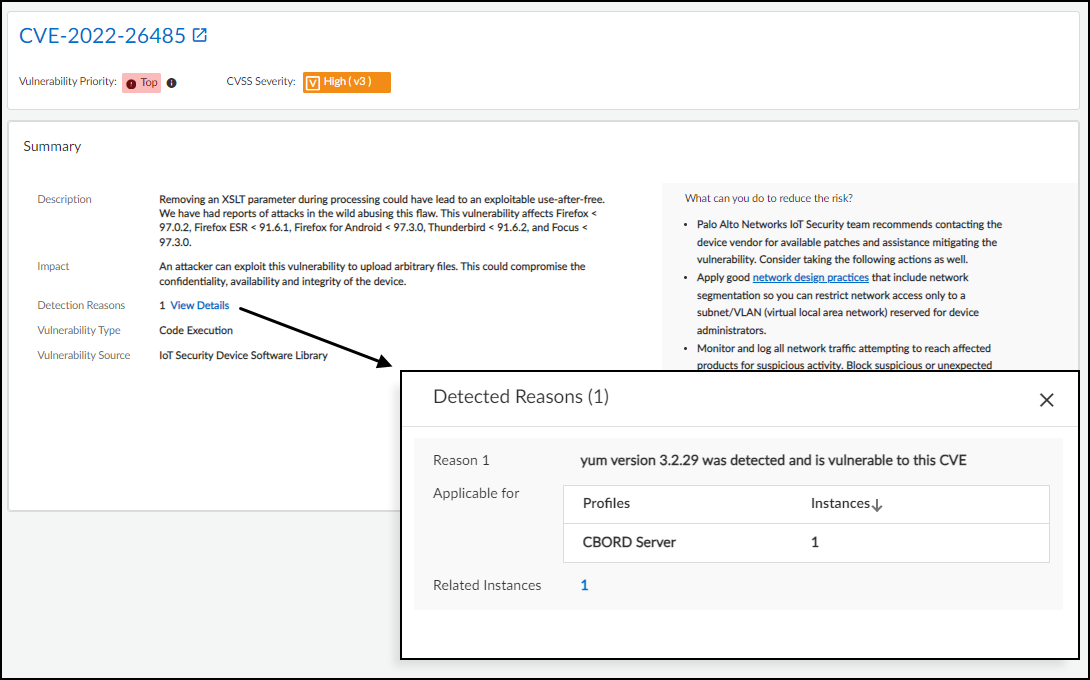
Summary
- The Description summarizes the vulnerability.
- The Impact section explains how attackers can exploit the vulnerability and the threat it poses.
- Detection Reasons explain how confirmed vulnerability instances were detected. When you click View Details , a panel appears over the right side of the page showing each detection reason, the device profiles it applies to, and the number of vulnerability instances that were detected for different profiles. (Reasons for the detection of potential vulnerabilities are not shown.)
- The Vulnerability Type identifies the category of the vulnerability, such as code execution, info leak, overflow, and denial of service.
- The Vulnerability Source identifies where the vulnerability was detected. One source of detection is IoT Security when it's based on device attributes such as firmware, model, and OS. Another source is IoT Security Device Software Library when the detection is based on the software and applications running on a device. Yet another source is one of the third-party vulnerability scanners with which IoT Security integrates: Qualys, Rapid7, or Tenable.
- IoT Security lists any identified software patches that can remediate the vulnerability.
We recommend that you don't apply patch updates identified by IoT Security to your devices until your security or vulnerability management team or the product vendor has qualified them to ensure there are not any unexpected results or side effects.
- On the right side of the Summary section is a list of recommendations. It typically includes various options you can take to reduce the risk that the vulnerability poses or even remediate the issue.
Vulnerability Metrics – In this section, you can see CVE submetric scores , which provide additional insight to the vulnerability severity level to help you prioritize remediation efforts. For example, vulnerabilities that can be exploited remotely might require a more urgent response than other vulnerabilities, even if the others have a higher CVSS score.
- The exploitability metrics include the attack vector (Network, Adjacent, Local, or Physical), attack complexity (High or Low), what privileges are required to launch an attack, and whether human action—other than that of the attacker—is required during the exploit.
- The impact metrics indicate what areas an exploit might affect—confidentiality, integrity, and availability—and what the impact is in these areas—none, low, or high.
- The scope metric indicates if the effects of an exploited vulnerability are limited to the impacted component (Unchanged) or they can extend to other components as well (Changed).
Threat & Compensating Metrics – In this section, you can see information about the likelihood that the vulnerability will be exploited, the types of exploits that are known to have occurred, and if there are options to compensate the threat through the Palo Alto Networks Threat Prevention application.
- The Exploit Prediction Scoring System (EPSS) percentile is a daily estimate of the probability that the vulnerability will be exploited within the next 30 days. To learn more about EPSS, see the EPSS Model .
- The exploit status can be one of the following:
- Unknown – There is no known or weaponized malware exploiting this vulnerability.
- POC – There's known code to exploit the vulnerability to demonstrate a security weakness.
- Weaponized – There's a known exploit that is malicious or works consistently against targets.
- Exploited in the Wild – An exploit of the vulnerability has been publicly reported in the wild, either by threat actors or in the Known Exploited Vulnerability (KEV) catalog .
- By clicking View Details for Exploits Identified, you can see a list of known POC and Weaponized exploits (but not any whose status is Unknown or Exploited in the Wild). For each one, there is a URL (source) where you can learn more, the exploit status, and the date that the exploit was published.
- Advanced Persistent Threat (APT) indicates if any exploits are known to have been used by an APT. By clicking View Details , you can see a list of APTs. For each one, there's the name of the APT, a description about it, the countries they've targeted, the known CVEs they've exploited, and the tactics and techniques they've employed.
- Threat prevention coverage indicates if a vulnerability is covered by the Palo Alto Networks Threat Prevention application or not. By clicking View Details , you can see the name of the vulnerability, its unique threat ID number, the minimum PAN-OS version that supports it, the dates of its first release and latest update, and a URL (reference) where you can learn more.
Impact View – In this section, you can see the number of devices that the vulnerability affects and their various levels of criticality: critical, high, medium, low. The level of criticality helps you assess the level of impact your organization would incur if they were compromised.
- Asset Criticality – In the Asset Criticality tab, a chart and accompanying table show the total number of assets (instances) affected by the vulnerability and the number and percent of affected assets at each level of criticality. The chart provides a visual representation of the data contained numerically in the table. By selecting and clearing the Critical, High, Medium, and Low check boxes in the table, you can show and hide the corresponding segments in the chart.
- Confirmed – In the Confirmed tab, a chart and table show the total number of assets that are confirmed to be vulnerable and those that are potentially vulnerable but not yet confirmed. In addition to the total, they also show the percent of assets that are confirmed and unconfirmed to be vulnerable. You can select and clear the check box for each row to show or hide the corresponding segment in the chart.
- Profiles – In the Profiles tab, a chart shows the total number of affected devices grouped by profile and the relative sizes of each group. When you hover your cursor over a section in the chart, a pop-up appears identifying that profile and the number of devices in it. This is particularly helpful when a vulnerability affects numerous device profiles.
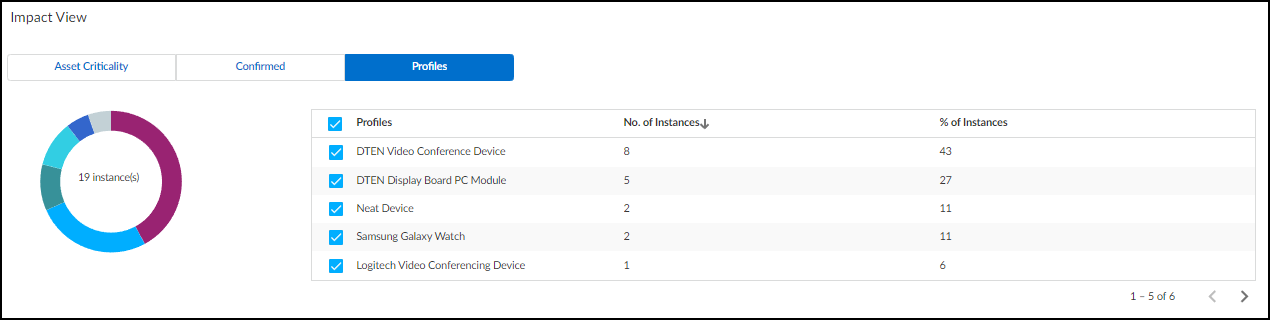
At the bottom of the Vulnerability Details page are two tabs—Active Instances and Addressed Instances. On each tab a table shows all vulnerable and potentially vulnerable devices, which are referred to as instances. Here’s an example to clarify the difference between these two types of devices. If a vulnerability only affects devices running a specific software version and IoT Security identifies the version running on one device as having this vulnerability but it can't identify which software version is on another, then the first device is considered as having a confirmed vulnerability but not the second one. (If Yes appears in the Confirmed column, a device is confirmed as vulnerable. If the Confirmed column is empty, a device is potentially vulnerable but it’s not confirmed.)
A vulnerability instance initially appears in the Active Instances tab.
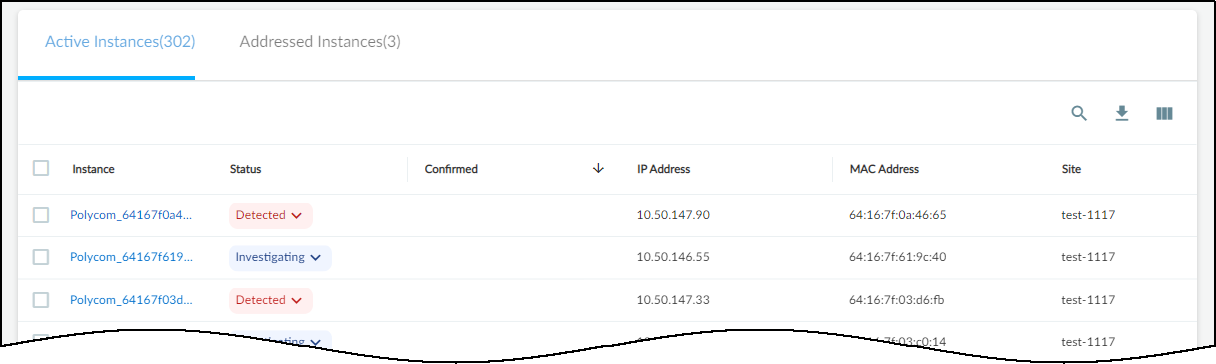
As soon as you change the status of a vulnerability instance to Resolved , IoT Security moves it from the Active Instances tab to the Addressed Instances tab.
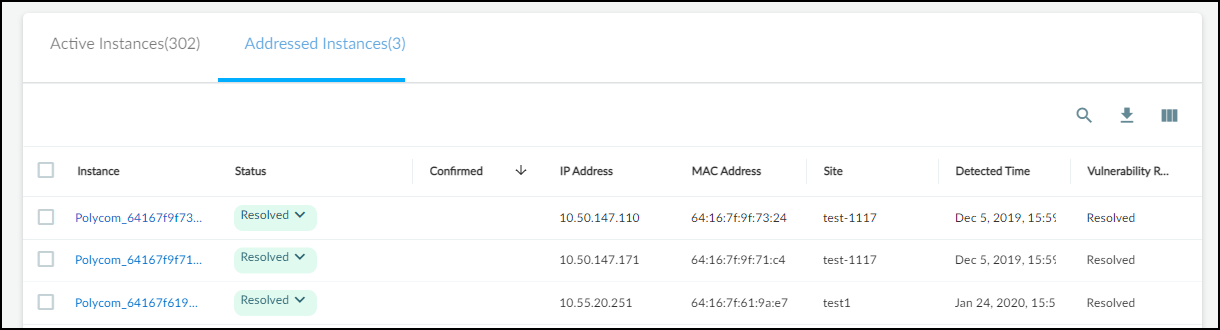
If you later change a resolved instance to Detected , it's automatically moved back to the Active Instances tab.
To see more information about a device, click the device name in the Instance column to open the Device Details page for it in a new browser window or tab.
The status of a vulnerability instance begins in the Detected state. You can leave it there or set it to a different state to reflect where it's in the remediation process:
- Detected : This is the state of a newly detected vulnerability instance. It makes sense to keep it in this state if no action has been taken to investigate, remediate, or resolve it.
- Investigating : Consider setting a vulnerability instance in this state after preliminary work on it has started and it’s being verified, researched, and its impact analyzed.
- Remediating : Consider setting an instance in this state while action is being taken to remediate it but has not yet completed.
- Resolved : An instance becomes resolved either by mitigating the issue or by ignoring and accepting it.
To change the state of a vulnerability instance, click the entry in the Status column and choose another state.
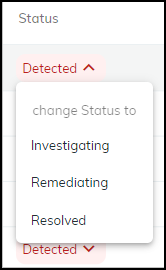
When you resolve a vulnerability instance, IoT Security prompts you to provide a reason for its resolution.
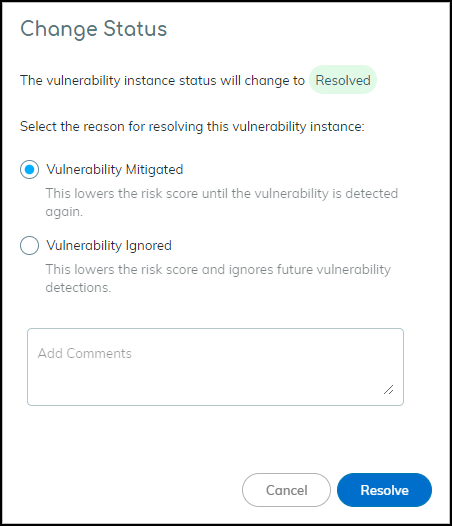
To assign a vulnerability instance to someone to work on, select the check box for the instance, and then click MoreAssign . Enter the username or email address of a user and then click Assign .
The person to whom you assign a vulnerability instance must have an IoT Security user account so that it can send a message to the appropriate email address.
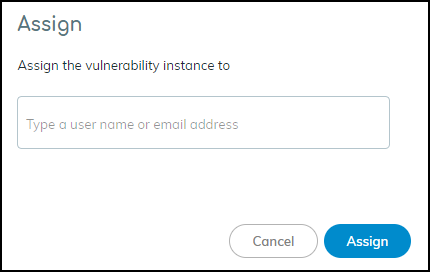
The user then receives an email message that states that a vulnerability was assigned to him or her and provides a link to the vulnerability for investigation.
To add a note about a vulnerability instance or the work being done on it, select the check box for the instance, and then click MoreAdd notes . Enter the note and then click Add .
The Vulnerability Responses column displays Added Notes.
To read the note and any previous status changes that were made, hover your cursor over “Added Notes”. An historical record about the response to the vulnerability instance appears in a pop-up window.
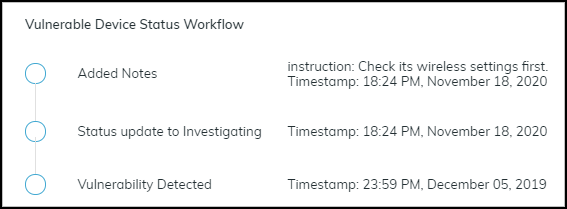
IoT Risk Assessment
|
Where Can I Use This? |
What Do I Need? |
|
|
Assessing risk is a continuous process of discovering vulnerabilities and detecting threats. During this ongoing process, IoT Security measures risk and assigns a score for the amount of risk it observes. In fact, IoT Security measures and scores risk at four levels, starting from individual IoT devices and expanding in scope to device profile, site, and finally organization. The different scores provide a simple means to check the risk posed at various points and areas of your network.
When assessing risk, IoT Security uses both static and dynamic factors. Static risks form a baseline and include the following:
- All MDS2 risks (for medical equipment)
- Intrinsic risk factors specific to a profile such as OS, applications, roles, environment
- Trending threats that are hard to mitigate
- The usage behavior specific to a profile or a device
Dynamic risks are added on top of the baseline risk:
- Threats detected in real time (example: alerts)
- Behavioral risks (anomalies, user practice issues) which also trigger alerts
- Vulnerabilities (discovered through passive analysis and detections and through vulnerability scans using integrated third-party vulnerability scanning engines like Qualys and Rapid7)
By collecting and modeling data and analyzing vulnerabilities and threats, IoT Security calculates risk on a daily basis. The risk scores it generates consists of alerts, vulnerabilities, behavioral anomalies, and threat intelligence. When calculating the risk scores of device profiles, sites, and organizations, IoT Security considers not only the scores of individual devices within a particular group but also the percent of risky devices in relation to all devices in the group.
The following sections provide more information about the risk scores that IoT Security generates for these four levels: device, device profile, site, and organization.
Device Risk
IoT Security displays the risk score for each device in the Risk column on the Devices page ( AssetsDevices ). It generates risk scores for devices on a daily basis.
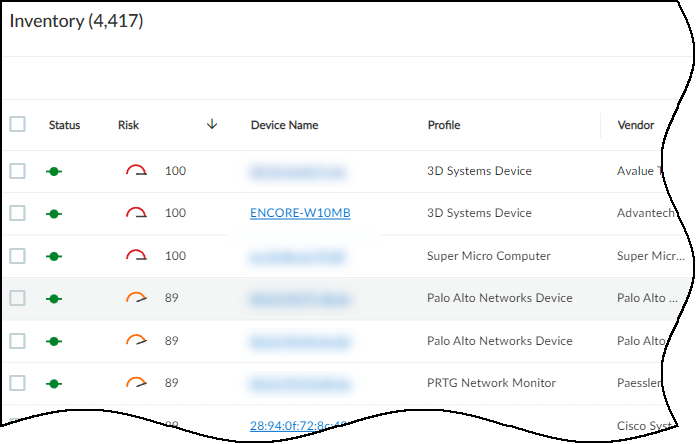
Also see the Device Details page ( AssetsDevices > device-name > Device Details ) where the device risk score is listed twice—at the top and in the Security summary section. The Risks section includes a graph that charts changes in the risk score over the specified period of time: day, week, month, year, or all to date. The graph lets you see how the risk score trends over time. Hover your cursor over a marker on the line to see a list of alerts for that point in time. Click a marker to see a list of alerts below the graph.
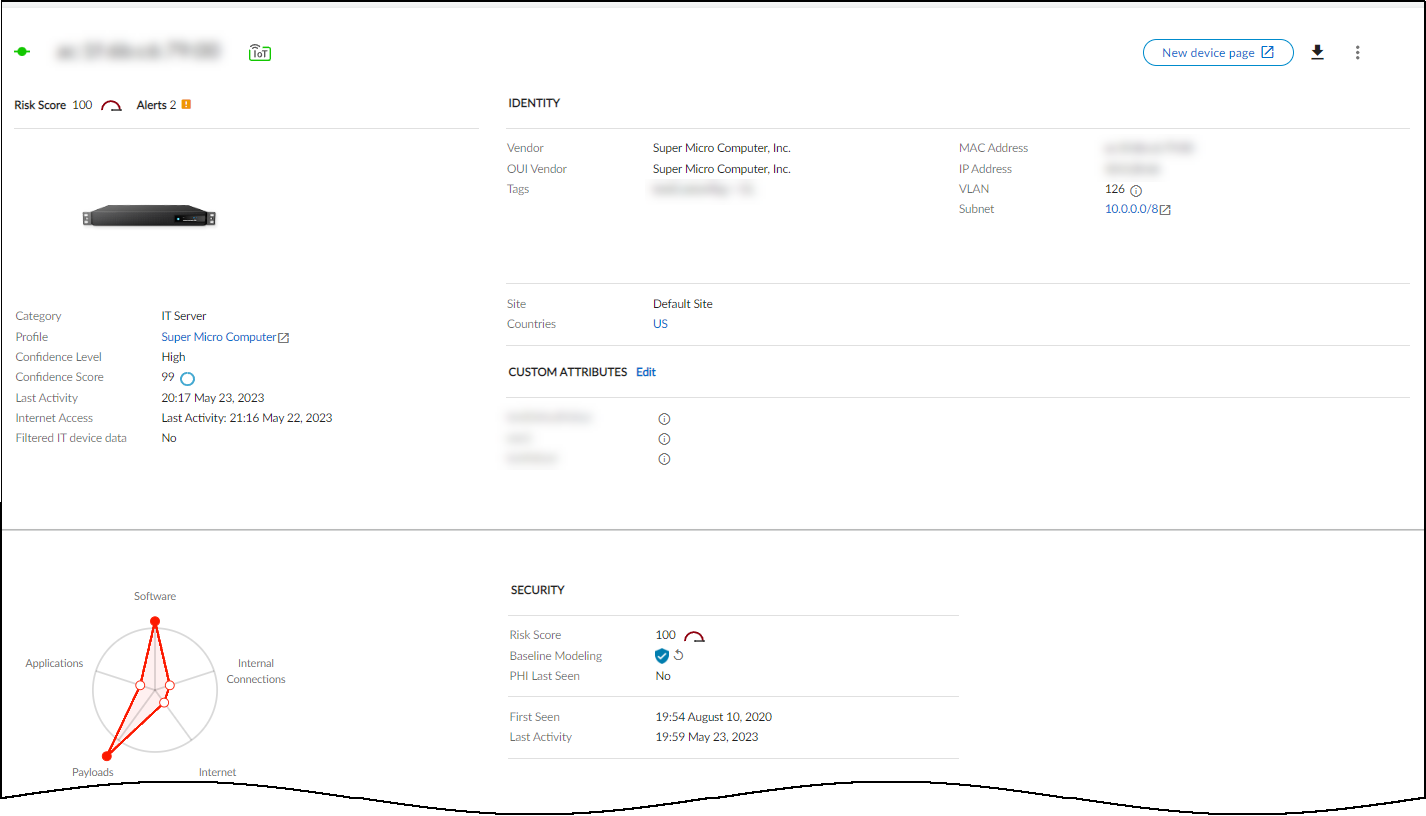
Device Profile Risk
IoT Security displays risk scores for device profiles in the Risk column on the Profiles page ( AssetsProfiles ).
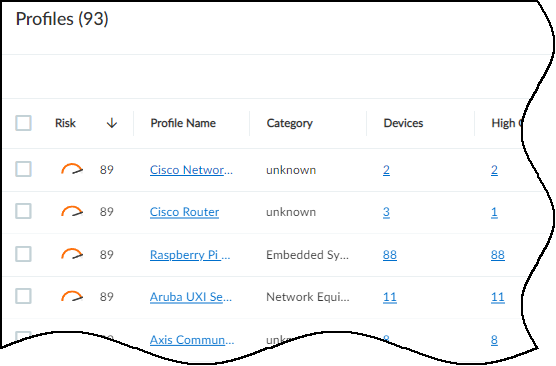
IoT Security uses the scores of individual at-risk devices (that is, those with a risk score of 40 or higher) in the same profile to calculate the risk score for the entire device profile. However, it’s not as simple as averaging the risk scores of all the devices in the profile. The computation takes other factors into consideration such as the number of risky devices in the profile.
For example, if five devices in the same profile have individual risk scores of 42, IoT Security would calculate the risk score for the profile to be 89. In this case, because all of the devices in the profile are at risk, the profile score becomes higher than you might have expected at first.
Consider another example, again with five devices in the same profile. One device is at high risk with a score of 98. The other four devices are at normal risk each with a score of 30. In this case, IoT Security calculates the risk score for their profile to be 64. In such a small set, the one high-risk device has a much greater impact on the profile score than it would if the scores of more devices had been involved in the calculation.
Site Risk
See the Risk Score column in the Risk column on the Sites page ( NetworksNetworks and SitesSites ).
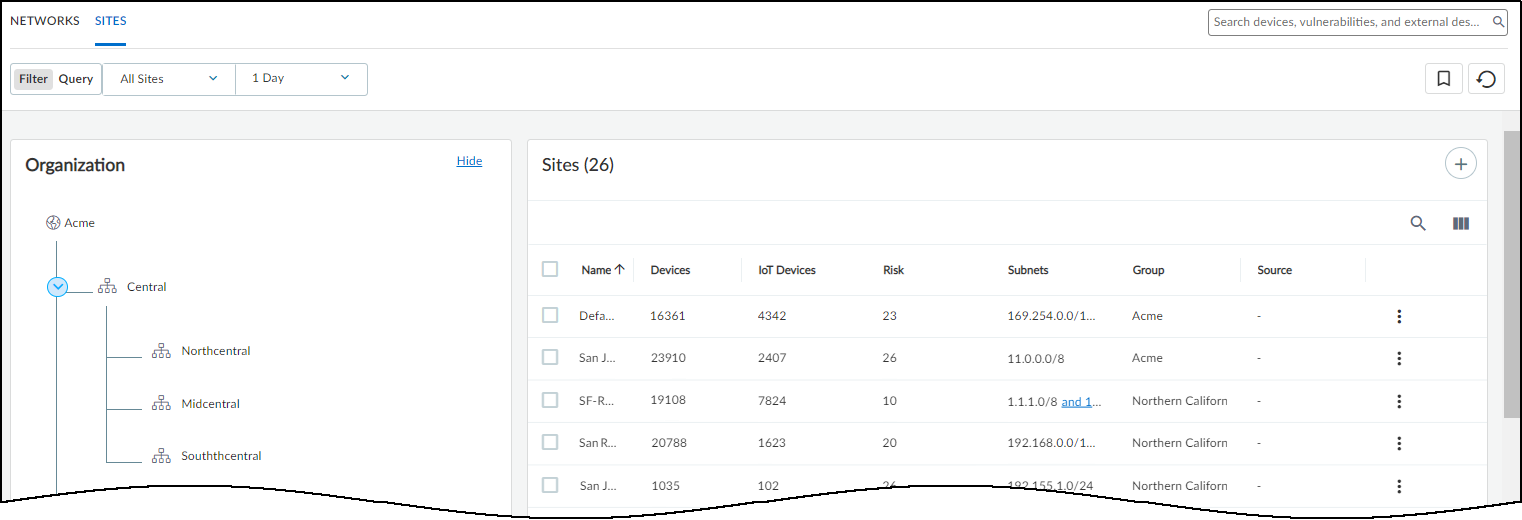
The formula that IoT Security uses to calculate the risk score for a site uses a weighted average of device profile risk scores, the weight for each profile being determined by the number of devices in the profile and the profile risk level.
Organization Risk
See the Risk Score in the Risk panel on the DashboardsSecurity Dashboard .
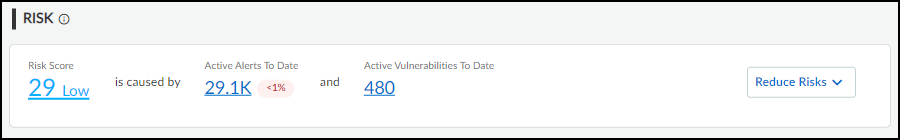
IoT Security uses the same method to calculate the risk score for an organization as it does for sites.
Risk Scores and Severity Levels
The following explains how the severity of a risk score is ranked:
|
Risk score |
Risk severity |
Notes |
|
< 40 |
Low |
This is a normal risk level. |
|
40-69 |
Medium |
There might be a few anomalous network behaviors, medium-level alerts, and vulnerabilities with CVSS (Common Vulnerability Scoring System) scores between 4.0 and 6.9. |
|
70-89 |
High |
There might be multiple highly anomalous behaviors, high-level alerts, and vulnerabilities with CVSS scores between 7.0 and 8.9. |
|
90-100 |
Critical |
There might be multiple extremely anomalous behaviors, critical alerts (such as a malware attack), and vulnerabilities with the highest CVSS score of 10. |
Adjust Device Risk Scores
It’s possible to adjust how much individual risks contribute to the overall risk score of a device. On the VulnerabilitiesVulnerability OverviewAll Vulnerabilities page, click a number in either the Confirmed Instances or Potential Instances column to see details of a vulnerability including which devices it affects or potentially affects. Then click a device name in the Instance column to open the Device Details page for it.
IoT Security categorizes CVE-based risks differently based on their source. When IoT Security discovers them through its internal vulnerability-matching logic (Source = IoT Security Device Software Library) or as a result of a vulnerability scan, it categorizes them as vulnerabilities. When a firewall applies Threat Protection and reports them to IoT Security (Alert Source = Firewall), IoT Security categorizes them as alerts. The Adjust option only appears in the Action menu for vulnerabilities; or, in other words, for risks not categorized as alerts.
In the Vulnerabilities section, expand the Actions menu for a vulnerability and then click Adjust .
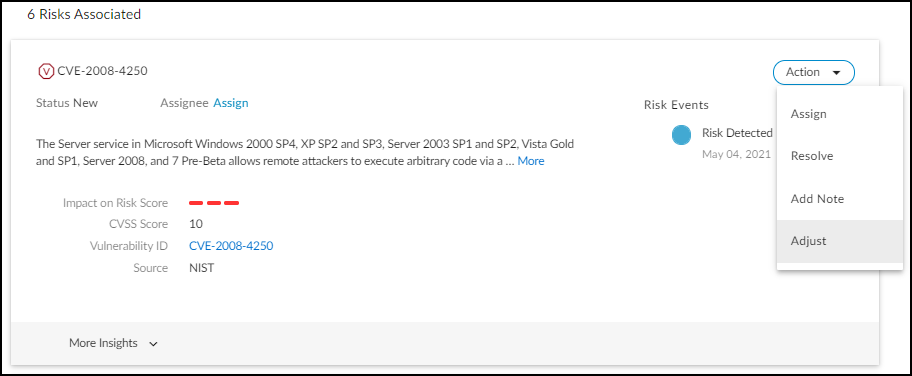
Take the severity of this risk and its impact on the organization into account and adjust how much you think it should contribute to the overall risk score of the device. Choose whether it makes a low, medium, or high contribution.
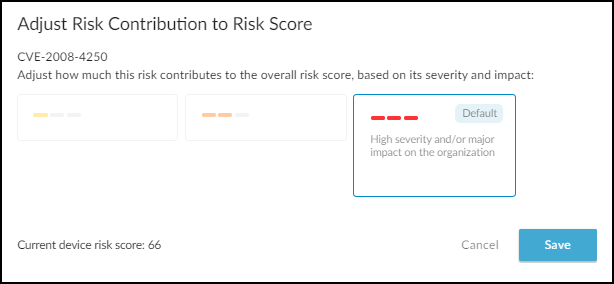
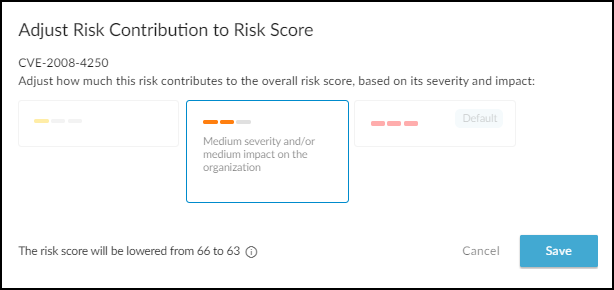
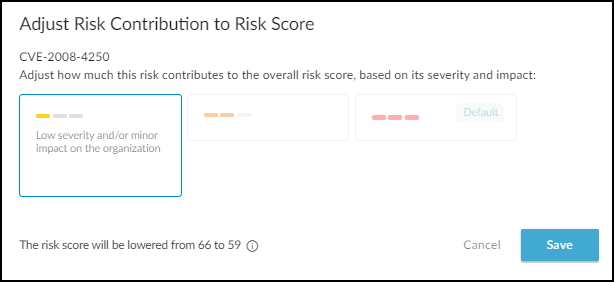
Note that the influence of the change you make on the overall score depends on the number and severity of other risk factors. If there are lots of risks, adjusting how much a single risk contributes to the score might not affect it much if at all. On the other hand, if there are only a few risks, adjusting the contribution of one can change the score significantly.
Alerts for Risk Score Changes
When the increase of a risk score causes it to cross a threshold separating one risk level from another, IoT Security generates a risk change alert. (Crossing a risk level threshold as the result of a risk decrease does not trigger an alert.) A risk increase triggers an alert with differing severity levels depending on the new severity of the risk:
- Warning when the risk level increases from high to critical
- Caution when the risk level increases from medium to high
To reduce the overall number of alerts generated, no alert is triggered when the risk level increases from low to medium.
In addition to risk scores changing because of a manually adjusted risk factor, they can also change for the following reasons:
Increased risk
- A daily risk refresh discovers new vulnerabilities or increased CVSS risk scores.
Decreased risk
- A user resolves a risk factor.
- A daily risk refresh discovers reduced vulnerabilities or decreased CVSS scores or mitigated risks.
Resolve Risks
You can resolve vulnerabilities and security alerts through a workflow built into the IoT Security portal. Essentially, you resolve them by either mitigating or ignoring the vulnerability or alert. As a result, the device risk score might be lowered depending on other contributing factors such as the severity of the risk and the number and severity of other risks. Resolving a vulnerability or alert on a device might similarly affect its profile, site, and organization risk scores depending on how big of an impact the change makes in relation to the number and risk levels of other devices in the same group. For information about resolving vulnerabilities and security alerts, see Vulnerability Details Page and Act on Security Alerts .
Customize Risk Scores
|
Where Can I Use This? |
What Do I Need? |
|
|
Risk scoring customization lets you specify risk management for your organization. By customizing the values and weights of risk factors, compensating controls, and asset criticality levels, you gain a more accurate representation of risk in your environment. You can also better understand what makes devices risky and which factors contribute most significantly to their risk scores. Regular review and adjustment of these settings ensure that risk scores remain relevant as your environment evolves. Use risk scoring customization to create a risk assessment framework tailored to your environment’s security posture and risk tolerance.
You can view the impact of different factors on a device’s risk score from the Device Details page. From there, you can also adjust existing compensating controls. To add new compensating controls or make changes to other factors, go to the Risk Score Configuration page.
Customize risk score factors across all of your assets from the SettingsRisk Score Configuration page. You can make adjustments to the following factors that contribute to a device's overall risk score:
- Vulnerabilities
- Security alerts
- Other risk factors
- Impact factor (asset criticality)
- Compensating controls
Customize How Vulnerabilities Affect Risk Scores
When you define a vulnerability rule, you specify a matching criteria for vulnerabilities and the resulting risk score. If a vulnerability matches the criteria of a vulnerability rule, then the vulnerability rule assigns the defined risk score to that vulnerability. IoT Security uses this risk score when considering the vulnerability’s impact on the overall device risk score. In the case that a vulnerability matches multiple vulnerability rules, then IoT Security applies the highest risk score to that vulnerability.
You can view and manage your vulnerability rules in the Vulnerabilities table on SettingsRisk Score Configuration . Hover over a vulnerability rule’s criteria to see the entire matching criteria. You can click on the number of matched CVEs to go to the Vulnerabilities page and see all the vulnerabilities that match the vulnerability rule, as well as all instances affected by each vulnerability. To edit an existing vulnerability rule, select the Edit (pencil) icon under the Action column.
- Navigate to SettingsRisk Score Configuration and select Add Vulnerability Rule from the Vulnerabilities table.
- In the Edit Vulnerability Criteria pop-up, specify the following:
- Vulnerability Rule Name : Enter a name for the vulnerability rule.
- Optional Description : Enter a description for the vulnerability rule.
- Vulnerability Criteria : Select the matching criteria you want to use for the vulnerability rule. You can select multiple attributes to use. If you select multiple attributes, then a vulnerability must match all criteria for the vulnerability rule to assign the custom risk score.
- Risk Score : Enter the risk score you want to assign to all matched vulnerabilities.
- Apply the vulnerability rule, and verify that the vulnerability rule appears in the Vulnerabilities table.
Customize How Security Alerts Affect Risk Scores
Security Alerts affect device risk scores depending on the severity of the alerts. To customize the risk score for security alerts, you can change the risk score of each security alert severity level. You can’t change the risk score for individual security alerts or security alerts on individual devices.
You can view and manage the risk score of security alerts in the Security Alerts section on SettingsRisk Score Configuration . The section displays the risk score assigned to each alert security level. To change a risk score, select the Edit (pencil) icon next to the risk score for the severity level you want to modify. You can also remove all security alert customizations by selecting Reset to Default .
Only users with an Owner role can adjust the risk score for security alert severity levels.
- Navigate to SettingsRisk Score Configuration and scroll down to the Security Alerts section.
- Select the Edit (pencil) icon next to the risk score of the severity level you want to modify.
- In the Edit Security Alert Risk Score pop-up, enter the new risk score you want to assign to the severity level.
Risk scores must be a number from 0 to 100. When choosing a risk score, you can’t exceed the risk score of a higher severity level. Nor can you choose a risk score that’s less than the risk score of a lower severity level.
- Confirm the new risk score and verify that the Security Alerts section displays the updated risk score.
Customize How Other Risk Factors Affect Risk Scores
When calculating a device risk score, IoT Security considers other risk factors beyond vulnerabilities and alerts. Other risk factors can be broadly applicable, such as the status of an operating system, or they might be specific to an IoT Security vertical, such as MDS2 factors that apply only in healthcare settings. While IoT Security allows only system-defined other risk factors, you can customize the risk score to adjust how much these factors affect device risk scores.
You can view and manage the risk scores of other risk factors in the Other Risk Factors section on SettingsRisk Score Configuration . The table displays the Category , Name , Description , and Risk Score for each factor. Hover over a field to see the full value displayed. To change a risk score, select the Edit (pencil) icon next to the risk score for the risk factor you want to modify. You can also remove all risk score customizations by selecting Reset to Default .
- Navigate to SettingsRisk Score Configuration and scroll down to the Other Risk Factors section.
- Select the Edit (pencil) icon next to the risk score of the risk factor you want to modify.
- In the Edit Other Risk Factors Risk Score pop-up, enter the new risk score you want to assign to that risk factor.
- Confirm the new risk score and verify that the Other Risk Factors section displays the updated risk score.
Customize How Asset Criticality Affects Risk Scores
A device's asset criticality affects the amplification of the overall device risk score. The higher the asset criticality level, the more IoT Security amplifies the device risk score. You can change a device’s asset criticality level to adjust the risk score for individual devices. To change how much an asset criticality affects all devices across your network, you can customize the impact factor for each asset criticality level.
You can view and manage the impact factor of asset criticality levels in the Impact Factor section on SettingsRisk Score Configuration . The section displays the impact factor, as a percentage, assigned to each asset criticality level. To change an impact factor, select the Edit (pencil) icon next to the impact factor for the asset criticality level you want to modify. You can also remove all impact factor customizations by selecting Reset to Default .
Only users with an Owner role can adjust the risk score for security alert severity levels.
- Navigate to SettingsRisk Score Configuration and scroll down to the Impact Factor section.
- Select the Edit (pencil) icon next to the impact factor of the asset criticality level you want to modify.
- In the Edit Asset Criticality Impact Factor pop-up, enter the new impact factor you want to assign to the asset criticality level.
Impact factors must be a number from 0 to 100. When choosing an impact factor, you can’t exceed the impact factor of a higher asset criticality level. Nor can you choose an impact factor that’s less than the impact factor of a lower asset criticality level.
- Confirm the new impact factor and verify that the Impact Factor section displays the updated impact factor.
Create Compensating Controls
|
Where Can I Use This? |
What Do I Need? |
|
|
Add compensating controls when you’ve taken steps to mitigate risk for your assets. Compensating controls can include factors such as Active Directory join status or endpoint protection. Configuring compensating controls adjusts device risk scores by reducing the risk score of a vulnerability or risk factor to more accurately represent the potential security risk of devices in your network.
IoT Security provides some system-default compensating control types, which you can adjust and apply to devices in your network. You can also create your own compensating control types to account for additional mitigations.
View and manage compensating controls from SettingsRisk Score Configuration or from the Device Details page. On the Risk Score Configuration page, you can create new compensating control types, configure new compensating controls, and edit existing compensating controls. On the Device Details page, you can create new compensating controls for the device, view all compensating controls for the device, and adjust the compensating control factor for existing compensating controls.
Under SettingsRisk Score Configuration , you can view, add, and edit compensating controls from the compensating control section. Select the Compensating Control Type tab to view all configured compensating controls and edit user-defined ones. Switch to the Compensating Control Matching tab to see where a compensating control matches to devices and risk (vulnerability or other risk factor), and to customize the compensating control factor for each matching criteria.
Define a compensating control type when you want to create a broad category for related compensating controls. While compensating control types have a matching rule, you don't directly apply the compensating control type to all devices that match the rule. You need to create a compensating control with that compensating control type to apply the compensating control to matching devices. More commonly, you would narrow the scope of devices that the compensating control applies to by defining an asset scope.
For example, a system-defined compensating control type is Endpoint Security, and the matching rule is that a device protected with endpoint protection can have a compensating control with type Endpoint Security. There can be multiple compensating control asset scopes that use the Endpoint Security type. You can only create new compensating control types from the Risk Score Configuration page.
- Navigate to SettingsRisk Score Configuration and select the Compensating Control Type tab from the compensating controls section.
- Click Add Compensating Control Type to bring up the Add Compensating Control Type pop-up.
- Configure the following fields.
- Type : Enter the type of compensating control.
- Matching Rule : Choose the attributes, operators, and attribute values that identify the compensating control type.
- Apply the new compensating control type.
- Verify that the new compensating control type appears in the Compensating Control Type table.
You can now use this compensating control type when applying compensating controls to assets.
You can create a new compensating control to apply to multiple matching assets. When defining a new compensating control, you can choose a system-defined type or a user-defined type. After choosing the type of compensating control, you match that type to a specific asset scope and risk (vulnerability or other risk factor).
For example, you can define an Endpoint Protection compensating control for all devices with internet access. The asset scope for the compensating control would be all assets that have the risk of internet access. Because the compensating control type is Endpoint Protection, the matching criteria would only apply to those assets with internet access that also have endpoint protection. For all assets in scope that match the matching criteria, the compensating control offsets the risk caused by internet access. The compensating control does not offset other risks that those devices might be exposed to.
- Navigate to SettingsRisk Score Configuration , and select the Compensating Control Matching tab from the compensating controls section.
- Click Apply Compensating Control to bring up the Add Compensating Control pop-up.
- Configure the compensating control.
When you add or edit a compensating control, the Matching Rule field automatically fills in based on the compensating control type that matches the risk that you chose to add the compensating control to.
- Type : Select the compensating control type. The selected type will also populate the Matching Rule field.
- Name : Enter a name for the compensating control.
- Optional Description : Enter a short description.
- Define the assets and risks the compensating control applies to.
1. Configure the following fields:
- Asset Scope : Enter the criteria for all assets that you want to apply the compensating control to.
- Risk : Select the risk that the compensating control applies to. You can select either Vulnerability or Other Risk Criteria .
- Vulnerability Vulnerability Risk Criteria : Define the risk criteria that the compensating control applies to.
- Other Risk Factors Other Risk Criteria : Select the appropriate risk criteria from the drop-down list.
2. View Matching Devices to verify the devices included in the asset scope.
The Match Results section displays the count of all devices that match to the defined asset scope. You can click on the count to open the assets inventory in a new tab or window, with a filter to see all devices that match your asset scope.
- Enter a Compensating Control Factor , which is how much the compensating control offsets the risk.
- Apply the compensating control.
Compensating controls can take up to 24 hours to take effect, so you might not see an immediate change in the device’s risk score.
- Verify that your new compensating control appears in the Compensating Control Matching table.
On the Device Details page, you can add compensating controls when viewing the device's risk score. For existing compensating controls, you can adjust the compensating control factor from the Device Details page. To make other changes to an existing compensating control, edit the compensating control under SettingsRisk Score Configuration .
- Navigate to AssetsDevices and select the device that you want to add a compensating control for.
- On the Device Details page, find the device's risk score under the device's thumbnail, and click See Details .
This brings up the Risk Score Details side panel for the device.
- In the Exposure Score table, review the list of identified risks, and see which risks you can apply a compensating control for.
Compensating controls apply only to vulnerabilities and other risk factors. When you can add a compensating control, you will see an Edit (pencil) icon in the Compensating Control Name field for that risk.
- Select the Edit (pencil) icon in the Compensating Control Name field for the risk that you want to apply a compensating control to.
- On the Risk Score DetailsEdit Compensating Controls pop-up page, select + Add New to bring up the Add Compensating Control pop-up.
- Configure the compensating control.
When you add or edit a compensating control, the Matching Rule field automatically fills in based on the compensating control type that matches the risk that you chose to add the compensating control to.
- Type : Select the compensating control type. The selected type will also populate the Matching Rule field.
- Name : Enter a name for the compensating control.
- Optional Description : Enter a short description.
- Define the assets and risks the compensating control applies to.
1. Configure the following fields:
- Asset Scope : Enter the criteria for all assets that you want to apply the compensating control to. By default, the MAC address of the device you're modifying is part of the Asset Scope.
The current device must always be within the asset scope, since you're applying the compensating control to the device. If you change the asset scope and it no longer includes the current device, then you won't be able to apply the compensating control.
- Risk : Select the risk that the compensating control applies to. You can select either Vulnerability or Other Risk Criteria .
- Vulnerability Vulnerability Risk Criteria : Define the risk criteria that the compensating control applies to.
- Other Risk Factors Other Risk Criteria : Select the appropriate risk criteria from the drop-down list.
2. View Matching Devices to verify that the current device falls in the asset scope.
The Match Results section displays the count of all devices that match to the defined asset scope. You can click on the count to open the assets inventory in a new tab or window, with a filter to see all devices that match your asset scope.
- Enter a Compensating Control Factor , which is how much the compensating control offsets the risk.
- Apply the compensating control.
Compensating controls can take up to 24 hours to take effect, so you might not see an immediate change in the device’s risk score.
- Verify that your new compensating control appears in the Compensating Control Name field for the risk that you added it to.
Risk Score Configuration
Under SettingsRisk Score Configuration , you can view, add, and edit compensating controls from the compensating control section. Select the Compensating Control Type tab to view all configured compensating controls and edit user-defined ones. Switch to the Compensating Control Matching tab to see where a compensating control matches to devices and risk (vulnerability or other risk factor), and to customize the compensating control factor for each matching criteria.
Create a New Compensating Control Type
Define a compensating control type when you want to create a broad category for related compensating controls. While compensating control types have a matching rule, you don't directly apply the compensating control type to all devices that match the rule. You need to create a compensating control with that compensating control type to apply the compensating control to matching devices. More commonly, you would narrow the scope of devices that the compensating control applies to by defining an asset scope.
For example, a system-defined compensating control type is Endpoint Security, and the matching rule is that a device protected with endpoint protection can have a compensating control with type Endpoint Security. There can be multiple compensating control asset scopes that use the Endpoint Security type. You can only create new compensating control types from the Risk Score Configuration page.
- Navigate to SettingsRisk Score Configuration and select the Compensating Control Type tab from the compensating controls section.
- Click Add Compensating Control Type to bring up the Add Compensating Control Type pop-up.
- Configure the following fields.
- Type : Enter the type of compensating control.
- Matching Rule : Choose the attributes, operators, and attribute values that identify the compensating control type.
- Apply the new compensating control type.
- Verify that the new compensating control type appears in the Compensating Control Type table.
You can now use this compensating control type when applying compensating controls to assets.
Apply a New Compensating Control
You can create a new compensating control to apply to multiple matching assets. When defining a new compensating control, you can choose a system-defined type or a user-defined type. After choosing the type of compensating control, you match that type to a specific asset scope and risk (vulnerability or other risk factor).
For example, you can define an Endpoint Protection compensating control for all devices with internet access. The asset scope for the compensating control would be all assets that have the risk of internet access. Because the compensating control type is Endpoint Protection, the matching criteria would only apply to those assets with internet access that also have endpoint protection. For all assets in scope that match the matching criteria, the compensating control offsets the risk caused by internet access. The compensating control does not offset other risks that those devices might be exposed to.
- Navigate to SettingsRisk Score Configuration , and select the Compensating Control Matching tab from the compensating controls section.
- Click Apply Compensating Control to bring up the Add Compensating Control pop-up.
- Configure the compensating control.
When you add or edit a compensating control, the Matching Rule field automatically fills in based on the compensating control type that matches the risk that you chose to add the compensating control to.
- Type : Select the compensating control type. The selected type will also populate the Matching Rule field.
- Name : Enter a name for the compensating control.
- Optional Description : Enter a short description.
- Define the assets and risks the compensating control applies to.
1. Configure the following fields:
- Asset Scope : Enter the criteria for all assets that you want to apply the compensating control to.
- Risk : Select the risk that the compensating control applies to. You can select either Vulnerability or Other Risk Criteria .
- Vulnerability Vulnerability Risk Criteria : Define the risk criteria that the compensating control applies to.
- Other Risk Factors Other Risk Criteria : Select the appropriate risk criteria from the drop-down list.
2. View Matching Devices to verify the devices included in the asset scope.
The Match Results section displays the count of all devices that match to the defined asset scope. You can click on the count to open the assets inventory in a new tab or window, with a filter to see all devices that match your asset scope.
- Enter a Compensating Control Factor , which is how much the compensating control offsets the risk.
- Apply the compensating control.
Compensating controls can take up to 24 hours to take effect, so you might not see an immediate change in the device’s risk score.
- Verify that your new compensating control appears in the Compensating Control Matching table.
Device Details
On the Device Details page, you can add compensating controls when viewing the device's risk score. For existing compensating controls, you can adjust the compensating control factor from the Device Details page. To make other changes to an existing compensating control, edit the compensating control under SettingsRisk Score Configuration .
- Navigate to AssetsDevices and select the device that you want to add a compensating control for.
- On the Device Details page, find the device's risk score under the device's thumbnail, and click See Details .
This brings up the Risk Score Details side panel for the device.
- In the Exposure Score table, review the list of identified risks, and see which risks you can apply a compensating control for.
Compensating controls apply only to vulnerabilities and other risk factors. When you can add a compensating control, you will see an Edit (pencil) icon in the Compensating Control Name field for that risk.
- Select the Edit (pencil) icon in the Compensating Control Name field for the risk that you want to apply a compensating control to.
- On the Risk Score DetailsEdit Compensating Controls pop-up page, select + Add New to bring up the Add Compensating Control pop-up.
- Configure the compensating control.
When you add or edit a compensating control, the Matching Rule field automatically fills in based on the compensating control type that matches the risk that you chose to add the compensating control to.
- Type : Select the compensating control type. The selected type will also populate the Matching Rule field.
- Name : Enter a name for the compensating control.
- Optional Description : Enter a short description.
- Define the assets and risks the compensating control applies to.
1. Configure the following fields:
- Asset Scope : Enter the criteria for all assets that you want to apply the compensating control to. By default, the MAC address of the device you're modifying is part of the Asset Scope.
The current device must always be within the asset scope, since you're applying the compensating control to the device. If you change the asset scope and it no longer includes the current device, then you won't be able to apply the compensating control.
- Risk : Select the risk that the compensating control applies to. You can select either Vulnerability or Other Risk Criteria .
- Vulnerability Vulnerability Risk Criteria : Define the risk criteria that the compensating control applies to.
- Other Risk Factors Other Risk Criteria : Select the appropriate risk criteria from the drop-down list.
2. View Matching Devices to verify that the current device falls in the asset scope.
The Match Results section displays the count of all devices that match to the defined asset scope. You can click on the count to open the assets inventory in a new tab or window, with a filter to see all devices that match your asset scope.
- Enter a Compensating Control Factor , which is how much the compensating control offsets the risk.
- Apply the compensating control.
Compensating controls can take up to 24 hours to take effect, so you might not see an immediate change in the device’s risk score.
- Verify that your new compensating control appears in the Compensating Control Name field for the risk that you added it to.
Security Alert Overview
|
Where Can I Use This? |
What Do I Need? |
|
|
All security alerts that IoT Security generates are based on one of these mechanisms:
- Machine-learning algorithms that automatically learn normal device behavior and can, therefore, detect abnormal behavior.
- Detection of specific traffic patterns—without the use of machine-learning algorithms. For example, IoT Security generates alerts if devices connect to websites that site-reputation services have associated with malware.
- User-defined Security alert rules specifying activity or a state that generates one or more configured actions—a Security alert, user notification, device quarantine. A few examples would be when a specific activity is observed, or when it’s not observed, or when a device or group of devices goes offline for two hours. (This period of time isn't configurable.)
- Threats on an IoT device detected by a Palo Alto Networks next-generation firewall are reported to IoT Security in the threat log.
IoT Security examines network traffic in real time, analyzing communications from and to every device on the network. It generates alerts if it detects irregular behavior or activity matching a policy rule.
IoT Security generates alerts for IoT devices only. It does not provide alerts, vulnerability detection, policy recommendations, and network behavior analysis for IT devices. For IT devices, IoT Security provides device identification only.
The Alerts and Alert Details pages in the IoT Security portal provide an overview of all generated alerts and detailed information about individual alerts for analysis and follow-up. IoT Security retains security alerts up to a maximum of one year.
Security alerts pertain to device settings and network behavior that indicate possible security breaches:
- Unsecure device settings (example: devices using the default username and password)
- Suspicious behavior (example: excessive DNS lookup failures)
- Reconnaissance or exploits (examples: port sweeps and EternalBlue SMB exploit attempts)
The Security Alerts section ( AlertsSecurity Alerts ) consists of three pages:
- Alert Overview – This is a dashboard where you can see alerts that are most relevant to you, analyze risk on IoT devices and on your network, and observe and report alert trends.
- All Alerts – This page displays a table of alerts serially with customizable pagination, columns, and column order. You can filter the information in the table through a dialog box accessed by clicking the Filter icon (
![]()
).
- Suppression Rules – This page is a list of user-defined rules created to suppress the future detection of alerts. For information, see Act on Security Alerts .
Alert Overview
The Alert Overview page is a dashboard with four main sections designed to help you identify top priority alerts, analyze risk, and easily report on alert trends for IoT devices.
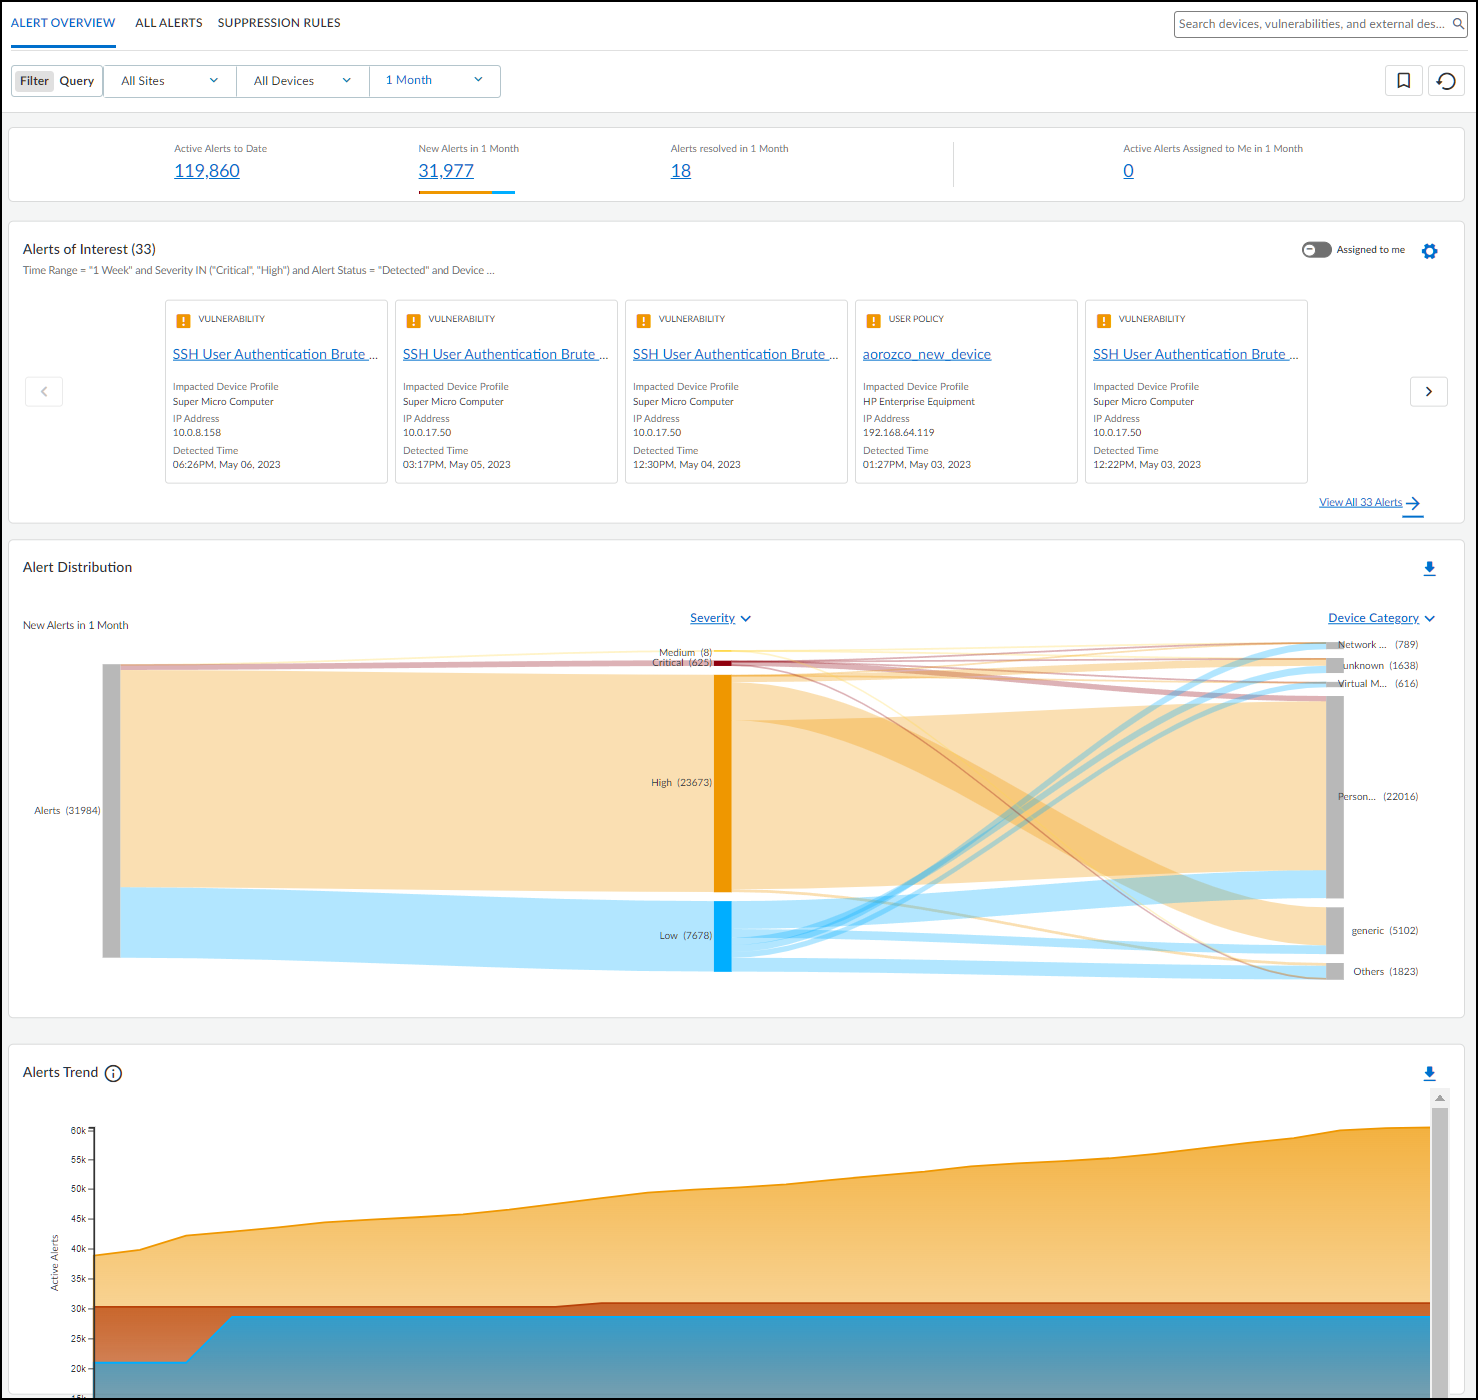
At the top of the page is an alert summary with information about the alerts matching the filters set for sites, device category, and time range.
- Active Alerts to Date – The is the total number of open alerts. An alert can be in one of four states: Detected, Investigating, Remediating, and Resolved. Any alert in one of the first three states—that is, any state except Resolved—is considered open, or active, and is included in this count.
IoT Security retains security alerts in its database up to one year. If you've been using IoT Security longer than that, keep in mind that this count will not include any alerts discovered more than a year ago.
- New Alerts in <time range> – This is the total of all open alerts that were detected within the time range specified in the data filter at the top of the page.
- Alerts resolved in <time range> – This is the total of all alerts that were resolved within the time range specified in the data filter at the top of the page.
- Active Alerts Assigned to Me in <time range> – This is the total of open alerts that were assigned to the person currently logged in during the time range specified in the data filter at the top of the page.
Alerts of Interest – Define criteria for alerts that matter most to you. IoT Security will then display the top ten alerts in response to your query with the more severe and newer alerts displayed first. For example, if you want to see alerts for a specific vendor or profile that were detected within the last week, click the gear icon (
![]()
) and configure a query to show the alerts that interest you. IoT Security then displays the ten most recent and most severe alerts that match your terms.
By default, IoT Security uses the predefined "Major Alerts" query to search for critical and high severity alerts detected in the past week for all IoT devices. You can edit this query to define other attributes of interest and then click the bookmark icon (
![]()
) to save it for reuse.
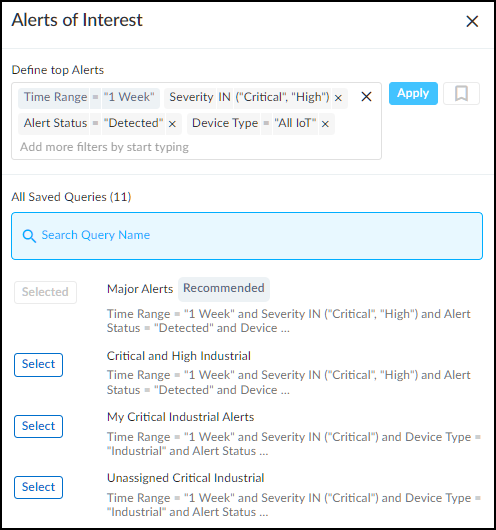
You can also toggle on Assigned to me so that IoT Security displays only alerts within the top ten that were assigned to you. If there are more than ten alerts, View All <number> Alerts to see the all the alerts that matched your criteria. IoT Security displays these on the All Alerts page. Click an alert name to open the Alert Details page for it.
Alert Distribution – The Sankey chart lets you see the distribution of active alerts across different groupings of devices. Reading the chart from left to right, you start off on the left with all the active alerts that match the site, device category, and time range filters at the top of the page. The chart then relates these alerts to a type of device grouping in the middle and relates these again to another type of grouping on the right. The choices for these groupings are Severity , Profile , Device Category , Vendor , Status , Device Type , and Alert Type . Alerts are distributed vertically in the chart by count with those groupings with the most alerts at the top of the chart. When there are more than five groupings, the Sankey chart shows the top five and then gathers everything else in an "Others" group. Hover your cursor over Others to see a list of the next ten groupings, and click View all to see a pop-up panel with a complete list.
For example, to see the ratio of critical, high, medium, and low alerts among different device categories, choose Severity for the middle post and Device Category for the right post. The colored bands between the left and middle posts show how many active alerts are critical, high, medium, and low, and the colored bands between the middle and right posts show how many alerts at each severity level were triggered by devices in different device categories. Each band is labeled and shows the total number of active alerts for its severity (on the left) and for that severity per device category (on the right). The width of the bands lets you see at a glance the relative quantities of alerts by their severity. Hovering your cursor over a section of a post shows the percent of alerts for the adjacent bands.
Colors only convey meaning to denote alert severity levels: red = critical, orange = high, yellow = medium, and blue = low. For other types of groupings, semi-transparent shades of gray are used solely to distinguish one band from another.
To download the data from the Sankey chart for your records or reports, click the download icon (
![]()
) in the upper right above the chart. IoT Security saves it as an .xlsx file with alert distribution information on the first sheet and a complete list of active alerts on the second.
Alert Trend – The Alert Trend chart displays a cumulative count of active alerts over the specified time period and a daily noncumulative count of resolved alerts. This visually shows alert trends to help SOC and management teams see if the number of active alerts has been increasing or decreasing over time. It also displays data for resolved alerts, which can help teams gauge their progress in regard to alert resolution. Hover your cursor over different points on the chart to see the number of critical, high, medium, low, and resolved alerts for different dates.
To download data from the Alert Trend chart for reports or records, click the download icon (
![]()
) in the upper right above the chart. IoT Security saves it as an .xlsx file with the active number of alerts to date and resolved alerts over the specified period of time.
All Alerts
The All Alerts page shows all alerts, or alert instances , organized by date up to the previous day, which is the last day for which IoT Security has a complete list of alerts. Define filters at the top of the page to control which alerts to display. There are filters for sites, device category, time range, and response status (active alerts, resolved, assigned, unassigned, detected, and all). You can add more filters as well.
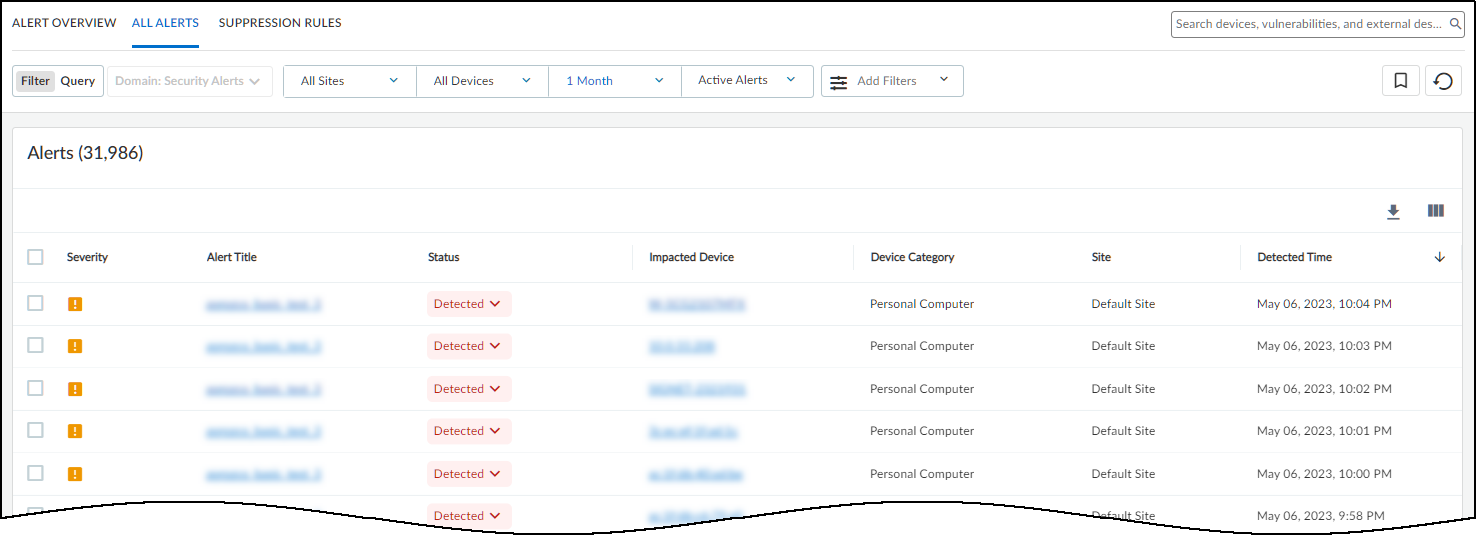
The status of an alert begins in the Detected state. You can leave it there or set it to a different state to reflect where it is in the remediation process:
- Detected : This is the state of a newly detected alert instance. It makes sense to keep it in this state if no action has been taken to investigate, remediate, or resolve it.
- Investigating : Consider setting an alert instance in this state after preliminary work on it has started and it’s being verified, researched, and its impact analyzed.
- Remediating : Consider setting an alert instance in this state while action is being taken to remediate it but has not yet completed.
- Resolved : An alert instance becomes resolved either by mitigating the issue or by ignoring and accepting it.
To change the state of an alert instance, click the entry in the Status column and choose another state. When you resolve it, IoT Security prompts you to provide a reason for its resolution.
To assign an alert instance to someone to work on, select the check box for the instance, and then click MoreAssign . Enter the username or email address of a user and then click Assign . The user then receives an email message that states that an alert was assigned to him or her and provides a link to it in the IoT Security portal for investigation.
The person to whom you assign an alert instance must have an IoT Security user account so that it can send a message to the appropriate email address.
IoT Security provides an option for copying the details of an alert instance and creating a work order for use with an asset management system. Select the check box for an instance, and then click MoreCopy Alert Information . Select the sections of the alert description that you want to include in the work order, add additional instructions or relevant information in the Information field, and then click Copy to copy the text in those sections.
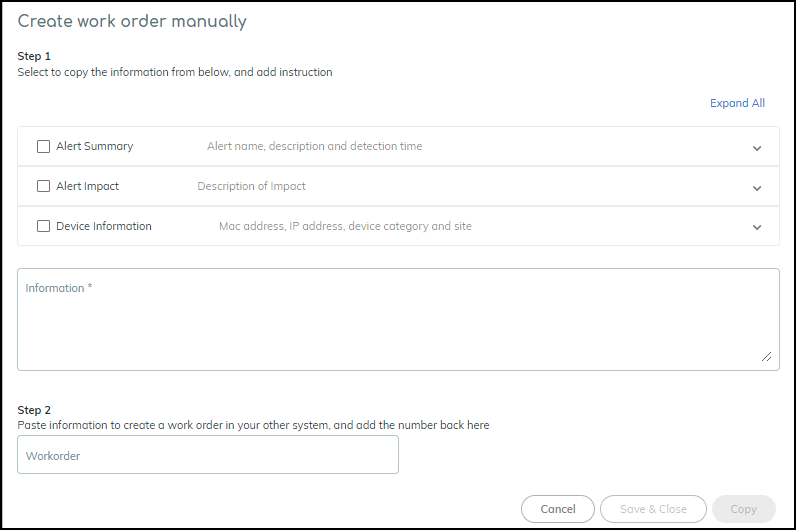
Paste the copied content into the description field in your asset management console as you manually create a work order there. You can then copy the work order number from the asset management console, paste it back in the Work order field in the Create work order manually dialog box in IoT Security, and then click Save & Close .
To add a note about an alert instance or the work being done on it, select the check box for the instance, and then click MoreAdd notes . Enter the note and then click Add .
To see previously added notes and any previous status changes that were made to an alert instance, click or hover your cursor over the entry in the Last Action column for it. An historical record about the response to the instance appears in a pop-up window.
You can set the number of rows you want to see on each page (from 5 to 200) and navigate among multiple pages.
Security Alert Details Page
Clicking the name of a security alert instance opens the Device Details page.
The Alert Details page is organized into three major sections. At the top is information about the incident itself. The client is always shown on the left, the server on the right, and a rightward pointing arrow between the two—solid if they formed a connection, dashed if a connection was only attempted. The protocol or protocols used in the connection—or attempted connection—are listed below the arrow. The device on which the alert was raised is shown inside a box color coded to match the severity of the alert. In this way, you can easily see device roles and where the alert occurred.
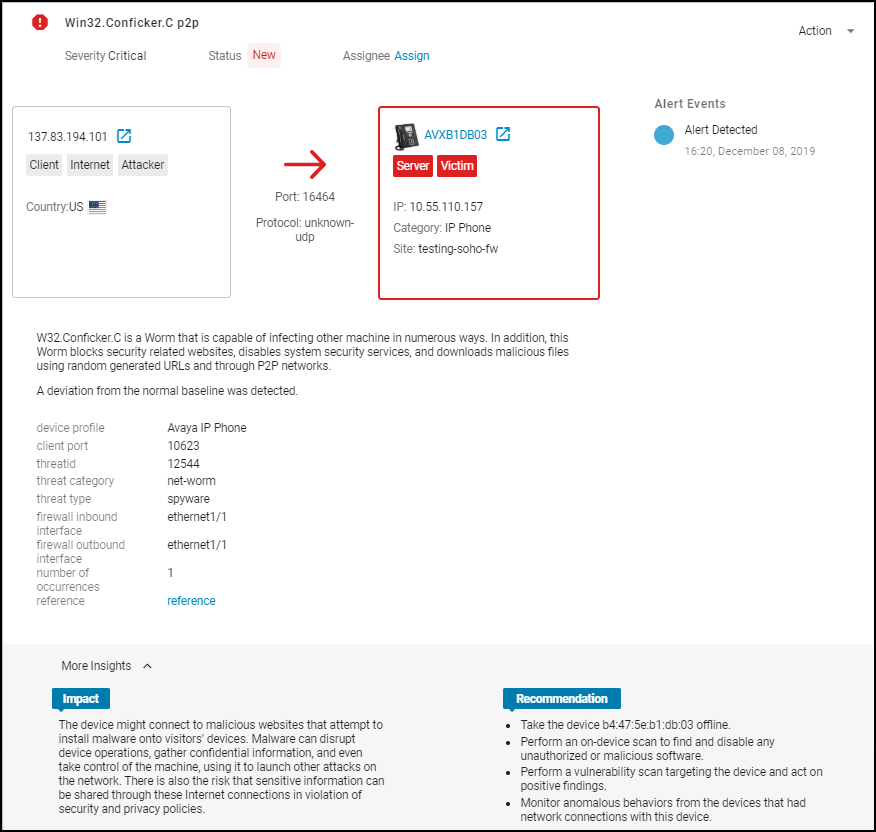
The client on the left formed a UDP connection with the Avaya IP phone in the server role on the right. The IP phone is the device that raised the alert.
The blue icon next to a device name (arrow pointing out of box) opens a new browser tab showing the Dynamic Topology Viewer with that device in focus (see IoT Security Device Details Page ). There you can see how many other devices it communicates with and what they are. This can be extremely useful when investigating a compromised device because it can reveal the location of remote devices participating in the attack and local devices that might be targets of further attacks launched from the victim.
The reference links to a Palo Alto Networks knowledge base article about the Conficker worm.
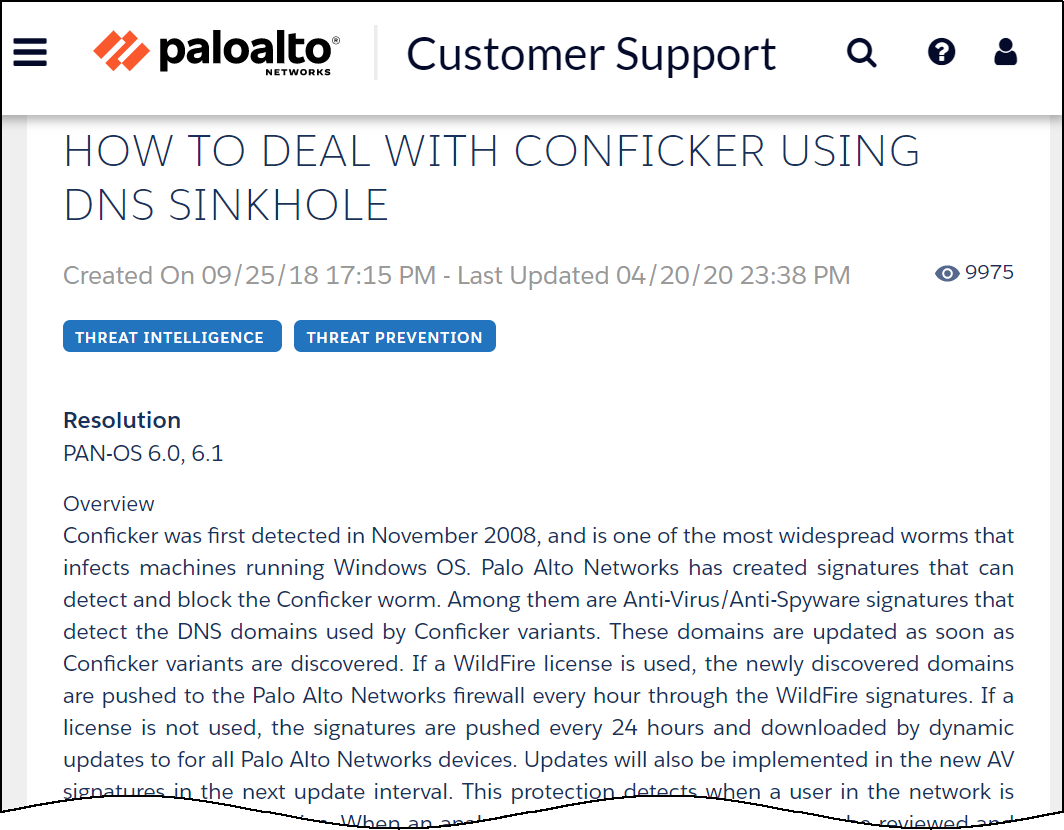
The Impact section explains how the issue might impact the security of a user, device, or network. (Not all alerts have an Impact section.) The Recommendation section lists options for addressing the issue.
The second major section on the Alert Details page examines the impacted device and summarizes its security status.
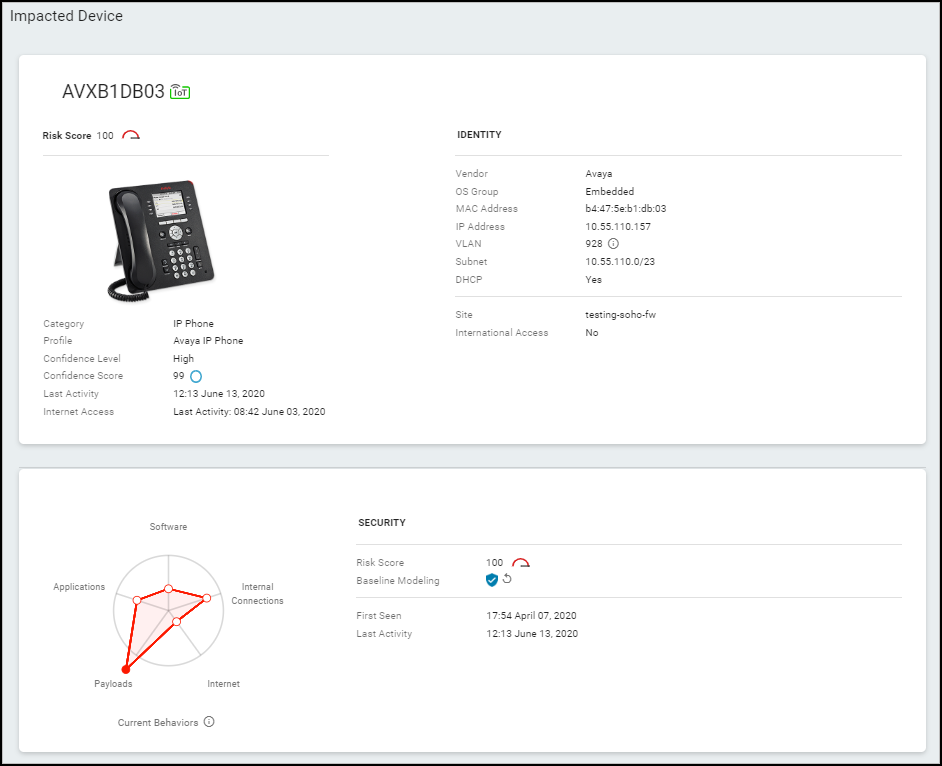
You can learn about the identity and activity of the impacted device, its physical location (site), and its logical location on the network. In the Current Behaviors diagram, hover your cursor over any of the five small red circles or the information icon to see more information. The Security section provides security-related information about the device.
The third major section on the Alert Details page shows a snapshot of the network traffic of the impacted device in a Sankey diagram. The diagram includes the IP addresses of other endpoints and the applications used in their communications. The lines indicate various network connections. The ones in red represent the connection involved in the high-severity alert.
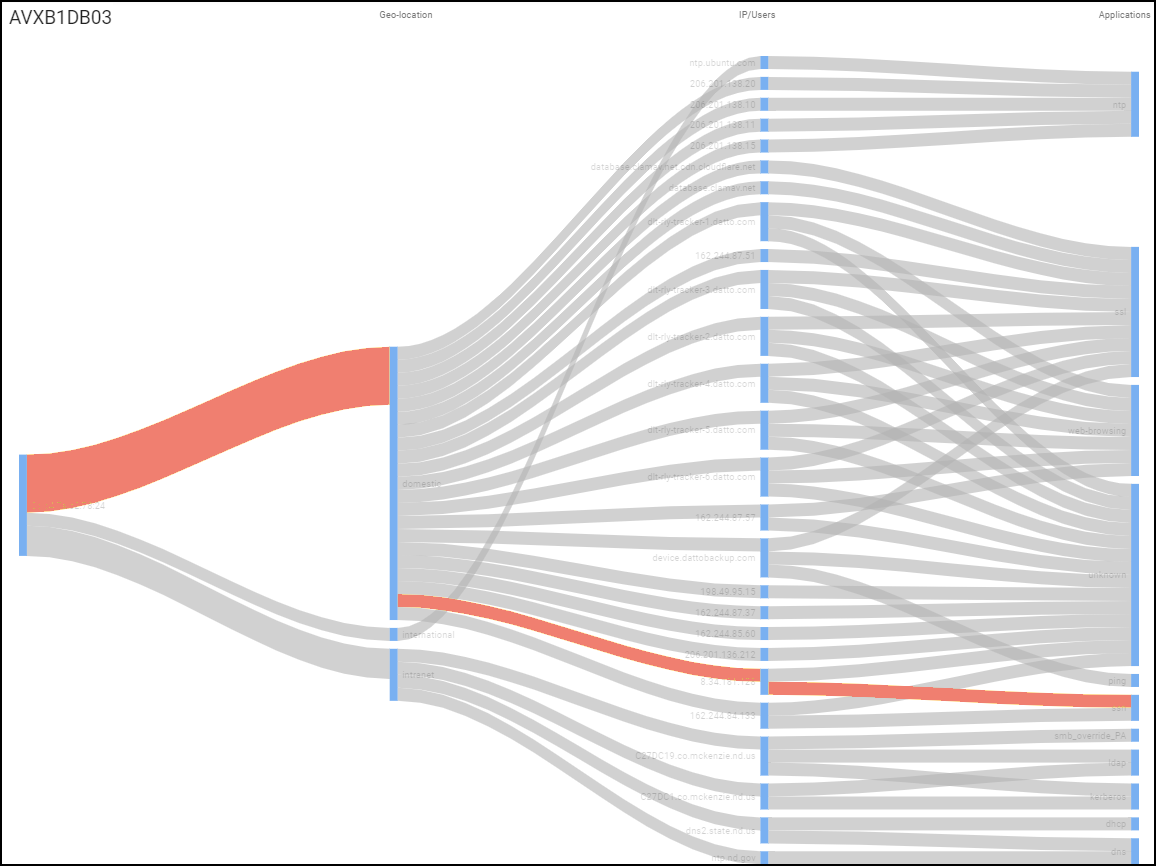
If a device has multiple alerts, all relevant lines are colored according to the severity of each one.
Create Alert Rules
|
Where Can I Use This? |
What Do I Need? |
|
|
IoT Security uses AI and machine-learning algorithms to automatically generate security alerts based on anomalous network behavior and to detect vulnerabilities when device attributes match those in published vulnerability databases such as those at nvd.nist.gov and www.cisa.gov as well as vulnerabilities added to the IoT Security database by its team of security experts. With these automatic detection mechanisms built into the system, IoT Security continuously monitors your network and can notify you of Security threats without any need for you to configure and enable rules or settings for it to do so. However, if you want to detect specific network events (like new device discoveries or a specific device using a specific application), you can define some conditions to identify these events and trigger security alerts and perform actions. To do this, you create custom rules and add them to the set of internal rules that are already in place.
A given rule defined in IoT Security can be triggered based on a single change event such as the discovery of a new device. It can also be triggered by a given traffic pattern such as a specific application command or an accumulation of traffic volume over a period of time. It can even be triggered by a combination of the two. A rule only triggers an action once per day per device to avoid generating excessive noise. To see how many times observed conditions matched a rule, view the Hit Counts column on the AlertsCustom Alert Rules page.
The following list shows several types of conditions you might define:
- One device communicates with another device
- A device appears on a specific VLAN or network segment, connects to a specific wireless access point or network switch, or shows up in a specific next-generation firewall zone
- The subnet or IP address of a device changes
- A risky device communicates with the Internet
- The risk level for a device changes
- A device transmits a certain volume of network traffic
- A device uses a particular application or uses something other than a particular application
- A device uses a particular application command or a specific value in a command
If detected, these conditions would trigger IoT Security to take one or more configured actions—generate an alert, notify users, quarantine the device involved.
Although the conditions above use the singular form “device” for simplicity, the rule conditions can also apply to multiple individual devices, one or more types of devices (device profiles), or one or more device groups (defined by user tags, Purdue level, or category).
The rules engine is at AlertsCustom Alert Rules and consists of three sections: Basic Information, Rules Details, and Rule Preview.
To help you get started using the rules engine, IoT Security provides a collection of example templates for common rules. Study these preconfigured rules to become familiar with rules engine capabilities, enable and use them as they are, or use them as models for building similar rules of your own.
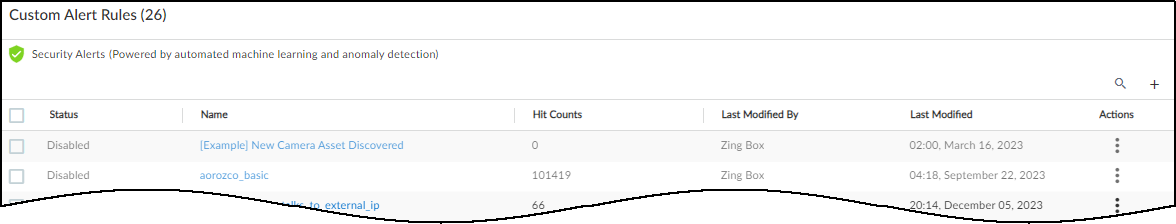
Predefined rules are disabled by default so that they don’t trigger unwanted alarms.
To see the preconfigured example rules, select AlertsCustom Alert Rules .
The preconfigured templates differ somewhat based on the vertical theme that’s active on your IoT Security portal. Each vertical theme has two or three example rule templates. Here’s an example for each theme:
Enterprise IoT Security Plus
- Rule Name: [Example] Suspicious Printer Communication
- Description: Raise a critical alert any time a printer communicates with any other endpoint using applications that aren’t on the allow list.
- Rule: WHEN category = “Printer”, application =! Dhcp, dns, dns-base, ldap, netbios-ns, ntp-base, smtp-base, snmp-base, snmpv1, ssl, ws-discovery ; DO Publish “Critical” alert
- Action: Raise a critical severity alert
Industrial IoT Security
- Rule Name: [Example] Industrial Device Offline
- Description: Raise a high alert when an industrial controller or remote terminal unit (RTU) is offline during business hours.
- Rule: WHEN category IN (“Industrial Controller”, “Industrial RTU”), Offline Device; DO Publish “High” alert
- Action: Raise a high severity alert
Medical IoT Security
- Rule Name: [Example] New Camera Asset Discovered
- Description: Raise a critical alert any time a new IP camera is detected on the network.
- Rule: WHEN: category = “Camera”, New Device Discovery; DO Publish Alert
- Action: Raise a critical severity alert
If you want to try a rule, enable it by opening the Rule Engine Editor and toggling the Status from Disabled to Active . You can edit, clone, and delete the example templates using the options in the Actions column on the AlertsCustom Alert Rules page.
- Identify your network concerns and what events you’d want IoT Security to watch for and notify you about.
- Create a rule to address your concern beginning with some basic information.
In the Basic Information section, enter a name and description for the rule and when you want it enforced.
- Rule Name : Enter a unique name for the rule.
- Description : (Optional) Enter a description of the rule, such as its overall intent, for future reference.
- Apply rule during : When days and times of day when you want IoT Security to enforce the rule. By default, a rule is enforced all the time; that is, all day everyday.
- Status : If you want IoT Security to monitor the rule conditions, toggle its status to Active . If you don’t want IoT Security to apply the rule, toggle its status to Disabled .
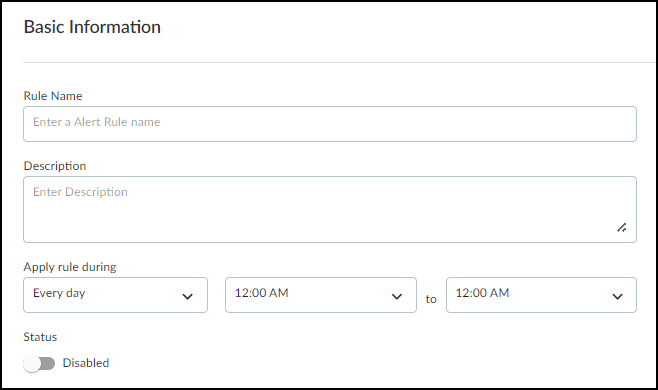
- Define criteria for the rule.
In the Rule Details section, define the criteria necessary to trigger an action that IoT Security will take.
- All(AND) or ANY(OR) : Choose All(AND) when you want all conditions to be met for IoT Security to perform a defined action. Choose ANY(OR) when you want any one of the conditions to trigger it.
- Add Condition : Choose Traffic Pattern to define a condition based on network traffic behavior. Choose Change Event to define a condition based on a change to a device, such as a device changing its IP address or going offline, or a new device coming onto the network.
If you choose Traffic Pattern, IoT Security displays two fields for target devices and extra criteria options for traffic volume and app usage.
- Add Target Devices : In the first target device field, identify the device or devices to which you want to apply the rule. You can do this by choosing up to 10 attributes. These can be the IP addresses and names of devices, the subnets and VLANs to which they belong, previously defined tags and custom attributes, device categories and profiles, the switches and wireless access points through which devices access the network, and traffic destinations (two-character codes for countries and territories defined in the ISO 3166-1 standard). You can specify if the target devices have a specific attribute ( = ) or not ( != ) or if they have any one of a set of attributes ( IN ) or not ( NOT IN ). Building the target device criteria works in a manner similar to the query builder.
- Target Devices (optional) : If you want to define a traffic pattern between two specific devices or types of devices, use the second target device field to identify the other end of communications. If you don’t enter anything here, it’s treated as “any destination” (this can be an internal device or an external web address).
- Show Extra Criteria : You can set extra conditions by selecting Traffic Volume and App Usage and setting parameters (one or both conditions can be selected).
The configuration of these settings requires insight into traffic flow volumes and knowledge of application settings and their appropriate values.
If you select Traffic Volume , then enter the volume of traffic and a time period in which it occurs as a condition to trigger a rule. You might want to use this option to watch for unexpected surges in traffic volume, especially to unusual destinations.
If you select App Usage and choose Application: is , you can then choose a single OT or IoT/IT application and enter whatever commands, parameters, and values must be present in network traffic to trigger an action. If you choose Application:not , you can choose a single application that must not be present to trigger an action. If you want to create a condition that applies to multiple applications, choose Application:in or Application:not in .
Additional selector fields for commands, parameters, and values are only available after choosing Application: is .
If you choose Change Event , IoT Security displays the same Target Devices field it does for Traffic Pattern plus an Event drop-down list. You can choose the following events to trigger an action:
- IP Change
- New Device Discovery
- New Vulnerability Discovery (includes both confirmed and potential instances)
- Offline Device
- Purdue Level Change (You must also select a Purdue level.)
- Risk Level Change (You must select Any or a specific risk level.)
- Subnet Change
Add Condition Set : Adding a condition set lets you create a subgroup of conditions with its own All(AND) or ANY(OR) operator. It’s useful for chaining multiple conditions under the main set of conditions.
For example, the following criteria has four conditions with the logic of Condition A AND Condition B AND { Condition C OR Condition D }. To apply an action, conditions A and B and either C or D must be met.
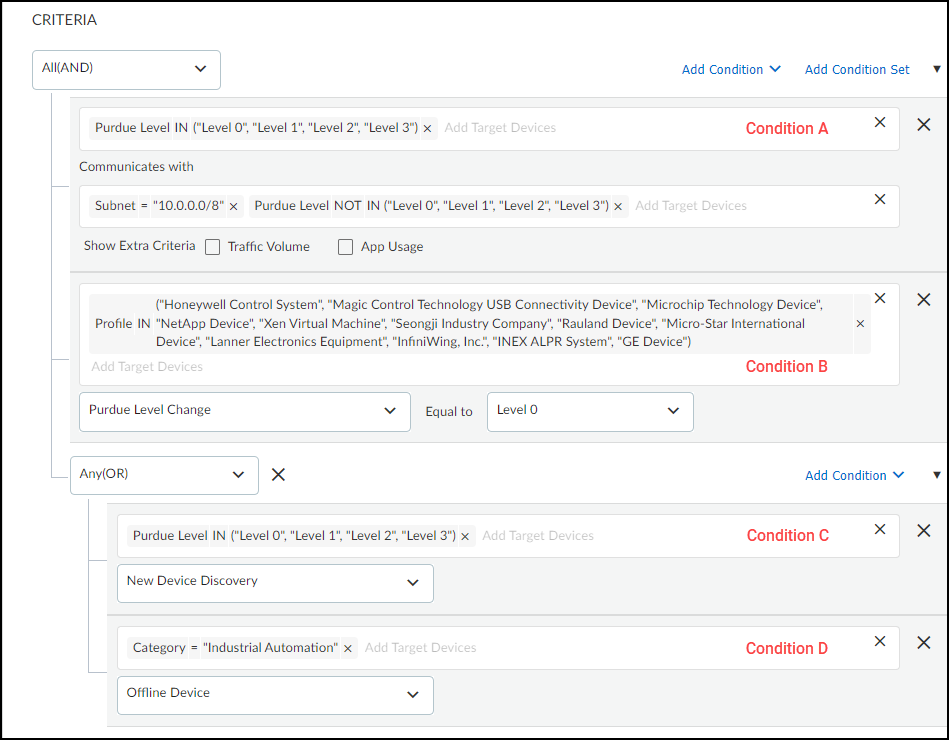
- Set the action that IoT Security takes when the defined criteria are met.
To avoid rules generating excessive noise, IoT Security only triggers the specified actions once per device per day. You can configure IoT Security to take up to three of the following actions:
Generate alert + additional actions ( Send to third-party systems and Assign to Users ) – When rule conditions are met, IoT Security generates a Security alert and displays them on the Alerts > Security Alerts page. In addition, IoT Security can automatically push the alert to third-party systems triggering additional actions by the third-party system such as initiating a NAC quarantine or triggering a work order for example. It can also assign an alert to one or more users to investigate for remediation.
Notify users – Set IoT Security to notify multiple users by email or to notify you yourself by SMS text. (To receive text notifications, you must enter your mobile phone number and enable text notifications in user-name > Preferences .)
Restrict network access – Inform a Palo Alto Networks Next-Generation Firewall to restrict network access to the device whose behavior matches the conditions necessary to trigger the action.
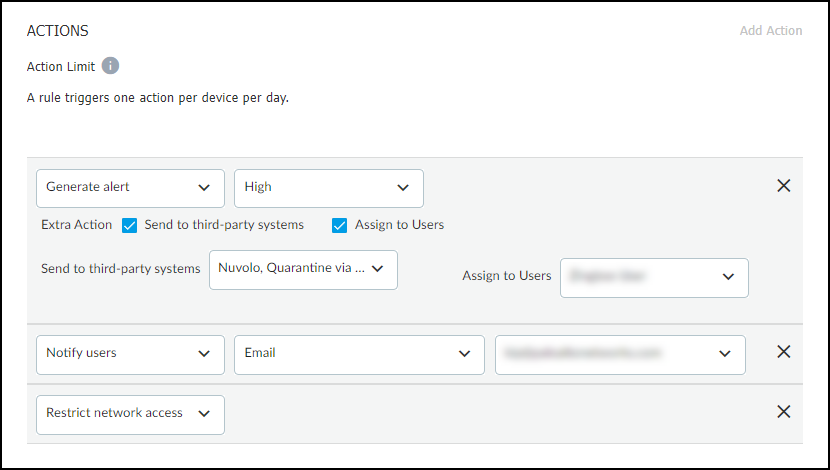
- Check settings in the Rule Preview.
Review the rule displayed in a readable SQL-like format. This is a high-level snapshot of the Criteria and Action sections that lets you check the logical relationships of settings within the rule. Any later changes to settings in these sections will update the rule preview.
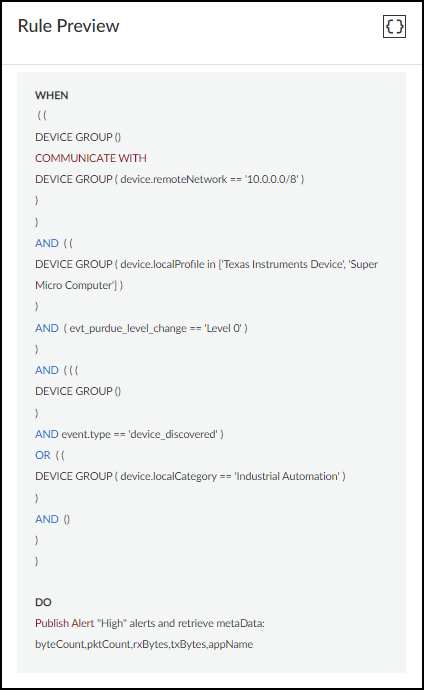
Learn about Security Alerts
|
Where Can I Use This? |
What Do I Need? |
|
|
There are several ways to learn about security alerts. IoT Security can automatically notify you by text and email, depending on the methods you enable in your account preferences. Even if you don’t have alert notifications enabled, you might still be notified when another user assigns you an alert for investigation.
You can also learn of alerts in the IoT Security portal itself by checking the Alerts section on the Security Dashboard, hovering over device names on the Devices page, and by viewing the Security Alerts page.
A way to learn about alerts in the IoT Security portal is in the Alerts section on the Security Dashboard. You can organize the alerts on display by severity (low, medium, high, critical), status (detected, investigating, remediating, resolved), device category (for example: audio streaming, IT server, point-of-sale system), or alert type (for example: security risk, unsecure protocol, user policy). When viewing by severity, the numbers in the Alerts column are clickable. Clicking one of them opens the AlertsSecurity AlertsAll Alerts page with a filter applied to show only the alerts matching the item you clicked.
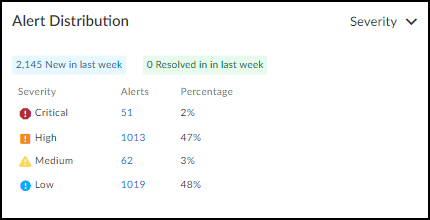
When you hover your cursor over a device name on the Devices page, the IoT Security portal displays a pop-up panel with information about the device, including a list of alerts if there are any. Clicking one of the alert names opens the Alert Details page for it.
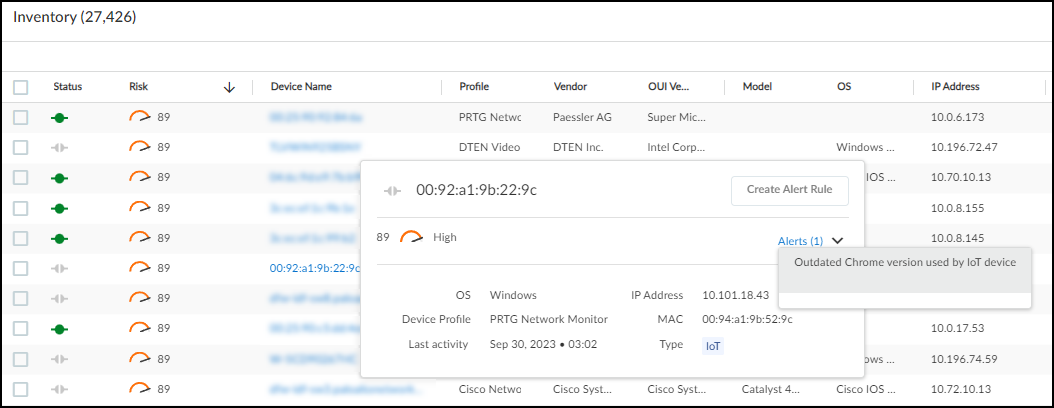
Click the name of an alert to open the Alert Details page in a new browser window.
Security Alert and System Alert Notification
In addition to viewing security alerts in the IoT Security portal or being notified to investigate an alert, IoT Security also sends email and text notifications automatically when events trigger them. It does this for two types of alerts:
- Security Alerts – These alerts pertain to the devices IoT Security is monitoring and are triggered by behavioral changes that indicate a potential attack. Here's an example of a security alert notification:
- Palo Alto Networks IoT Policy Alert for Super Micro Computer device: (Warning) SSH User
- Authentication Brute Force. This event indicates a brute force attack through multiple
login attempts to an SSH server.
- System Alerts – These alerts pertain to next-generation firewalls. Currently only an outdated application content package triggers a system alert notification.
IoT Security sends these notifications after a user with owner privileges enables them to be sent to all owners (enabled by default) or adds users to a list for notification on AdministrationNotification Management .
The owner can add existing admin users by choosing them from a drop-down list that appears. These users receive notifications by email or text or both depending on their user preferences. The owner can also type in the individual email addresses or distribution lists of users whose email addresses share the same domain of one of the owners. (IoT Security rejects any address with a domain that's not shared by an owner.) These users receive notifications by email. If an owner disables Send to all the owners , then only those in the email lists will receive notifications.
Act on Security Alerts
Routine Security Alert Management
|
Where Can I Use This? |
What Do I Need? |
|
|
After you learn about a security alert, one of the first steps is to read the details and confirm that the event that triggered it actually occurred, possibly by checking firewall event log entries. After confirming the alert, you must quickly assess its importance and urgency, identify the type of equipment impacted, and then decide how to respond and with whom to engage. The responder might be IT security, clinical engineering, a third-party network security service provider, or perhaps the device vendor or manufacturer. Find the responsible party and contact them about the alert.
Take Action when a Security Alert Occurs
There are numerous ways to respond to a security alert. The action you take depends of the remediation requirements of the situation:
- If a device was infected by malware or a virus, unplug the device immediately. If its continued use is essential, work with IT security to quarantine it from the rest of the network. You might need to modify firewall security policies to permit only traffic absolutely required for the device to function and block everything else while you work on a resolution.
- The resolution might require a software patch, and sometimes you might have to get the equipment vendor involved to patch it. If you must continue using the equipment, enforce a strong zero-trust policy until the patch is available.
- If an alert is generated by a security policy violation, you can send policy recommendations to the firewall so it only permits traffic resulting from normal device behavior.
- To assist in your analysis, IoT Security provides alert log files (in .csv and .log formats), which contain several days’ worth of network connections involving the device that triggered an alert. You can also download the network traffic data that IoT Security shows as a Sankey diagram and view it as an .xls spreadsheet.
Assign and Track Security Alerts
From the Alerts and Alert Details pages, you can assign a security alert to one or more people for investigation. When you select an alert on AlertsSecurity AlertsAll Alerts , a set of actions appears at the top of the alerts table.
To assign an alert to someone to investigate, click MoreAssign . Enter an email address and comment and then Assign .
If you assign an alert to an external user—that is, someone who doesn’t have a Palo Alto Networks user account and can’t log in to the IoT Security Portal—a PDF with alert details will be attached to the email.
You can also assign an alert occurrence to someone from the Alert Details page ( AlertsSecurity AlertsAll Alerts alert_title ) by clicking ActionAssign .
You can also add notes to an alert, which is a convenient way for you and your team to track the progress of investigations of high-level alerts. From the Alerts page, select an alert and then click MoreAdd notes . From the Alert Details page, click ActionAdd Notes . The notes appear in the Alert Events list on the Alert Details page.
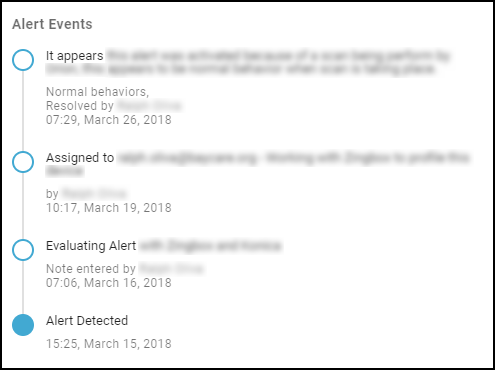
Resolve and Reactivate Security Alerts
If you consider an alert acceptable, or if you address an alert, you may choose to resolve the alert. An alert may be acceptable if it has a low severity level, or the alert may be addressed if you assign it to a network security administrator to investigate and fix. In either case, resolving an alert means you no longer consider the alert a security risk. The alert disappears from devices' risk score details, thereby reducing the device risk scores.
While you can resolve individual security alert occurrences, you can also resolve security alert groups. Select the check box next to the alert group names and then click Resolve at the top of the Alerts list.
After clicking Resolve , the Resolve Alert dialog box appears. Select the reason for resolving the security alert. If you choose No Action Needed , you can select one or more of the pre-defined reasons. If you select any of pre-defined reasons for why no action is needed, those reasons will appear in the Alert Events history description, but they do not impact your deployment. To finish resolving the alert, enter a comment to include in the Alert Events history, and then Resolve .
The Resolve tool is useful for showing how many alerts got resolved in weekly or monthly reports. The Alert Overview page also displays the number of resolved alerts and the alerts trend based on your time filter. You can view resolved alerts in the Alerts list by filtering for Resolved alerts.
To reactivate one or more alerts that were previously resolved, set the filter above the Alerts list to Resolved , select the alerts, and then click Unresolve . In the Change Status dialog box, enter a comment and then click Change .
When you reactivate an alert, the alert reappears in devices' risk score details. A reactived alert can increase a device's risk score.
Suppress Security Alerts
If IoT Security raises a security alert for an expected event, you can suppress future occurrences of the alert so no further resources need be expended on them. You can suppress future alert detections for just the device on which the alert was triggered or for all devices sharing the same device profile, category, or device type. You can suppress the alert indefinitely or for a limited length of time. In addition to suppressing future alert detections, you can also mark the current alert event as resolved.
To suppress an alert, log in to IoT Security as a user with administrator or owner privileges and select AlertsSecurity AlertsAll Alerts . Select the alert that you want to suppress and then click MoreSuppress Alerts .
You can select multiple alert instances if they are the same type of alert (with the same alert name). When different alert types are selected, the Suppress option becomes unavailable.
To suppress all future alert detections for the device or devices on which the alert was triggered, add a comment, leave Resolve this alert selected, and then click Save .
To suppress future alert detections on additional devices as well as this particular device, expand Suppression Rule , choose one or more attributes in one or more of the Tag, Category, Profile, and Device Type fields, set the length of alert suppression, add a comment, and then click Save . Cortex XSOAR will suppress future alerts occurring on devices matching any of the chosen attributes for the length of time specified.
After you create a suppression rule, it takes IoT Security approximately 30 minutes to apply it throughout the system to all the devices in your inventory. IoT Security also adds it to the rule table at AlertsSecurity AlertsSuppression Rules .
Clicking a rule name opens the Suppress Alert configuration panel where you can view and edit details. The Status column indicates two states. A rule is "In process" during the initial 30-minute application period after it’s been created or modified. After that, the status changes to "Success" indicating that IoT Security has applied the rule to all the targeted devices in its inventory.
After you create a rule, you can always modify it to include additional devices by modifying the rule to encompass a wider range of devices. In fact, IoT Security prompts you to do this whenever you are about to suppress an alert on a device and there’s already a suppression rule for this type of alert but it just doesn’t apply to this particular device. It displays an information icon, which expands into a pop-up message when you hover your cursor over it.
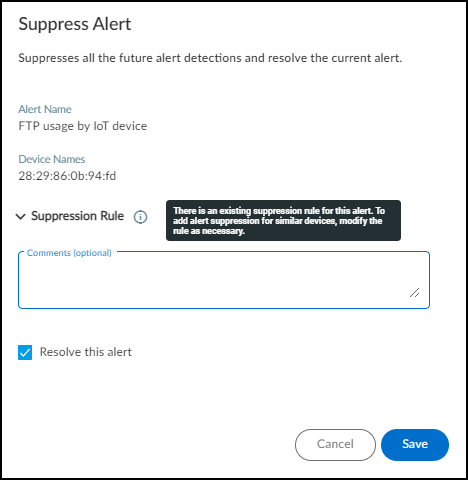
To add just this device to the existing rule, optionally add a comment and leave Resolve this alert selected, and then click Save . To apply the suppression rule to this device and others like it, expand View targeted devices , modify the original rule to include the profile, category, or device type that would make it apply to this and similar devices, and then click Save .
To stop alert suppression, log in to IoT Security as a user with administrator or owner privileges and select AlertsSecurity AlertsSuppression Rules . Select one or more rows in the table and then click Release Suppression .
Because vulnerability scanners generate traffic that triggers lots of alerts, you most likely want to suppress alerts for them. If you have an IoT Security Third-party Integrations Add-on license or a full-featured Cortex XSOAR server, you might have integrated IoT Security through Cortex XSOAR with Qualys, Rapid7, or Tenable vulnerability scanners. If so, IoT Security automatically imports the names and IP addresses of all scan engines, and the names of all sites and vulnerability scan templates from the integrated product and adds them to the list of scanners on SettingsScanners . The Source column indicates that a scanner was automatically imported by displaying the integration product name: Qualys , Rapid7 , or Tenable . If you don't want to automatically import this information to the scanners list, disable Automatically Synchronize Scanners with IoT Security in one of the following Cortex XSOAR jobs, depending on which integration you're using: PANW IoT Get Qualys Scanners and Profiles, PANW IoT Get Rapid7 Scanners and Profiles, or PANW IoT Get Tenable Scanners and Profiles. Disabling this setting doesn't automatically remove previously imported scanners from the list in the IoT Security portal. You must remove them manually by selecting them in the list, clicking Remove from Scanner List , and then clicking Continue at the prompt.
If you want to suppress alerts triggered by vulnerability scanners that are on your network but not integrated with IoT Security, create a list of scanner IP addresses and upload it to IoT Security. Click SettingsScanners , click Add Scanners , and then download a CSV template.
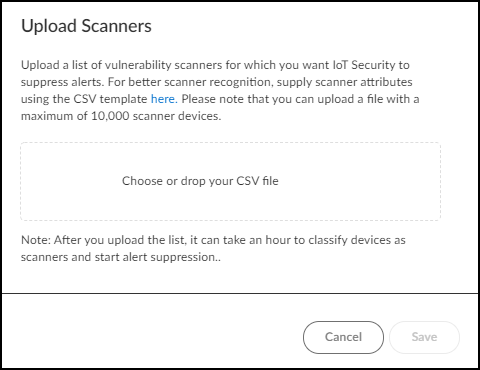
For each scanner, add its IP address and optionally its MAC address and a comment.
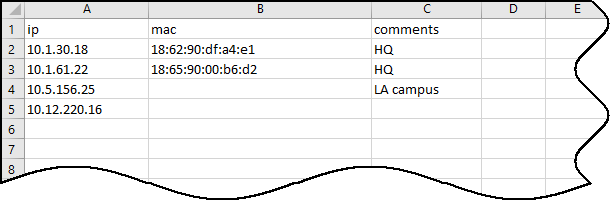
Upload the file to IoT Security. If IP addresses in the CSV file match those in the device inventory, IoT Security adds them to the scanner list and begins to suppress alerts for them. (It can take up to an hour after the upload for alert suppression to begin.) The Source column in the Scanners table indicates that a scanner was manually uploaded by displaying User . If IP addresses are new to IoT Security, it adds them to the scanner list and it adds them to the inventory as scanners after detecting network traffic for them. If there are duplicate entries, IoT Security skips them during the upload process. Finally, if there’s a mismatch between the IP-and-MAC-address pairing for an uploaded scanner and the pairing for a device in its inventory, IoT Security does not upload it.
Routine Security Alert Management
|
Where Can I Use This? |
What Do I Need? |
|
|
Regularly monitor the notes added to the Alert Events list for the high-level security alerts you’re tracking. This is an efficient way for team members to coordinate efforts and check on the status.
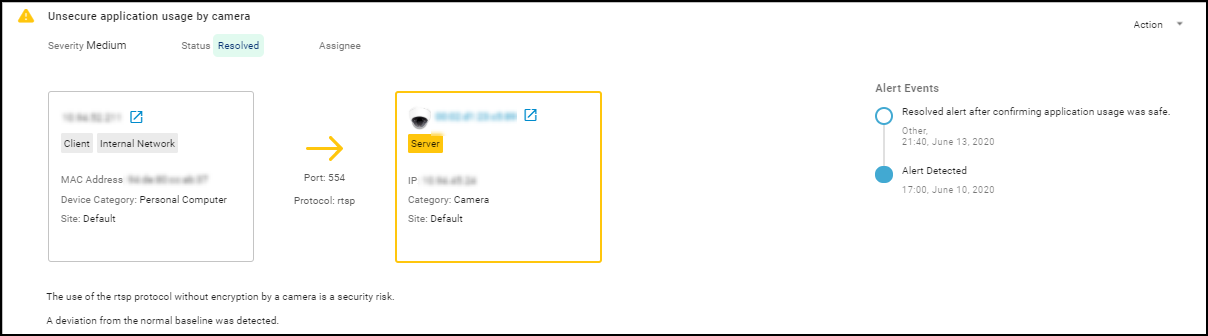
Review low-severity alerts on a daily basis. Select the ones that you find acceptable and resolve them all with a few simple clicks as explained in the previous section.
On a weekly or monthly basis, download all the alerts and all the resolved alerts. Use the data there to make a status report to show what your team has done.
In addition to reacting to alerts that already occurred, you can proactively address vulnerabilities before an attack takes place. On DashboardsSecurity Dashboard , check the Active Vulnerabilities to Date entry in the Risk panel.
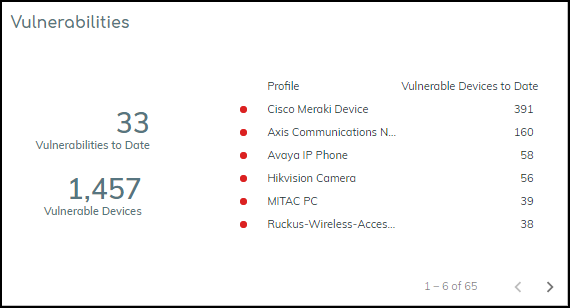
Click Active Vulnerabilities to Date to open the VulnerabilitiesAll Vulnerabilities page.
By default, the IoT Security portal sorts vulnerabilities by severity, displaying the most severe vulnerabilities first. When you click a vulnerability name, the Vulnerability Details page for it opens. There you can see which devices are vulnerable so you can take steps to remove the vulnerability before it’s exploited in an attack.
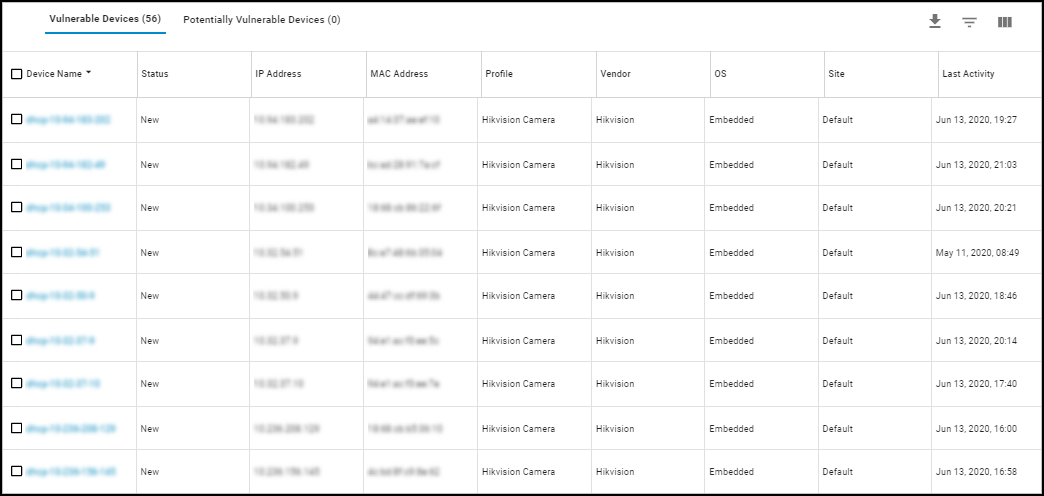
Policy Rule Recommendations
Routine Security Alert Management
|
Where Can I Use This? |
What Do I Need? |
|
|
IoT Security uses machine learning to automatically generate Security policy rule recommendations based on the normal, acceptable network behaviors of IoT devices in the same device profile. It then provides these recommendations for next-generation firewalls to control IoT device traffic.
IoT Security derives its recommendations from the network behaviors it observes in traffic generated by IoT devices in the same profile across multiple IoT Security tenants. It classifies the applications in the observed behaviors into three groups:
- Common applications not locally observed – Applications commonly used by devices in the device profile in multiple IoT Security tenant environments but not observed in yours
- Common applications locally observed – Applications commonly used by devices in the device profile in multiple IoT Security tenant environments including yours
- Unique applications – Applications that are not typically used by devices in this device profile and were observed in use by devices in your environment only
Currently, policy rule recommendations are not supported in multi-vsys firewalls. They must be manually created.
From PAN-OS 11.1, there's a different process for recommending Security policy rules to next-generation firewalls from that described here. The following workflow remains applicable to firewalls running PAN-OS versions prior to PAN-OS 11.1.
IoT Security then formulates a set of policy rule recommendations. These rules allow devices in this device profile to continue network behaviors that are common among multiple tenant environments and those that are unique to yours. The premise is that these behaviors are necessary for devices belonging to this device profile to function. You can accept all these recommendations or disable or modify individual rules to meet the security requirements of your network. When you’re satisfied with a policy set, save and activate it. Once activated, it becomes available for firewalls to import—either through Panorama or directly—and then add to their rule set.
When a Panorama or firewall administrator imports a set of Security policy rules from IoT Security, the import operation automatically creates device objects from source and destination profiles in the recommended rules and uses those objects in the Security policy rules it constructs. For the firewall to identify which IoT devices to apply its policy rules to, it uses IP address-to-device mappings that IoT Security provides through Device-ID. The firewall learns the device profile of an IoT device from the mapping and applies rules with matching device objects as the source.
The IoT Security app makes policy rule recommendations only for IoT devices that it has identified with a high degree of confidence (a confidence score of 90-100%). It does not consider the network behaviors of low- and medium-confidence IoT devices (0-69% and 70-89% scores). In addition, IoT Security does not provide policy rule recommendations, alert and vulnerability detection, and network behavior analysis for IT devices, which are devices that aren’t built for a specific task, such as personal computers, smart phones, and tablets for example. For IT devices, the IoT Security app provides device identification only.
After allowing sufficient time for IoT Security to collect the full behaviors of IoT devices in a profile, you’re ready to create policy rule recommendations for it.
To begin, log in to the IoT Security portal, navigate to AssetsProfiles , and then click a profile name.
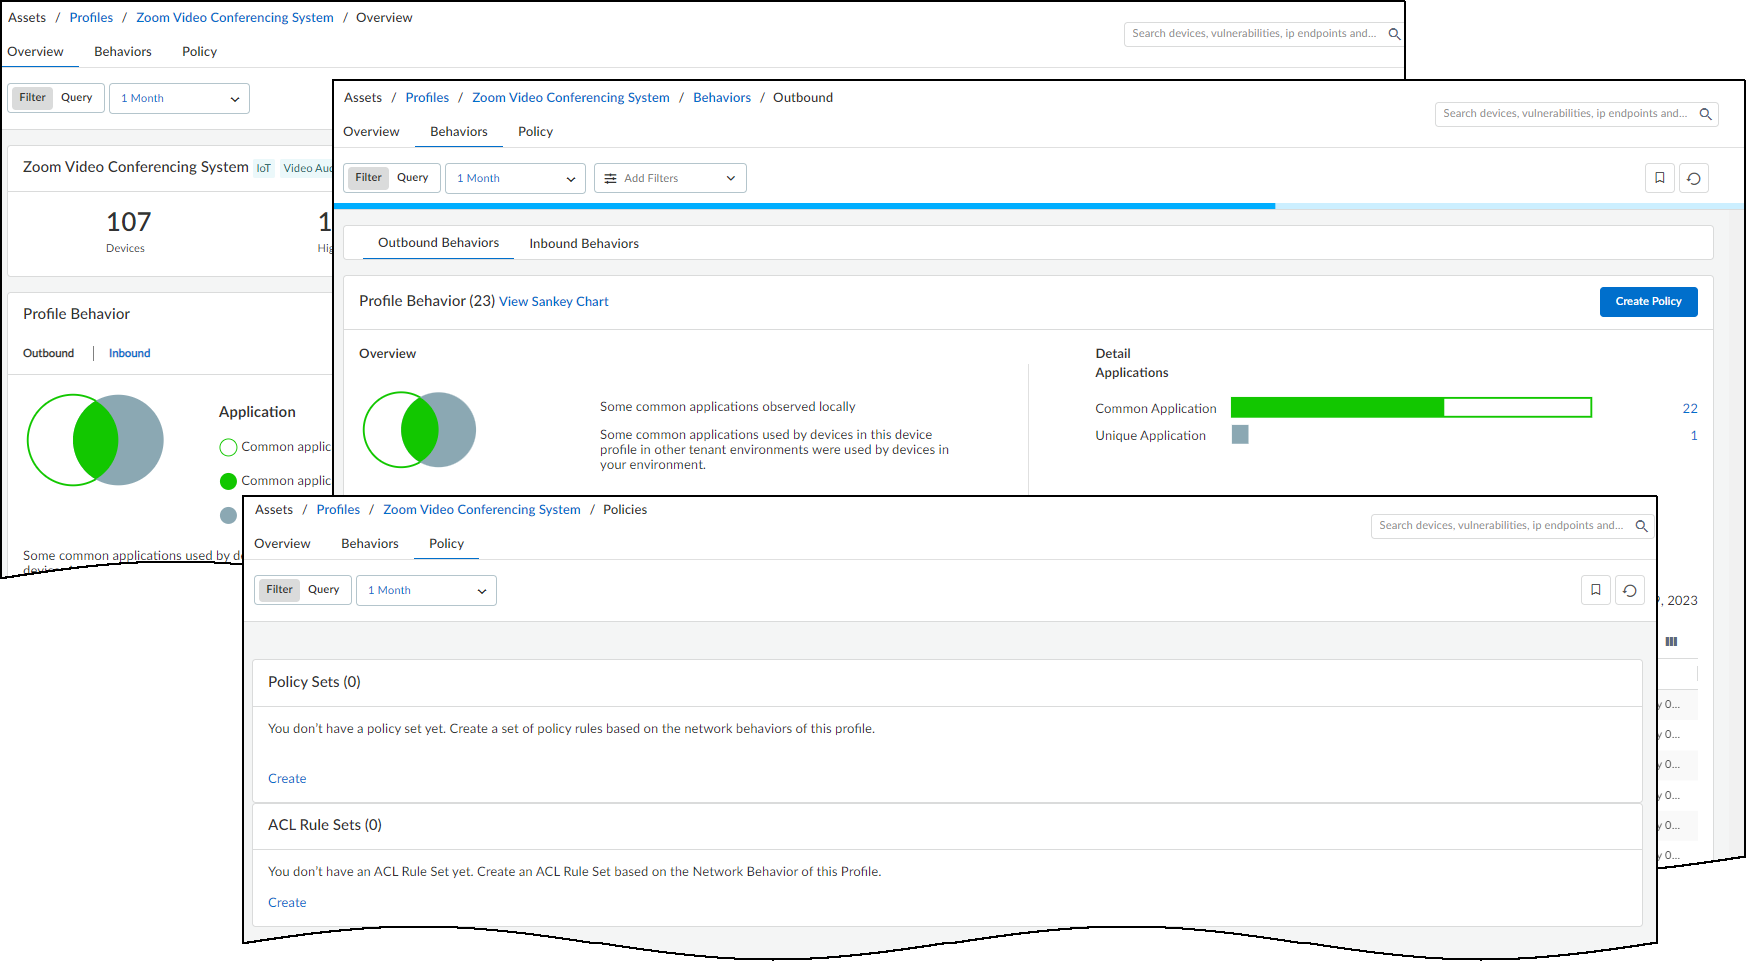
IoT Security displays three profile details pages:
- Overview – View a summary about the high-confidence IoT devices in this profile and their related risk factors for the past day, week, or month. See Device Profile Overview .
- Behaviors – View the behaviors of high-confidence IoT devices belonging to this profile in your local network environment and in other IoT Security tenants’ environments. Also create Security policy rule sets based on these observed behaviors for next-generation firewalls. See Device Profile Behaviors .
- Policy – View previously created Security policy rule sets for next-generation firewalls and ACL rule sets for integration with Cisco ISE . IoT Security generates both types of rule sets from the observed network behaviors of high-confidence IoT devices in this profile in your local network environment and in other IoT Security tenants’ environments. See Device Profile Policy .
Device Profile Overview
|
Where Can I Use This? |
What Do I Need? |
|
|
To access the Overview page of a device profile, select AssetsProfiles > profile_name > Overview .
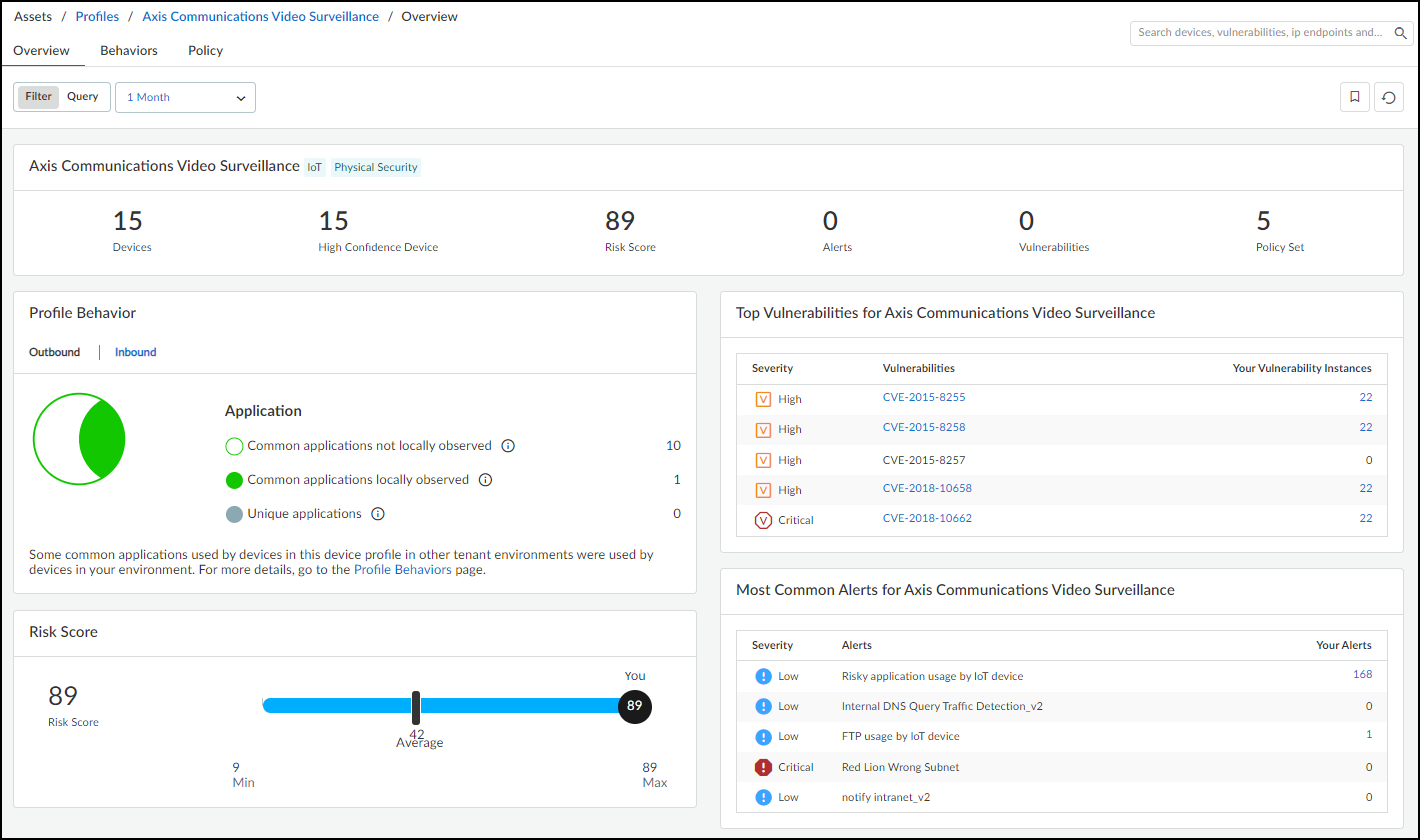
The Overview page displays data about the devices in this profile. The data is drawn only from IoT devices with high confidence scores of 90-100%; that is, devices that IoT Security has identified with a high degree of confidence. If the number of high-confidence devices is less than 50%, consider using the recommendations provided on the Data Quality Diagnostics page ( AdministrationData Quality ) to increase the number of high-confidence devices in the profile.
Time filter – The time filter controls the data displayed on the Overview page by the number of high-confidence devices in the profile that were active on the network during the past 1 Day (past 24 hours up until now), past 1 Week, or past 1 Month. Clicking the Reset filter icon (
![]()
) sets it to 1 Day .
The time filter only affects the display of high-confidence devices in the local network, not that of all devices.
Summary bar – The profile summary across the top of the Overview page concisely presents important information about the devices in the profile: the overall number of devices, the number of high-confidence devices, the risk score for this device profile (for risk assessment details, see IoT Risk Assessment ), the number of alerts and vulnerabilities of the high-confidence devices, and the number of policy sets configured for this profile.
You can configure multiple policy sets for the same profile but only one of them can be activated at a time.
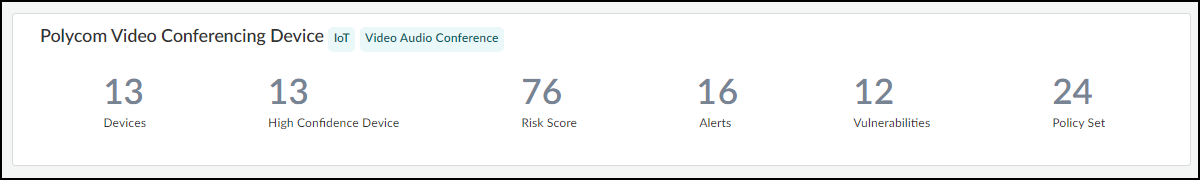
Below the summary are several sections about key aspects of the device profile and related risk factors. IoT Security produces this information by using machine learning to observe and analyze the network activity of all the high-confidence devices in the profile. It then compares the information about your devices with those in the same device profile in other IoT Security tenant networks to give you a sense of how your device behaviors and risk levels match up with others.
Profile Behavior – This shows the different types of outbound and inbound behavior of the high-confidence devices. Switch between the two behaviors by clicking Outbound and Inbound .
IoT Security compares the applications that the high-confidence devices in this profile use during the time range set at the top of the page with the applications that devices in the same profile use in other IoT Security tenants. The time filters are 1 Day, 1 Week, or 1 Month. It then shows how many applications were observed in other tenants’ environments only (common, not locally observed), in both your and other tenants’ environments (common, locally observed), and in your environment only (unique applications).
Most Common Alerts for profile_name – This lists up to five of the most common security alerts raised by devices in this device profile across multiple IoT Security tenants and their severity levels. The number of alerts raised by your devices is also shown in the column labeled Your Alerts.
Top Vulnerabilities in for profile_name – This lists up to five of the top vulnerabilities affecting devices in this device profile across multiple IoT Security tenants and their severity levels. The number of vulnerability instances in your network environment is also shown in the column labeled Your Vulnerability Instances.
Risk Score – This shows the risk score for the device profile in relation to the overall range and to the average of all IoT Security tenants with the same profile. This helps you see the level of risk for your devices relative to the average level of other IoT Security tenants.
In the following screen capture, the range extends from 10 to 89, which are the lowest and highest risk scores for this device profile among all IoT Security tenants, and the average risk score is 13. With a local risk score of 74, you might consider addressing some threats to reduce risk and lower the score away from the high end of the range.
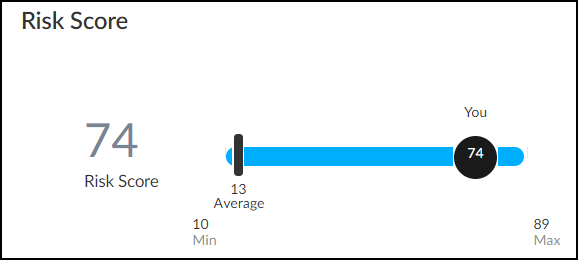
Device Profile Behaviors
|
Where Can I Use This? |
What Do I Need? |
|
|
To access the Overview page of a device profile, select AssetsProfiles > profile_name > Behaviors .
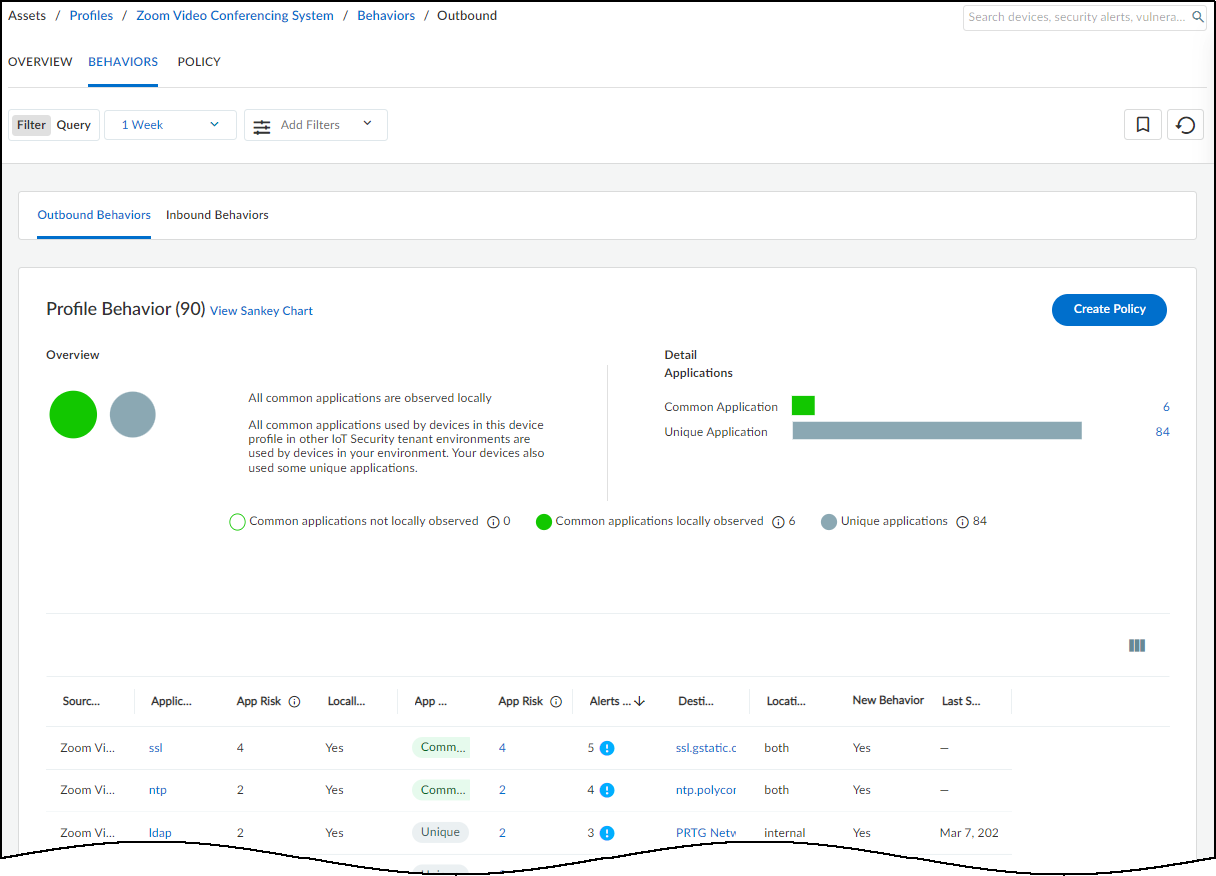
The Behaviors page displays the behaviors of high-confidence IoT devices in this profile. These are IoT devices that IoT Security has identified with a high degree of confidence and has calculated a confidence score of 90-100%. The behaviors are those of IoT devices belonging to the same profile in your local network environment and in the network environments of other IoT Security tenants.
A confidence score indicates the level of confidence IoT Security has in its identification of a device. IoT Security has three confidence levels based on calculated confidence scores: high (90-100%), medium (70-89%), and low (0-69%).
Filter the Content Displayed
The behaviors displayed on this page and in the related Sankey chart are controlled by the filters at the top of the page; the option to show either outbound or inbound behaviors; and the option to show common applications, unique applications, or both (the default) under Applications in the Profile Behaviors section.
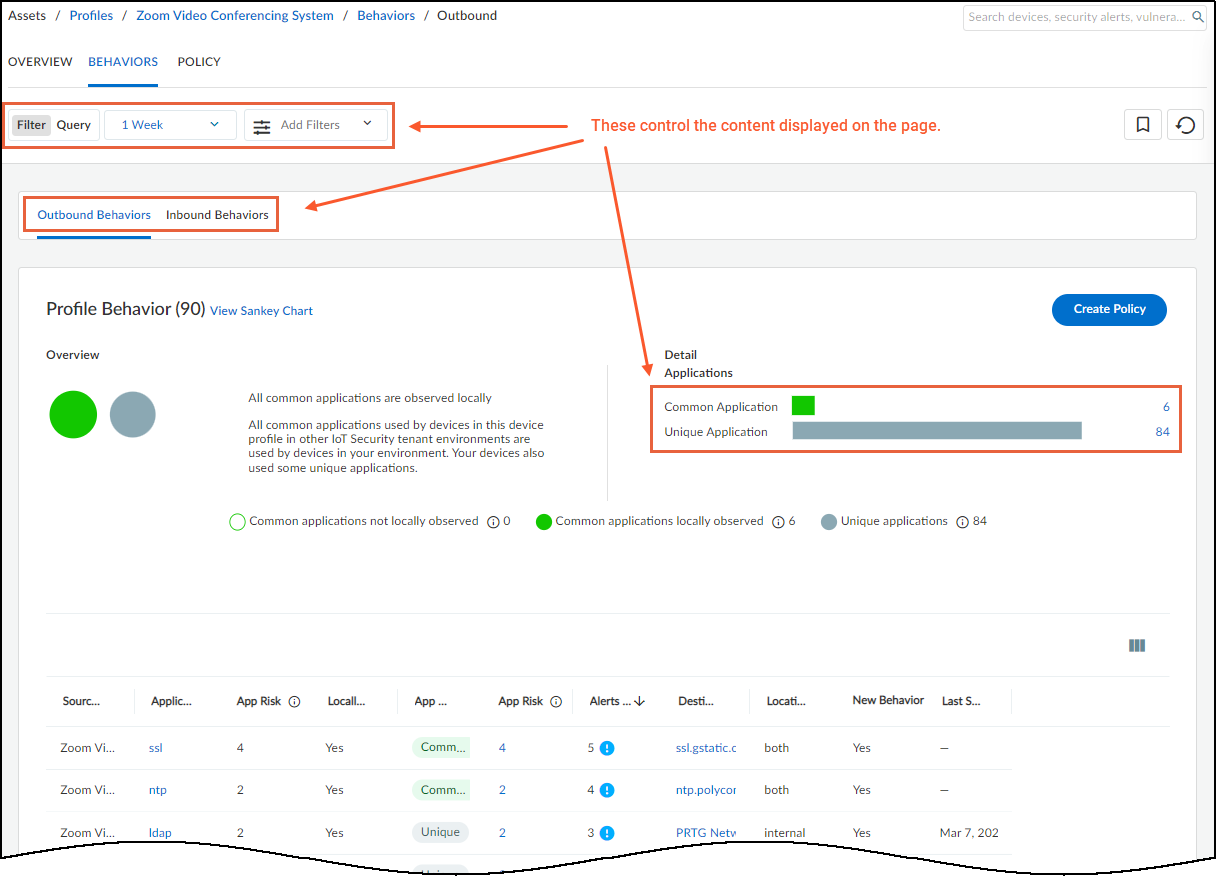
The time filter also determines which outbound, or inbound, behaviors are displayed.
You can only create a policy rule set for outbound behaviors; that is, when the source of a behavior is an IoT device in a device profile. IoT Security does not generate policy rule recommendations for inbound behaviors, which is when the IoT device is the destination.
Time filter – The time filter controls the behaviors displayed on the Behaviors page by when each behavior was observed on the network during the past 1 Day (past 24 hours up until now), past 1 Week, or past 1 Month. Clicking the Reset filter icon (
![]()
) sets the time to 1 Day and removes any additional filters you might have set.
Add Filters – Add filters to show specific types of behaviors. Select one or more of the following:
- Applications – Select and choose one or more applications to show on the page. The applications listed were part of high-confidence IoT device behaviors observed on the network during the period of time set in the time filter.
- Local Observed – Select and choose Yes to show behaviors observed locally in your network or No to hide locally observed behaviors.
- App Usage – Select and determine what to show based on where behaviors were observed:
- Common only are behaviors that were observed in other IoT Security tenant environments but not in yours.
- Common and local are behaviors observed in other tenant environments and in yours.
- Local only are behaviors observed in your environment but not in the environment of any other tenant.
- Unexpected behavior – Select and choose Yes to show behaviors that were explicitly not permitted when the policy set was activated but have since appeared on the network. Choose No to hide unexpected behaviors.
- New behavior – Select and choose Yes to show behaviors discovered on the network after the last policy set activation. Choose No to hide new behaviors.
None of these filters nor the time filter determines which behaviors to include in any policy sets you might create. They only determine what to show on the Behaviors page. However, once you start the process of creating a policy set, IoT Security presents a similar set of filters to use within the context of policy creation.
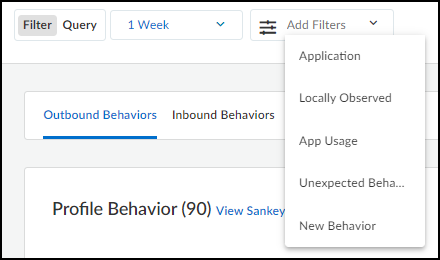
As you add and remove filters, the number in parentheses next to “Profile Behavior” changes accordingly. Refer to this for a quick reference of how the filters affect the number of behaviors that appear on the page while the filters are in place.
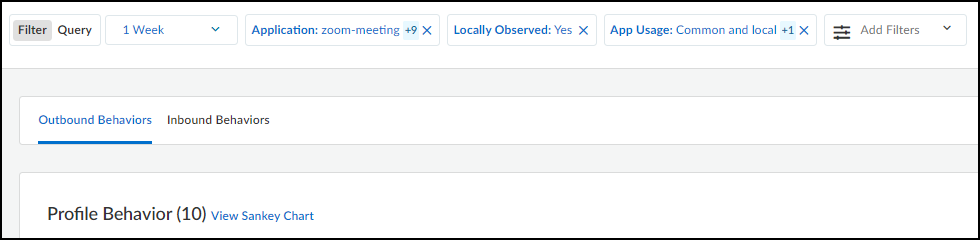
Outbound Behaviors and Inbound Behaviors – By default outbound behaviors are shown. These are behaviors in which this device profile is the source of network activity.
In the upper screen capture of the two below, there are 66 outbound behaviors:
- 10 outbound behaviors include common applications observed in both your and other tenants’ environments. These are indicated with a green fill in the Venn diagram and bar chart.
- 56 include applications that are unique to your environment. These are indicated as gray.
In the lower screen capture, there are 11 inbound behaviors, which are behaviors in which this device profile is the destination of network activity:
- 9 inbound behaviors include common applications observed in other tenants’ environments but not in yours. These are indicated with a green outline in the Venn diagram and bar chart.
- 1 includes a common application observed in both your and other tenants’ environments. This is indicated with a green fill.
- 1 includes a unique application observed only in your environment. This is indicated as gray.
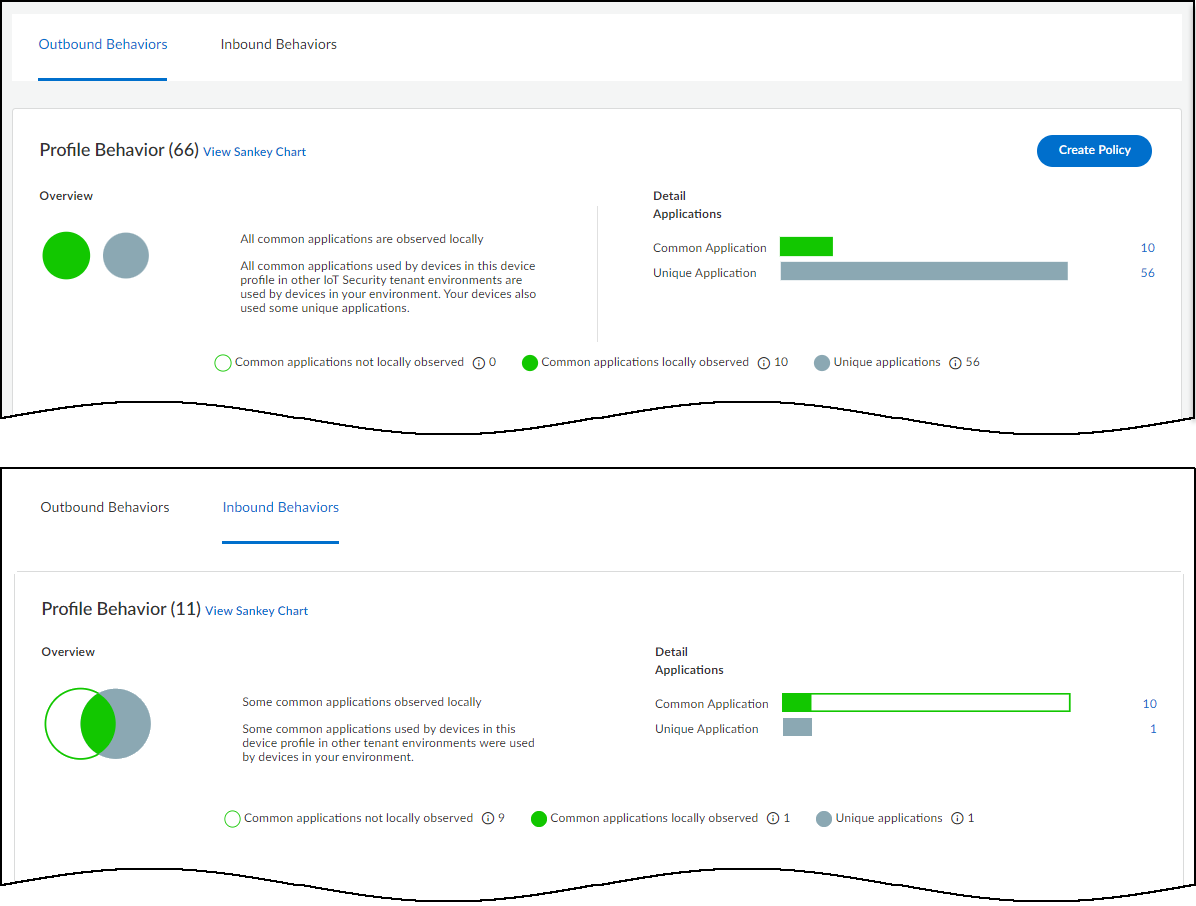
The direction you choose—outbound or inbound—controls what’s shown in the list at the bottom of the Behaviors page and in the Sankey chart. Your choice also shows or hides the Create Policy button, only showing it when Outbound Behaviors is active. Clicking the number to the right of the bar charts also controls whether to show common or unique applications on the page and in the Sankey chart. To undo the filter applied by clicking either of these numbers, click the Reset filter icon (
![]()
) next to the time filter near the top of the page.
Create a Policy Set
Use IoT Security recommendations to create policy rule sets based on the observed network behaviors of IoT devices in the same device profile. For instructions on creating a policy set, see Create a Policy Set in IoT Security .
From PAN-OS 11.1, there's a different process for recommending Security policy rules to next-generation firewalls from that described here. The following workflow remains applicable to firewalls running PAN-OS versions prior to PAN-OS 11.1.
View the Sankey Chart
A Sankey chart is a diagram with lines indicating connections. Click View Sankey Chart to open a panel on the right showing the flow of applications from a source (the current device profile in outbound behaviors) to destinations and the destination locations (internal or external). The lines are color coded as explained above and grouped into these three groups:
- Gray for unique local applications
- Green fill for common applications locally observed
- Green outline for common applications not locally observed
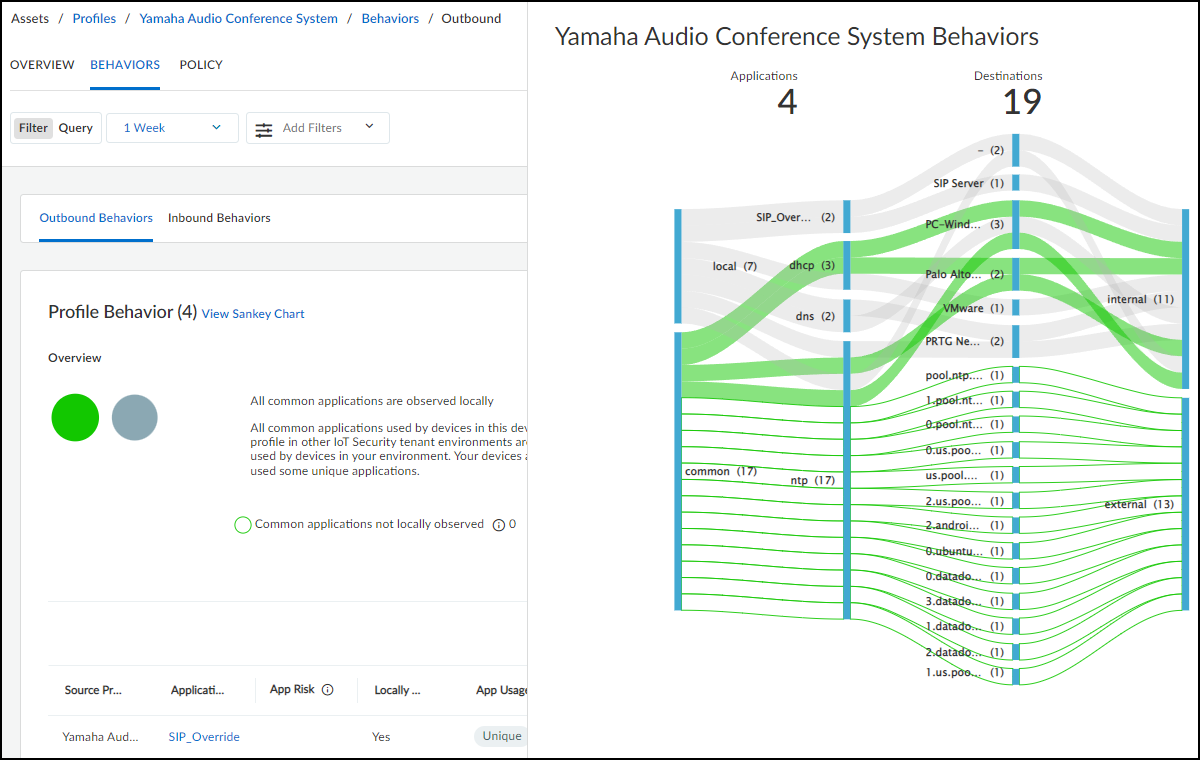
A dash appears for an internal destination when the device profile of a destination is unknown. The number after a destination indicates the number of different IP addresses at the destination profile (for internal destinations) or behind the domain name (for external destinations).
Because the Sankey chart can become overwhelming when there are lots of lines, you can apply filters to reduce their number. For example, applying a filter that shows only locally observed applications reduces the number of lines in the diagram shown above from 24 to 11 while also increasing line width. See below.
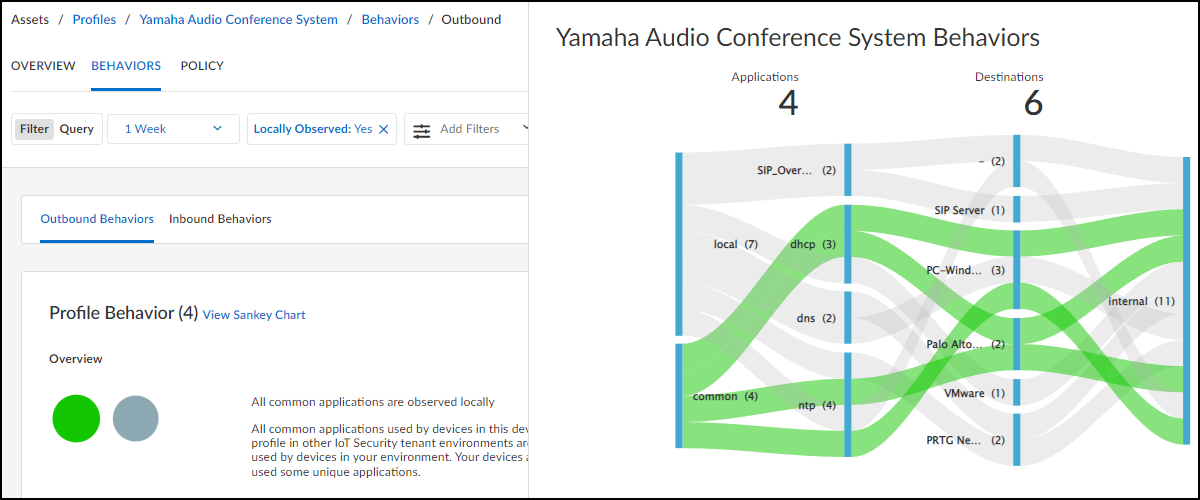
You can also apply an application filter. For example, if there is one application that interests you, you can show only behaviors that include that. You can also filter by multiple applications. The following screen capture shows outbound behaviors just for NTP.
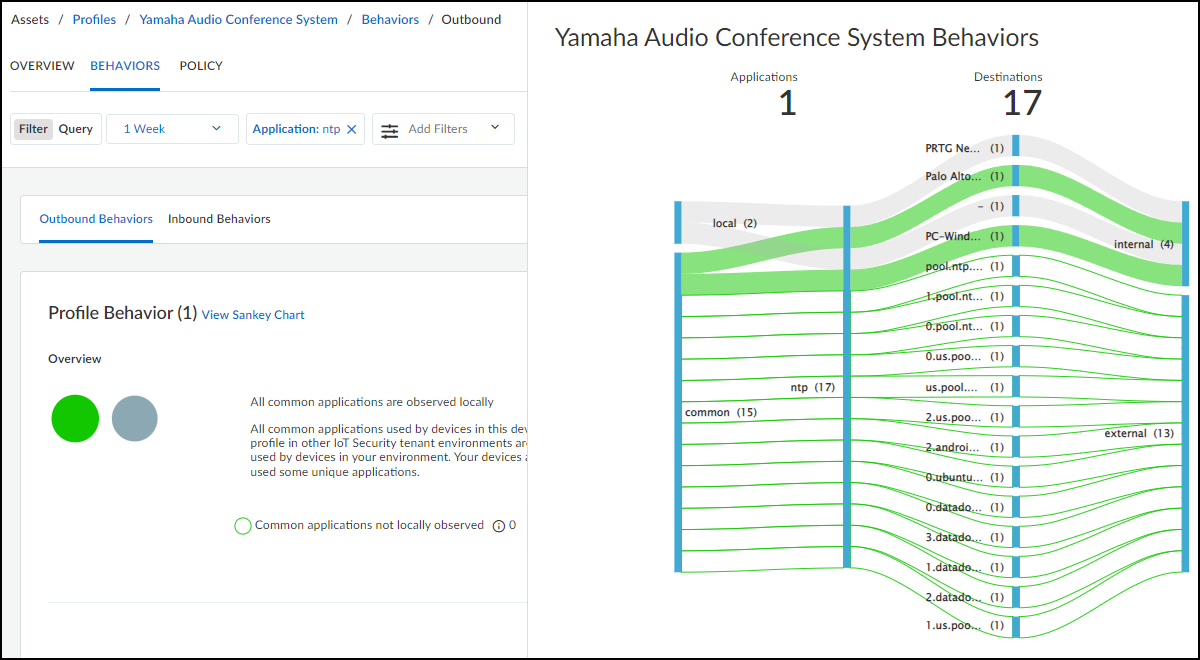
Another feature of the chart is that you can hover your cursor over lines and blue bars to see information pop-ups. In the screen capture above, the cursor is hovering over the destination bar where one of the common behaviors crosses it to show a pop-up identifying its particular destination. This is useful for seeing complete destination profile names and domain names, which are abbreviated in the chart.
View the Behaviors Table
At the bottom of the Behaviors page is a table listing all the behaviors for this profile matching the filters that have been set: the time filter and additional filters near the top of the page, the outbound or inbound behaviors toggle, and the common or unique application numbers under Detail Applications. The data in the table is aggregated with behaviors grouped by application.
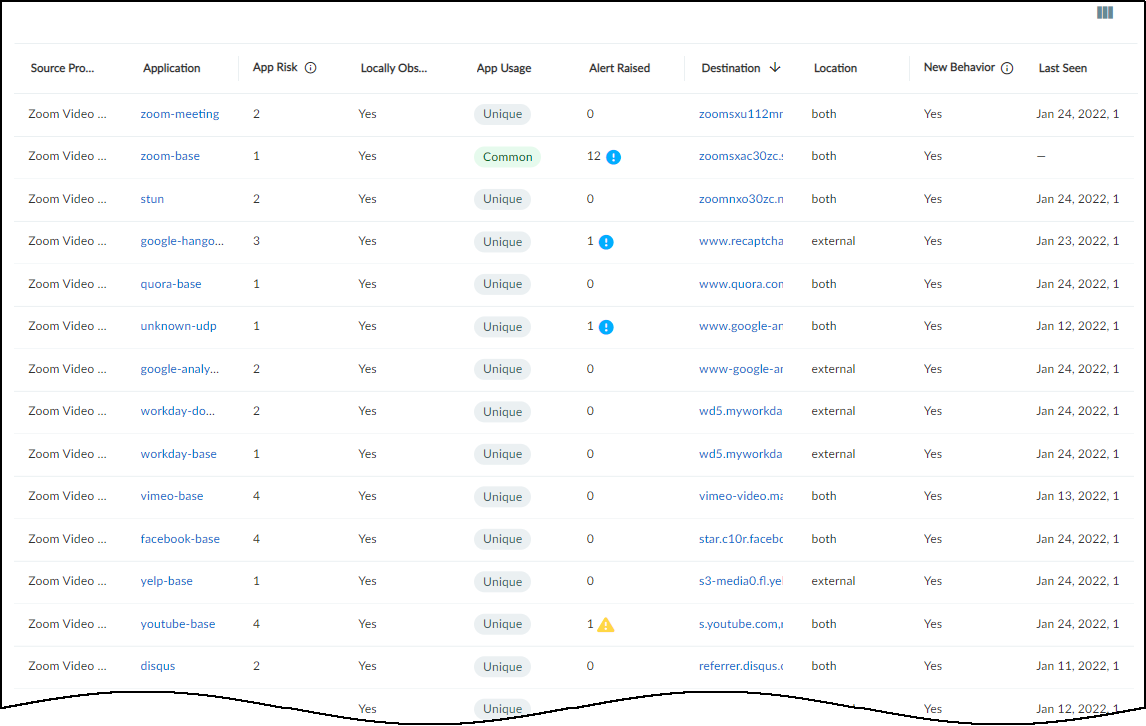
The App Risk column contains the risk level for this application as defined in Applipedia . Risk levels are graded from 1 to 5, with numbers approaching 5 carrying increasingly more risk. Hover your cursor over the application name to display a pop-up panel with information about the application retrieved from Applipedia. For explanations about this information, see Discover IoT Device Applications .
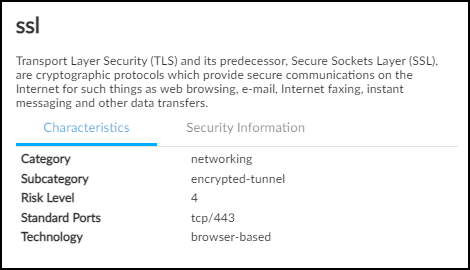
The number of Security alert instances and their severity levels are presented in the Alerts Raised column. For outbound behaviors, you can see the number of alert instances that occurred on devices in the source profile for the application in each row.
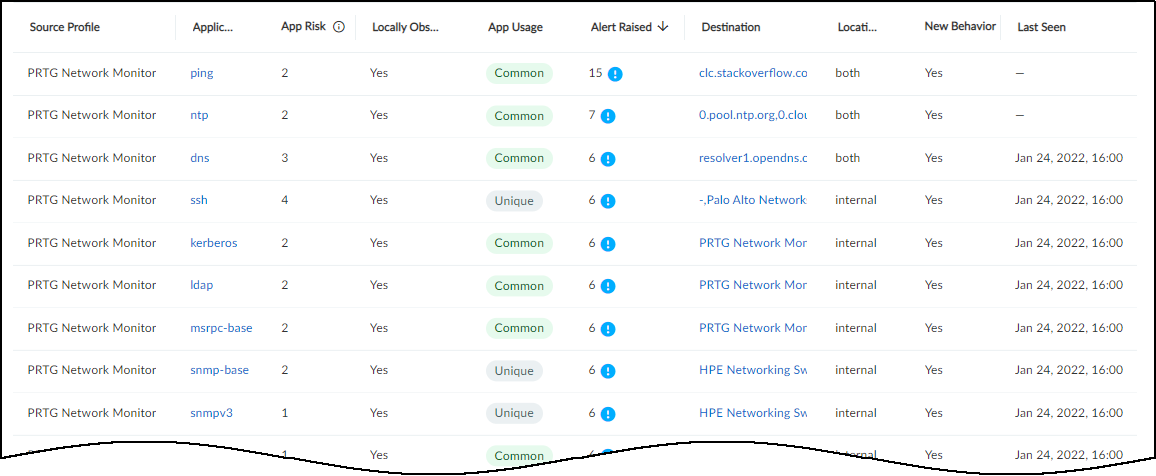
For inbound behaviors, the Alerts Raised column shows the number of alert instances that occurred on devices in the destination profile for an application.
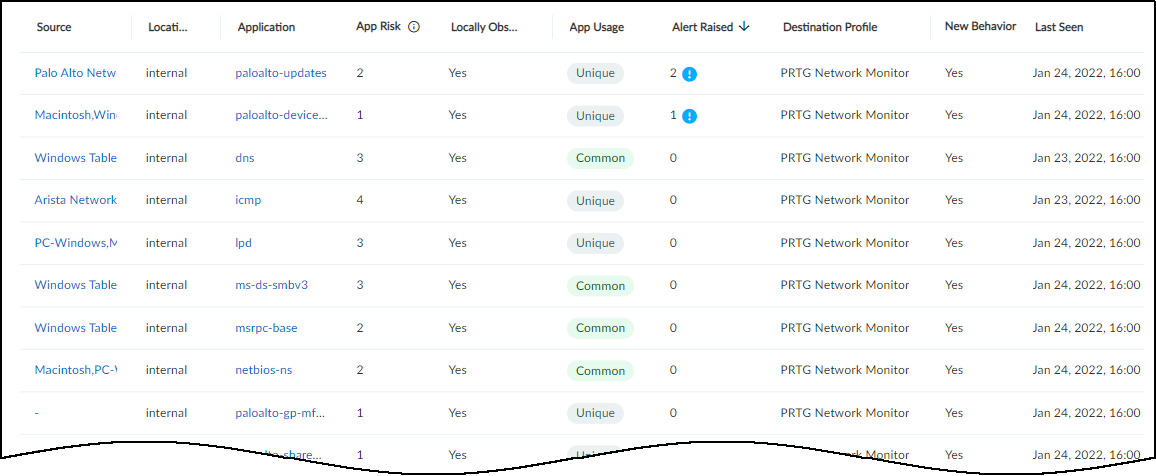
Alert instance totals in the Alerts Raised column are grouped by their severity level: critical, high, medium, and low. The following icons indicate these four levels:
A behavior for a source device profile and application might have numerous destinations. You can drag the destination column to widen it but that still might not be sufficient to see all of them. To open a panel with detailed information, click anywhere in the destination field.
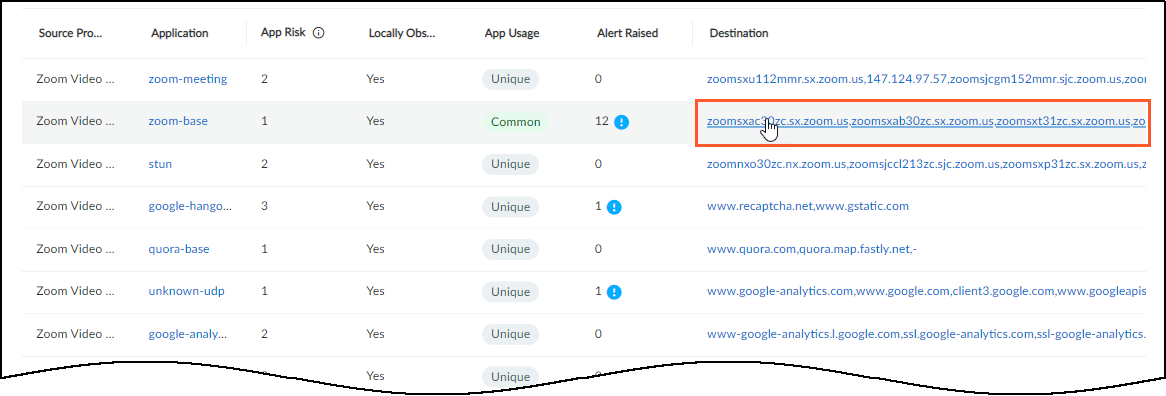
The View Destination for application_name panel provides its own table with rows for each individual destination to which devices in the source device profile sent a particular application. Hover your cursor over a number in the Destination IP column to see a pop-up with a list of IP addresses.
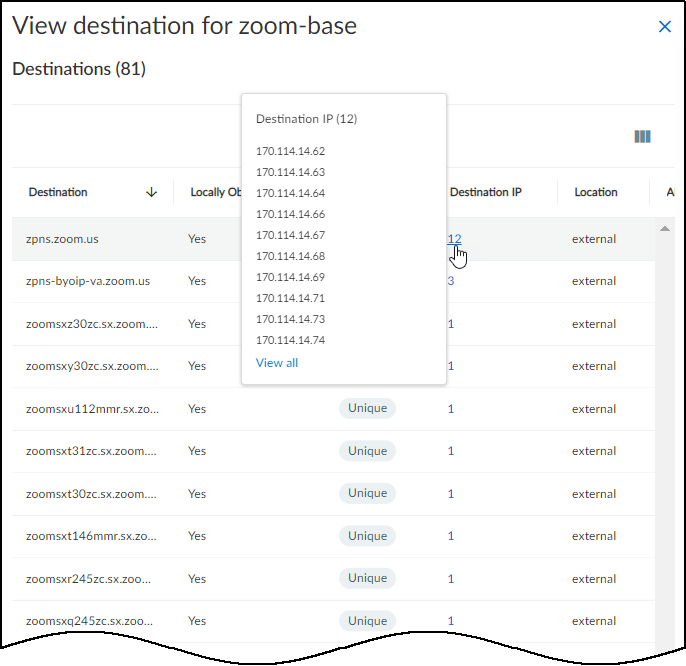
If you are looking for a specific destination IP address and the list of addresses is too long for the Destination IP pop-up to display them all, click the number in the Destination IP column and a dialog box appears with a search option.
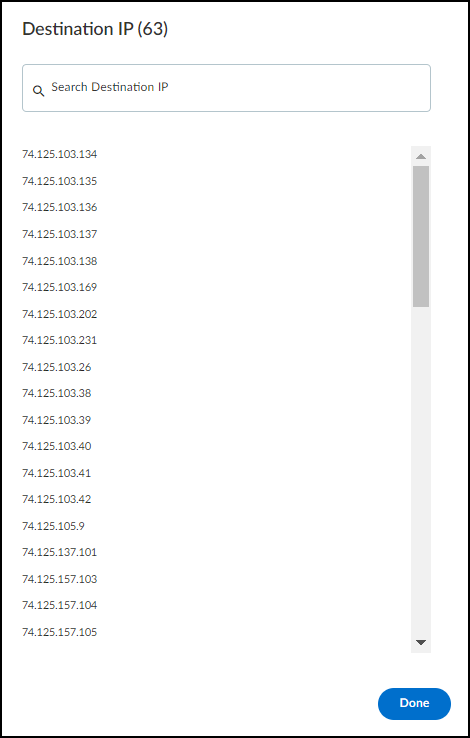
In the Behaviors table, the Location column indicates where the destinations of a behavior are. If all the destinations are in the local network, the location is internal . If all the destinations are outside the local network, the destination is external . If some destinations are internal and some external, then the location is both. In this case, you can see the location of individual destinations by clicking in the Destination column in the Behaviors table and looking at the Location column in the View Destination for application_name panel.
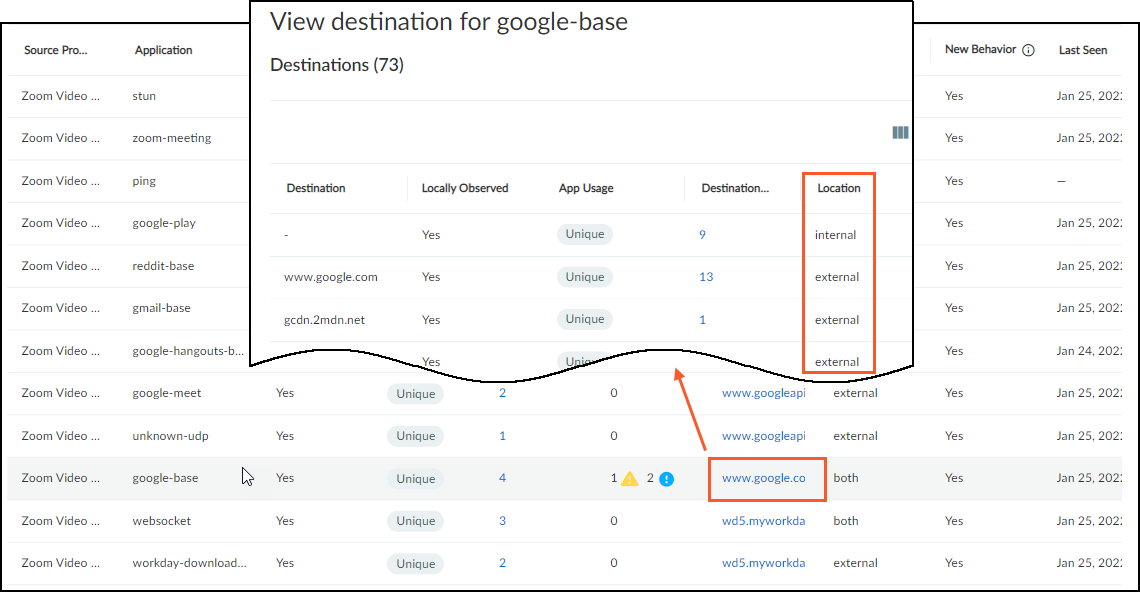
Device Profile Policy
Create a Policy Set in IoT Security
|
Where Can I Use This? |
What Do I Need? |
|
|
From PAN-OS 11.1, there's a different process for recommending Security policy rules to next-generation firewalls from that described here. The following workflow remains applicable to firewalls running PAN-OS versions prior to PAN-OS 11.1.
To access the Policy page of a device profile, select Profiles > profile_name > Policy .
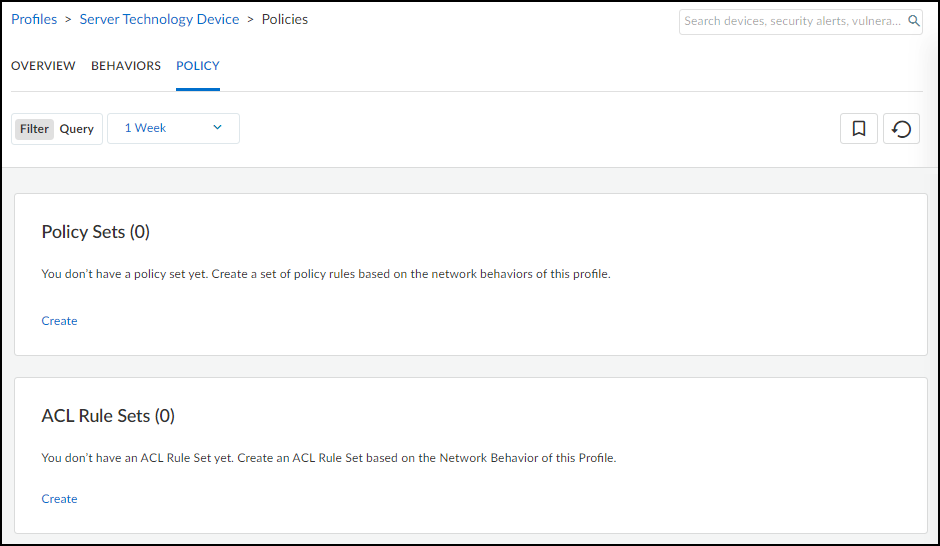
This page lists all the policy sets that were created for the device profile, when they were last updated, whether they were activated, and if so, when. When there are no policy sets for a device profile, the Policy page is empty.
If you create a policy set for a device profile and save it without activating it, it’s added to the Policy page. In this case, there’s a dash in the Last Set as Active column.
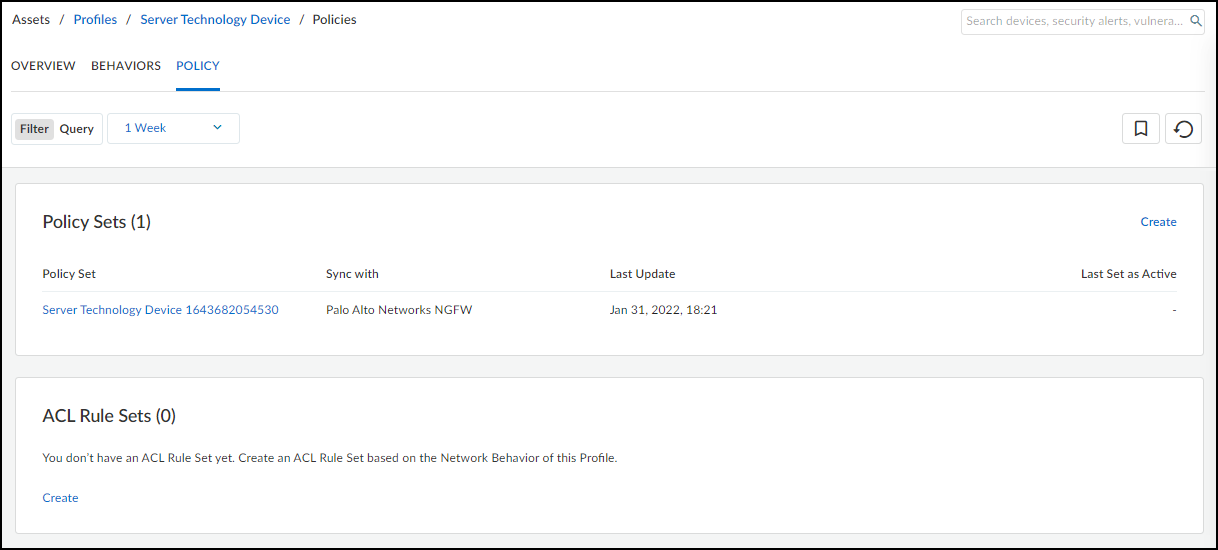
After you activate a policy set, it’s marked with an Active label and IoT Security adds a timestamp in the Last Set as Active column.
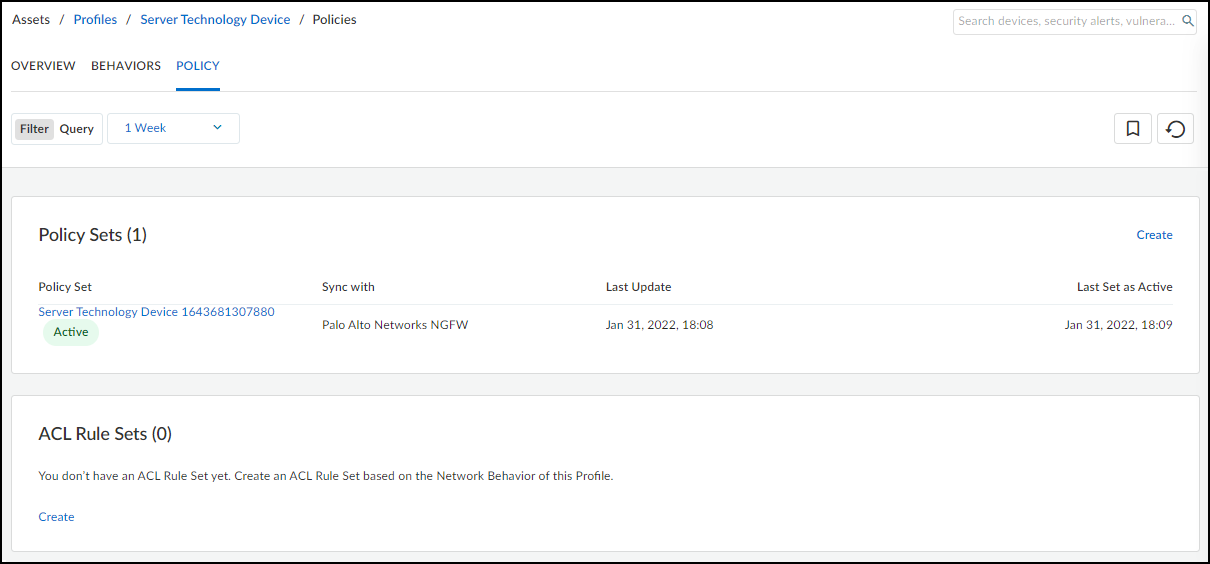
If you later deactivate the policy set, the Active label is removed. However, the timestamp in the Last Set as Active column remains indicating that it once was active and when.
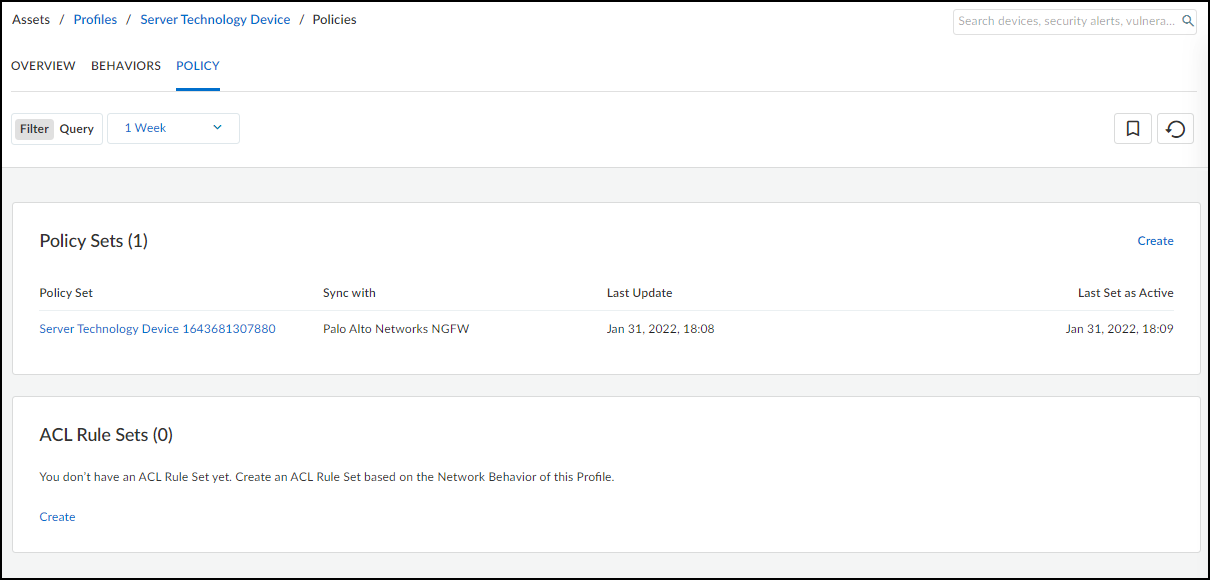
New behaviors are behaviors discovered on the network after the active policy set was activated or last updated. Unexpected behaviors are behaviors that were explicitly not permitted when the policy set was activated or last updated but have since appeared on the network, which means the enforcement implemented in a next-generation firewall is missing them. If IoT Security detects new or unexpected behaviors on the network after some time has passed since the policy set was first activated, it lists them on the AssetsProfiles > profile_name > Policy page and presents you with an opportunity to modify the active policy set to account for these behaviors.
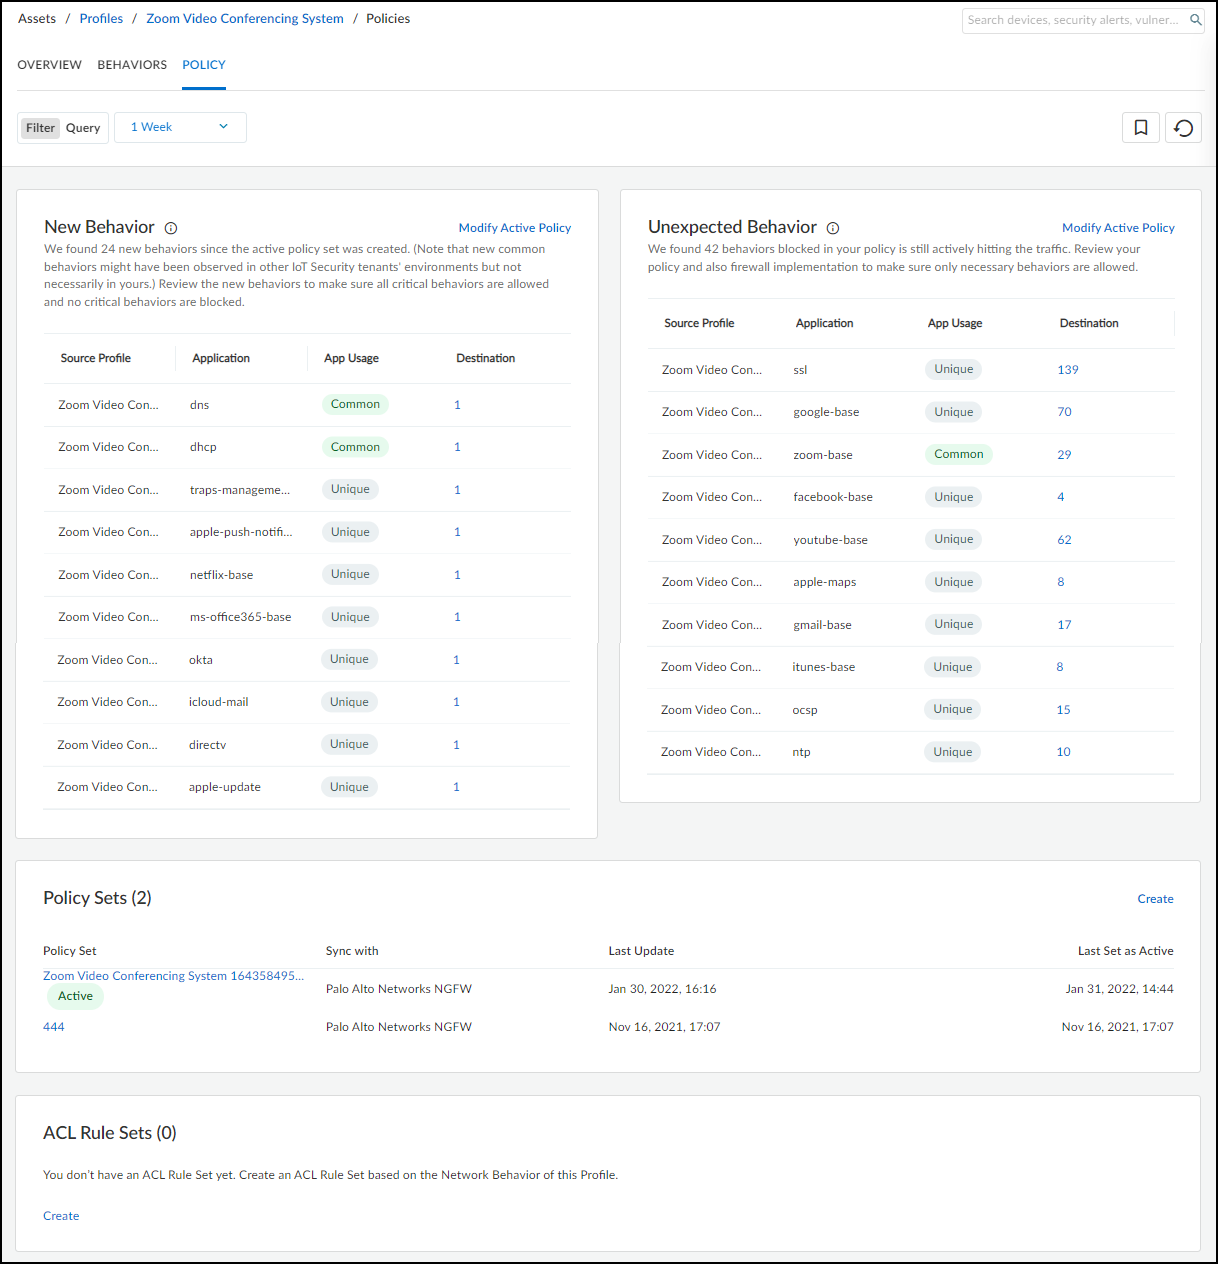
When integrating IoT Security with Cisco ISE, you can send ISE automatically generated ACL rule sets for IoT devices. For information about providing ISE with access control lists for IoT devices, see Apply Access Control Lists through Cisco ISE .
Device Profile Policy
Create a Policy Set in IoT Security
|
Where Can I Use This? |
What Do I Need? |
|
|
From PAN-OS 11.1, there's a different process for recommending Security policy rules to next-generation firewalls from that described here. The following workflow remains applicable to firewalls running PAN-OS versions prior to PAN-OS 11.1.
To access the Policy page of a device profile, select Profiles > profile_name > Policy .
This page lists all the policy sets that were created for the device profile, when they were last updated, whether they were activated, and if so, when. When there are no policy sets for a device profile, the Policy page is empty.
If you create a policy set for a device profile and save it without activating it, it’s added to the Policy page. In this case, there’s a dash in the Last Set as Active column.
After you activate a policy set, it’s marked with an Active label and IoT Security adds a timestamp in the Last Set as Active column.
If you later deactivate the policy set, the Active label is removed. However, the timestamp in the Last Set as Active column remains indicating that it once was active and when.
New behaviors are behaviors discovered on the network after the active policy set was activated or last updated. Unexpected behaviors are behaviors that were explicitly not permitted when the policy set was activated or last updated but have since appeared on the network, which means the enforcement implemented in a next-generation firewall is missing them. If IoT Security detects new or unexpected behaviors on the network after some time has passed since the policy set was first activated, it lists them on the AssetsProfiles > profile_name > Policy page and presents you with an opportunity to modify the active policy set to account for these behaviors.
When integrating IoT Security with Cisco ISE, you can send ISE automatically generated ACL rule sets for IoT devices. For information about providing ISE with access control lists for IoT devices, see Apply Access Control Lists through Cisco ISE .
Create a Policy Set in IoT Security
Import a Policy Set into Panorama
|
Where Can I Use This? |
What Do I Need? |
|
|
IoT Security provides the automatic generation of policy rule recommendations to control IoT device traffic. The recommendations are based on the network behaviors of all the high-confidence IoT devices in the same device profile in your local network environment as well as that of devices in the same profile in other IoT Security tenant environments.
High-confidence devices are those whose identity IoT Security is highly confident about and has calculated a confidence score of 90-100%. IoT Security has three confidence levels based on calculated confidence scores: high (90-100%), medium (70-89%), and low (0-69%).
After allowing sufficient time for IoT Security to collect the full behaviors of IoT devices in a profile, you’re ready to create a set of policy rule recommendations for it.
From PAN-OS 11.1, there's a different process for recommending Security policy rules to next-generation firewalls from that described here. The following workflow remains applicable to firewalls running PAN-OS versions prior to PAN-OS 11.1.
- Log in to the IoT Security portal and select AssetsProfiles > profile_name > Behaviors .
- Review the data on the Behaviors page, choose Outbound Behaviors , and then click Create Policy .
For a description of the content on the Behaviors page for a device profile, see Device Profile Behaviors .
You can also create a policy set by navigating to the Profiles page, hovering your cursor over a profile name, and then clicking Create Policy Set in the information pop-up that appears.
- Read the introduction to the creation of a Security policy rule set that IoT Security can recommend to next-generation firewalls and then click Next .
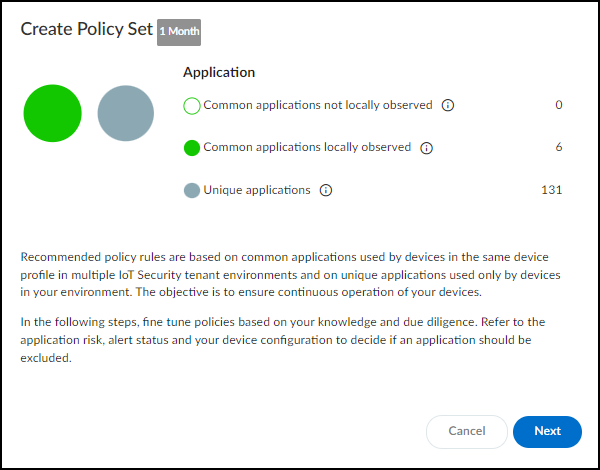
- Select the recommended policy rules to include in the policy set.
IoT Security automatically generates a list of policy rule recommendations. These are based on common applications that devices in the same device profile in multiple IoT Security tenant environments use and on unique applications that only devices in your environment have used during the last month (note the 1 Month label to the right of the breadcrumbs at the top of the page). The rule recommendations are organized by application with all rules selected by default. Clear any you don’t want to use based on your organization’s policy and practice as well as the information provided.
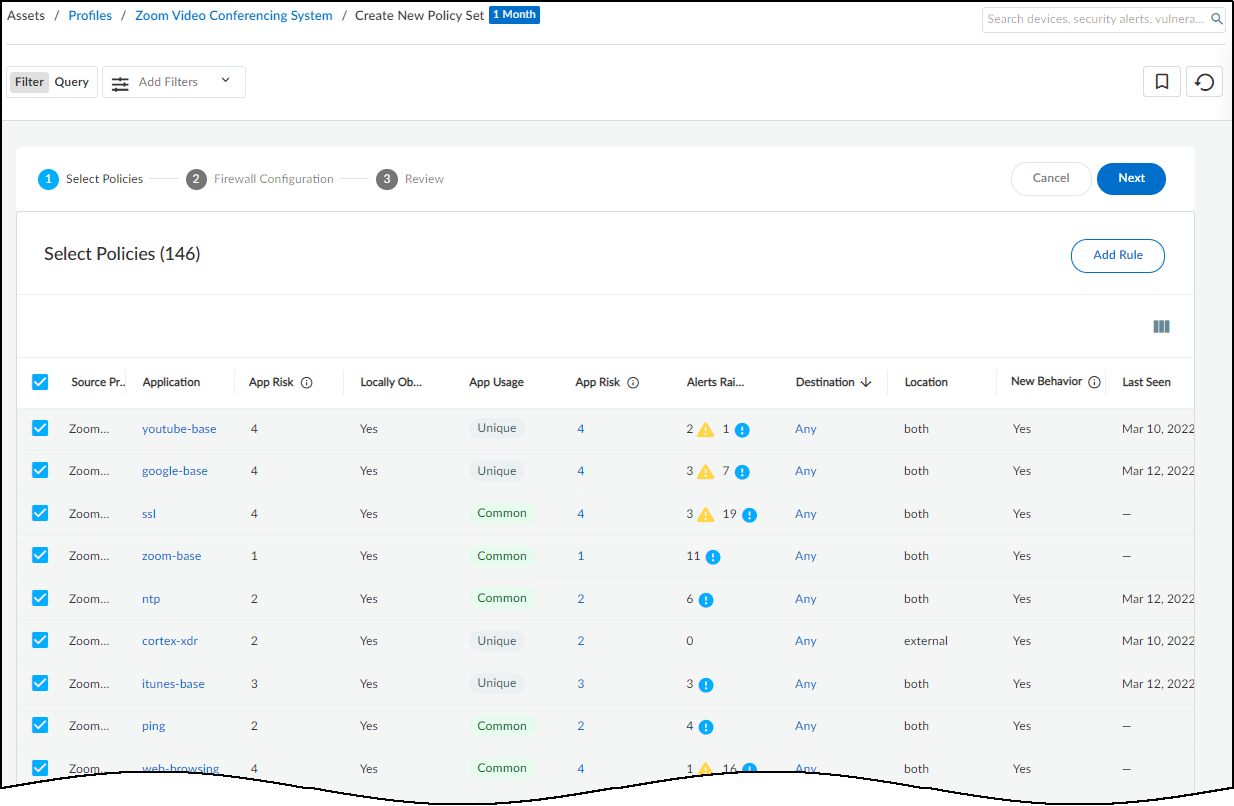
In addition to the automated policy rules that IoT Security generates based on observed network behaviors of devices in the same profile, you can manually add other rules to the set. In the policy set creation workflow, click Add Rule and then set an application and destination. By default, Any appears in both the Application and Destination Type fields. To change the application, delete Any and start typing the application for which you want to create a rule until autocompletion provides enough letters to select it. To set a destination, first choose a destination type: Destination Profile (for internal destinations), FQDN, IP, or Netmask. Then choose one or more destination profiles from the list or enter one or more FQDNs, IPv4 or IPv6 addresses, or netmasks. When done, Create the rule.
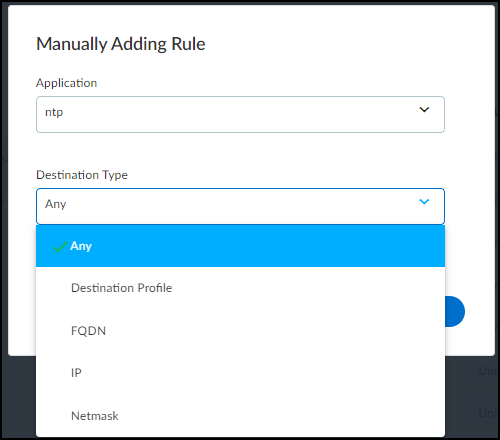
The App Risk column contains the risk level for this application as defined in Applipedia . Risk levels are graded from 1 to 5, with numbers approaching 5 carrying increasingly more risk. Hover your cursor over the application name to display a pop-up panel with information about the application retrieved from Applipedia. For explanations about this information, see Discover IoT Device Applications .
The Alert Raised column provides the number of alert instances involving each application that occurred on devices in the source profile. This information is useful when deciding whether to include recommended behaviors in a set of policy rules. For example, if you notice a behavior is associated with a high number of alerts, you might delay adding a rule that permits this behavior until you investigate how serious the alerts are. If they are all low severity alerts, you might decide they’re acceptable. On the other hand, if they are high or critical severity alerts, you might decide to resolve them first before proceeding.
By default, IoT Security recommends permitting IoT devices in the source profile to use applications with all destinations detected in observed network traffic. This is indicated by Any in the Destination column. If you don’t want to allow certain destinations, click Any , toggle off Allow any destination , clear these destinations from the list, and then close the Select Destination panel.
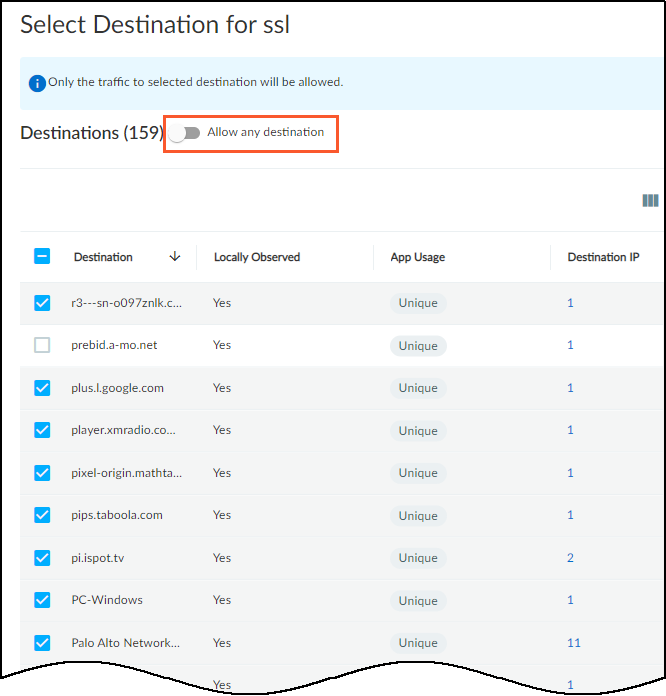
- Use the automatically generated policy rules configuration or modify it as necessary.
Use the default policy set name or enter your own. Optionally add a description for future reference.
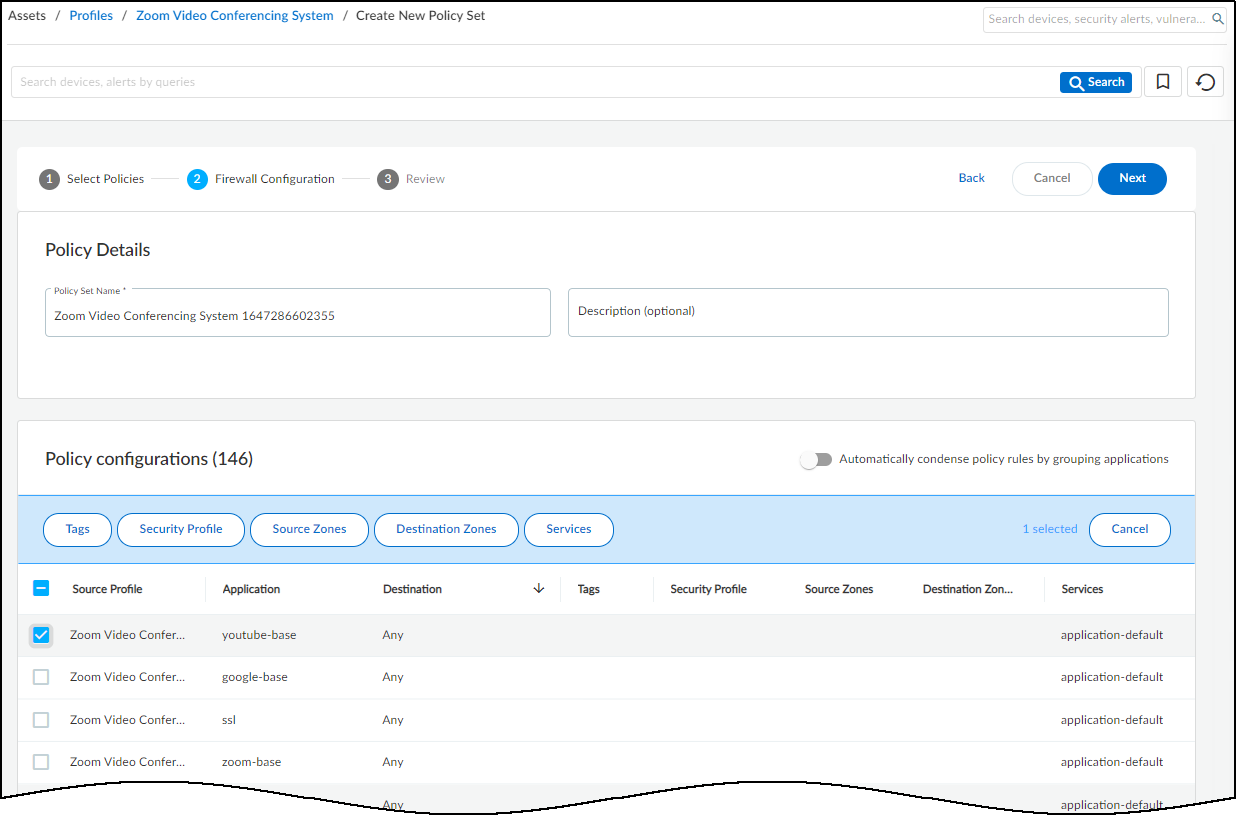
If you want to reduce the number of policy rules that IoT Security generates, enable Automatically condense policy rules by grouping applications . When multiple rules have different applications but everything else is the same—the same destination or set of destinations and, if configured, the same tags, security profiles, source and destination zones, and services—IoT Security gathers them all into a single rule and puts all the applications that had previously been the only differentiating element in the rules into a single list of applications. For example, if this option isn’t enabled (its default state) and there’s one destination for ten different applications, IoT Security creates ten rules. However, if you enable this option, IoT Security creates just one rule that includes a set of ten applications.
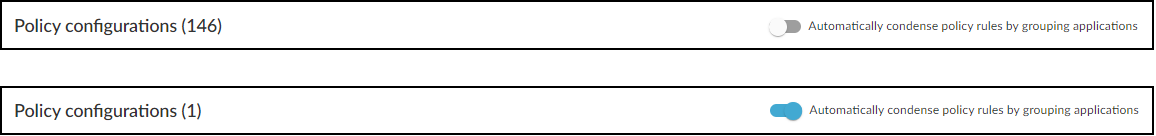
IoT Security always groups destinations together to reduce the number of recommended policy rules. Unlike the application group option, it doesn’t require you to enable it.
Optionally apply tags, a security profile, source and destination zones, and services so that they become part of the policy rules when the Panorama or firewall administrator imports them. This saves the administrator from having to edit imported rules to apply them later. Select the rules you want to apply these to and then click Tags , Security Profile , Source Zones , Destination Zones , or Services at the top of the page to see your choices. Create or select previously-defined options and then click Apply or Create . You can apply one or more tags, source zones, destination zones, and services to the same application.
By default, an application uses its standard port and displays application-default in the Services column. When you edit a service, the Edit Services dialog box shows any non-standard ports that IoT Security has observed an application using plus the two options service-http and service-https. Select the service to use in the rule and click Create .
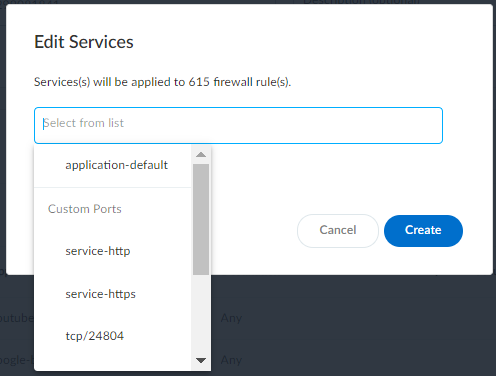
- Carefully review the rule set and then, when you’re satisfied with it, Create the recommended policy rules set.
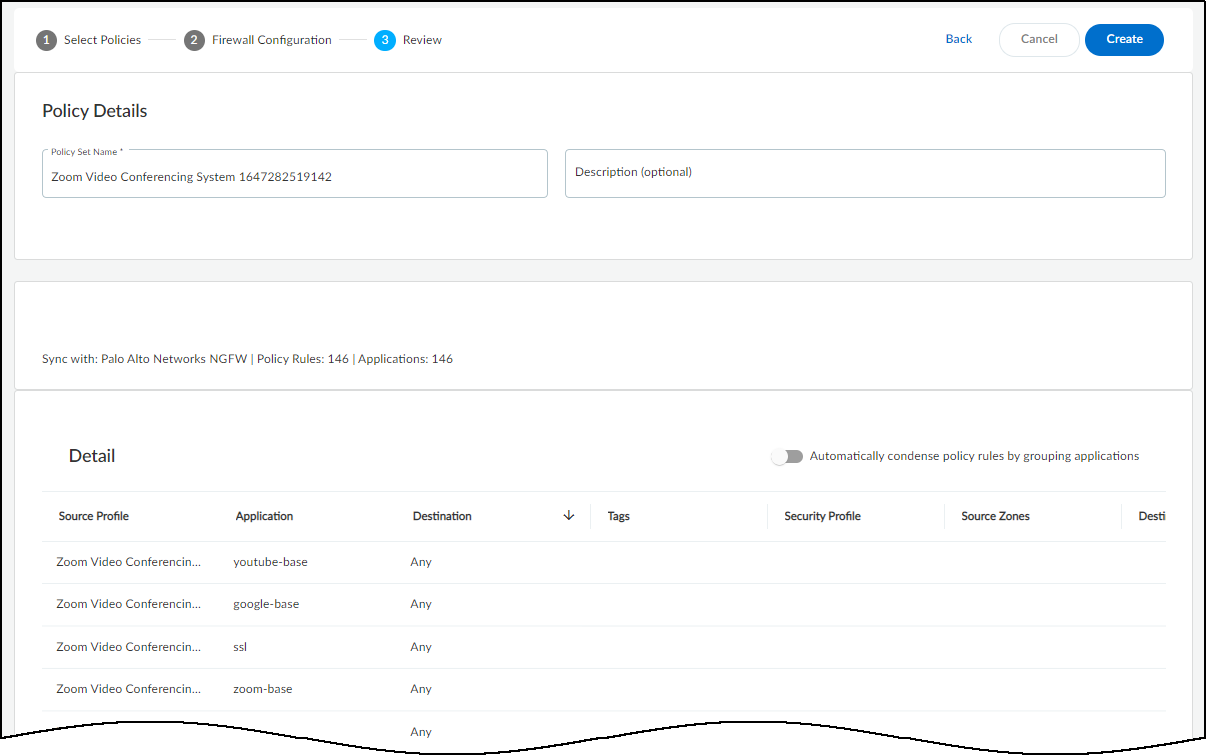
When reviewing the policy set, notice that IoT Security displays the default service ports for many of the allowed applications. These are the service ports that the selected applications have been using on the network during the past month. If an application hasn't been observed in over a month, its service ports will no longer show up in the list.
IoT Security learns the service ports for applications by observing network traffic. Be sure to allow it enough time to collect the session data it needs, keeping in mind that IoT Security needs more time for applications that are used less frequently.
After you click Create, IoT Security creates and saves the policy set. You can view all the policy sets that you created for a device profile on the Policy page . IoT Security also prompts you to activate the policy set, which is necessary to make it available for Panorama and individual firewalls to import.
- To activate a policy set to make it available for Panorama and individual firewalls to import, click Activate Policy Set .
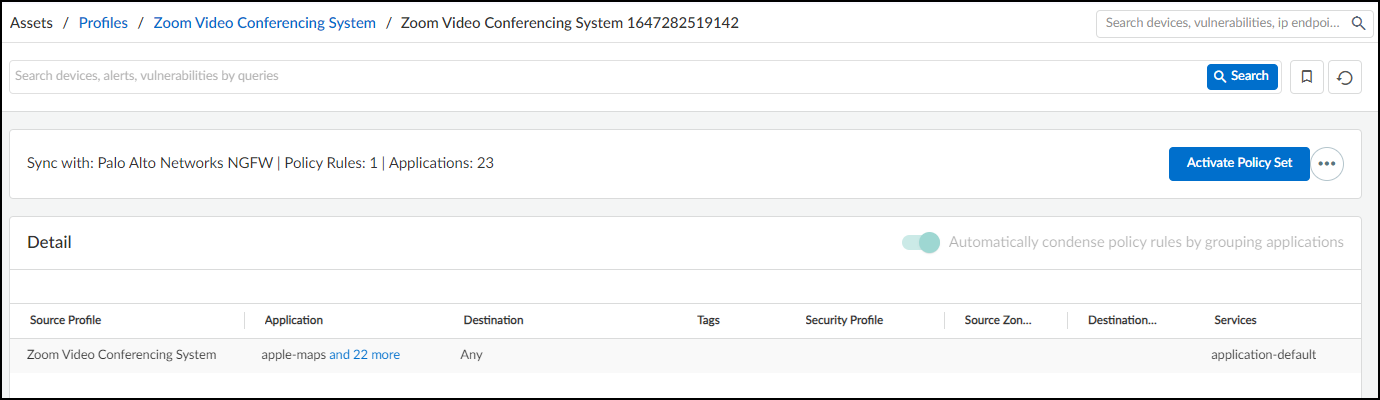
A device profile can have only one active policy set at a time.
If you see anything you want to change before activating the policy set, click the More Actions icon ( … ) and then click Edit . IoT Security returns to the first page (Select Policies) so that you can make the changes.
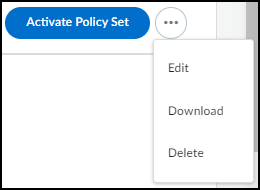
From the same More Actions menu, you can download the policy set as a spreadsheet and you can delete it.
To save the policy set without activating it, navigate to any other page in the IoT Security portal.
Import a Policy Set into Panorama
Create a Policy Set in IoT Security
|
Where Can I Use This? |
What Do I Need? |
|
|
Currently, policy rule recommendations are not supported in multi-vsys firewalls. They must be manually created.
- Log in to your Panorama management server and navigate to PanoramaPolicy RecommendationIoT .
When you do, Panorama fetches the latest active recommendations from the IoT Security cloud. If you already have the Policy Recommendations page open when you activate a policy set in IoT Security—or modify or deactivate an existing active policy set—then you must refresh the page to see the changes. Neither Panorama nor the firewalls cache any policy recommendations.
- Click Import and import the policy rule recommendations to either the pre-rulebase or post-rulebase and then select the rule to place the imported rule after.
Pre-rules are rules written in Panorama that are added before the rules defined locally on a firewall. Post-rules are rules written in Panorama that are added after rules defined on a firewall.
If you don’t select a rule, Panorama places the imported policy recommendations at the top of your rulebase.
So that any other Security policy rules for the same devices as those in the recommended rules do not occlude them, position the recommended rules before the others in the rulebase.
- Click OK .
The import operation automatically creates the supporting objects a policy rule requires—device objects, service objects, address objects—and then it creates the policy rule itself.
You can either apply a log forwarding profile to each policy rule manually or—before importing the rule recommendations—create a log forwarding profile and name it “default” to have it applied automatically. See the section about log forwarding profiles in Prepare Your Firewall for IoT Security and also Configure Policies for Log Forwarding .
- Commit the configuration change.
For more information about importing a policy set into Panorama (and directly into firewalls), see Configure Device-ID .
Restrict Network Access
Import a Policy Set into Panorama
|
Where Can I Use This? |
What Do I Need? |
|
|
Although policy recommendations enforce trusted behaviors for IoT devices, they only take effect when device behavior changes. However, if IoT Security detects elevated risk on a device, perhaps caused by business-critical devices running obsolete operating systems, and you want to take preventive action before an exploit is launched, you need to take a different approach from behavior-based policy rules.
IoT Security provides another option that lets you restrict network access to a specific IoT device or group of IoT devices that have the same issue, such as those susceptible to or suspected of compromise.
To accomplish this, first create a Security policy rule in which Source Device is any device whose category is “Restricted” and the action in the rule is Deny. Position this rule above all other device-based rules in the rules list. Otherwise, there’s a chance that a rule based on the profile attribute, or on some other attribute, will occlude it. Similarly, make sure the “Restricted” rule is above any rule that might occlude it, even those not using Device-ID.
Then, in the IoT Security portal, enable the network traffic restriction feature but don’t use it to restrict access yet. Notice that firewalls won’t apply the new rule because none of the IP address-to-device mappings have a category attribute that matches “Restricted”.
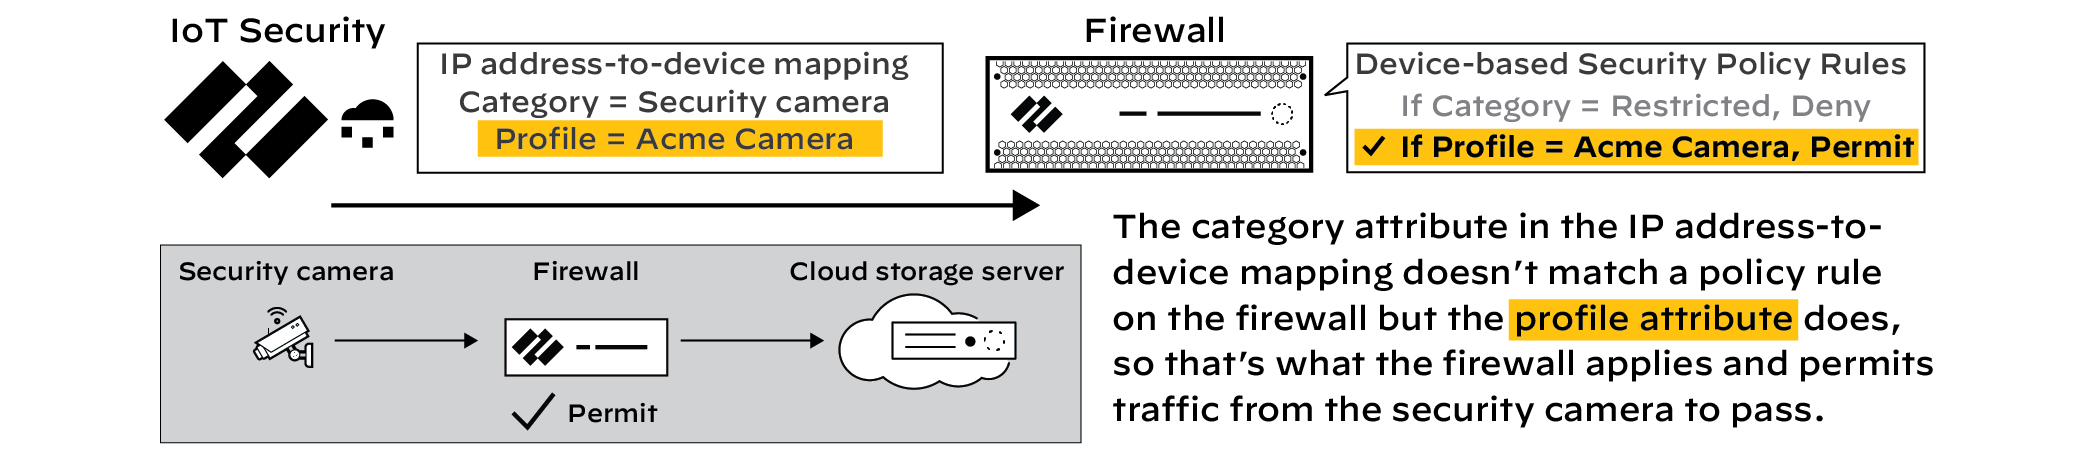
When you restrict network access for one or more devices, IoT Security immediately changes the category attribute for them from their real device categories to “Restricted” and sends firewalls new IP address-to-device mappings for them. When traffic reaches a firewall from a device with the “Restricted” category attribute, it applies the security rule you created, denying it access to the network.
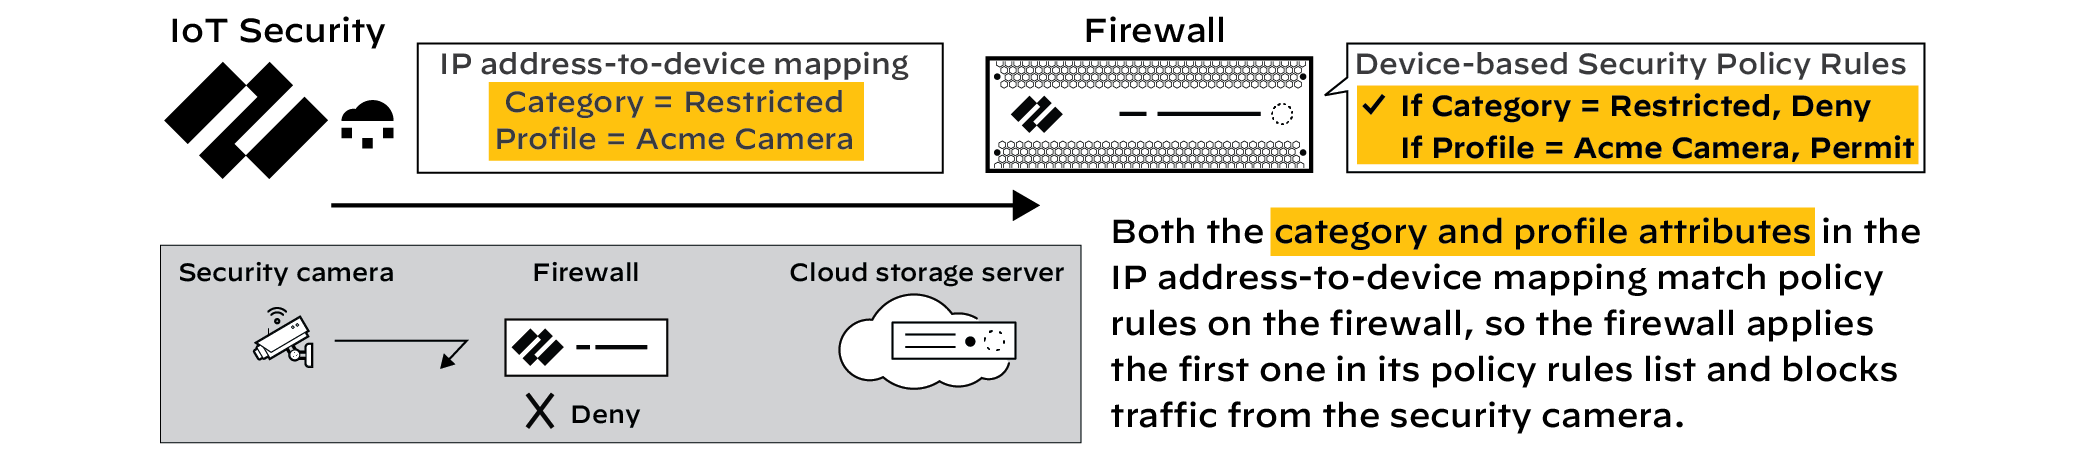
Although the accompanying illustrations show how a firewall enforces a “category=Restricted” rule instead of another device-based Security policy rule, it’s not necessary for the other rule to be device based. You can also restrict network access for an IoT device even when a firewall permits its access based on source IP address, service, application, or any other factor or combination of factors.
Later, after the security issue is resolved, you derestrict devices, which returns the IP address-to-device mapping for them to their previous categories. As a result, their category attributes no longer match the “Restricted” rule and the devices will be permitted to access the network as determined by other rules.
Notes:
- To support Device-ID and IP address-to-device mappings, firewalls must be running PAN-OS 10.0 or later. To support the traffic restriction feature, firewalls must have device dictionary file 16-253 or later. Both the PAN-OS software version and device dictionary version appear in the General Information section on the PAN-OS web interface Dashboard.
- Traffic restriction is only applicable for devices with a high identity confidence score of 90 or above.
A confidence score indicates the level of confidence IoT Security has in its identification of a device. IoT Security has three confidence levels based on calculated confidence scores: high (90-100%), medium (70-89%), and low (0-69%).
- This feature restricts network access but doesn’t completely quarantine a device. Depending on network design, a restricted device can still access those parts of the network it can reach without traversing a firewall.
- Only an IoT Security user with owner privileges can enable and disable the feature.
- Configure a Security policy rule that denies traffic from any device whose Device-ID attribute for Category is “Restricted”.
These instructions explain how to configure a security policy rule in the PAN-OS web UI. You can also configure it through Panorama.
Log in to the web UI on your firewall, click PoliciesSecurity , and then click Add to create a new Security policy rule. On the General tab, enter a name for the rule such as Restrict IoT network access .
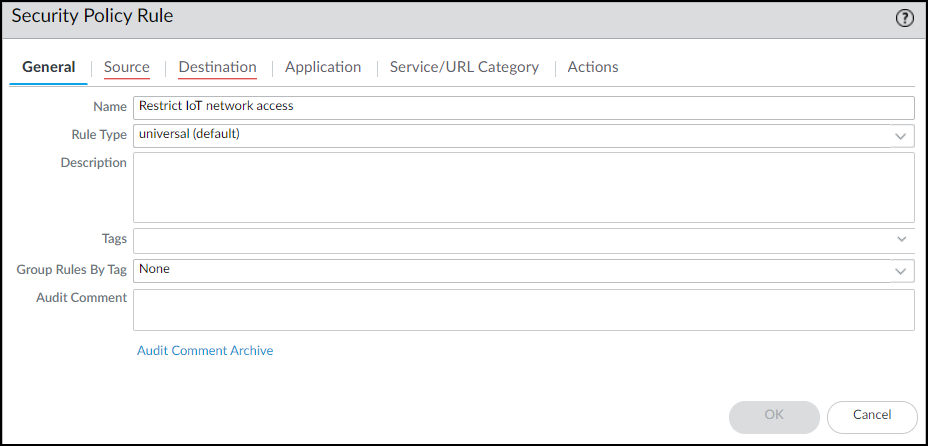
On the Source tab, click Add in the Source Device section and then click Device . In the Device Object dialog box that appears, enter a name, choose Restricted for Category, and then click OK .
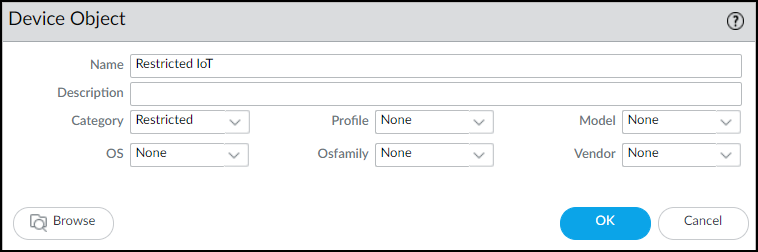
Select the device object you just created as the source device and select Any for the source zone and address.
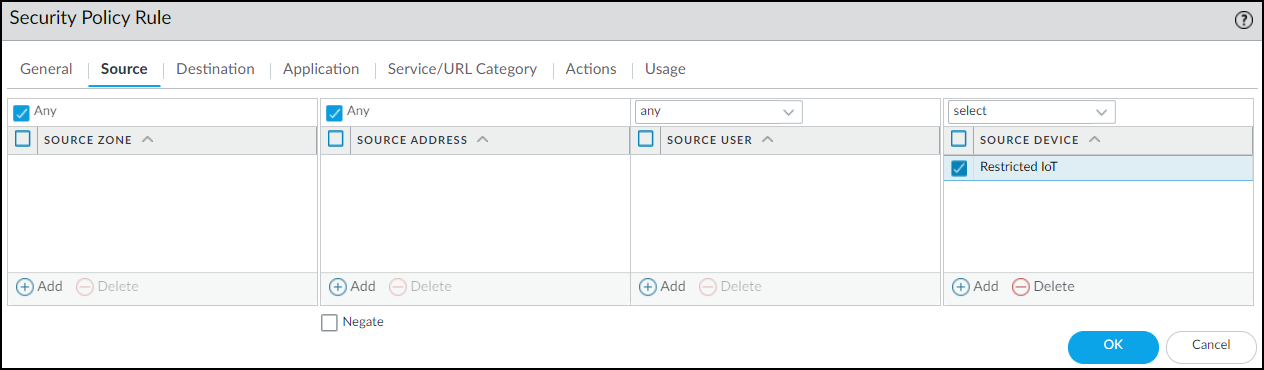
On the Destination tab, select Any for the destination zone, address, and device.
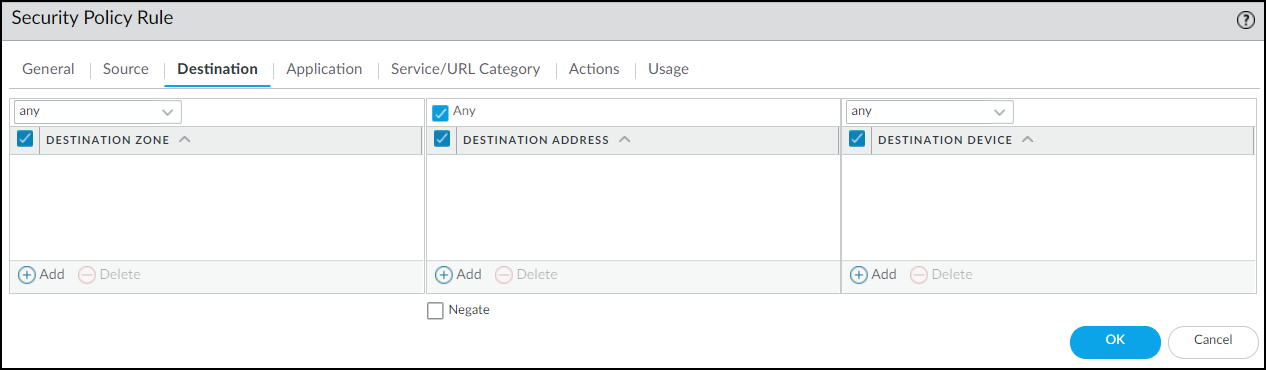
On the Actions tab, choose Deny as the action. If the firewall forwards logs to Strata Logging Service, Panorama, or some other external log server, choose a log forwarding profile. Even for a rule that denies traffic, logs provide visibility into what the restricted device was attempting to connect with and are useful during remediation. Click OK to save the Security policy rule configuration.
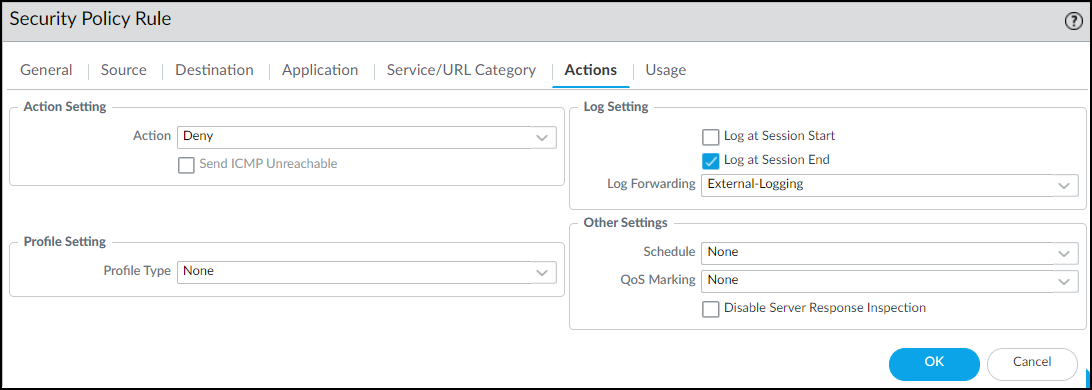
Move the rule above other policy rules.

- Enable traffic restriction in the IoT Security portal.
Log in to the IoT Security portal with owner privileges, click Policy SetsSettings , and then toggle Restrict device traffic via firewall policy .
The following user roles have IoT Security owner privileges: account administrator, app administrator, instance administrator, and owner.
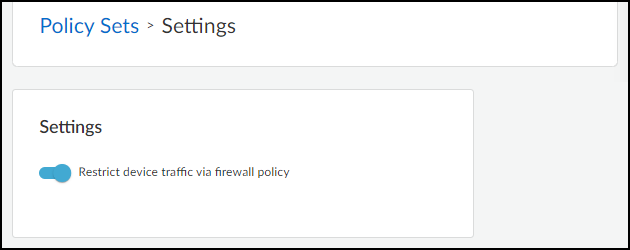
A pop-up panel appears. Read how traffic restriction works and then click Next .
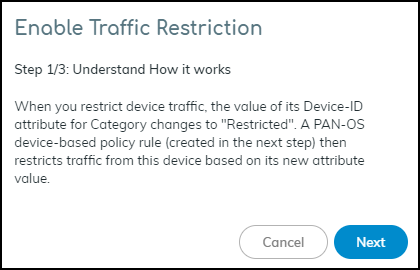
Select I have created the policy and then click Next .
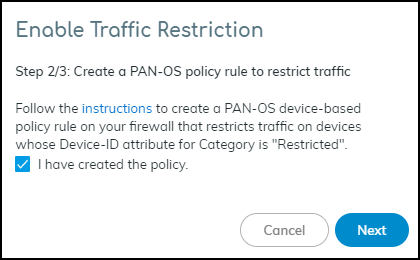
Read where to restrict traffic in the IoT Security portal and then click Enable .
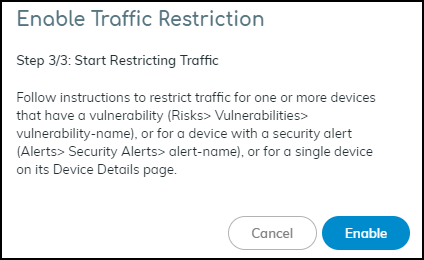
- Restrict IoT devices.
As stated in step 3/3 of the Enable Traffic Restriction panel, there are three places in the IoT Security portal where you can restrict network traffic: vulnerability instances on a Vulnerability Details page, a Security Alert Details page, and a Device Details page. Each place, or point of restriction, is described below.
Although only an owner can enable and disable the ability to restrict network traffic, either an owner or an administrator can use the feature to impose a restriction on a device or release one from restriction. For more information about user roles, see Create IoT Security Users .
Vulnerability Instance as the Point of Restriction
To restrict one or more IoT devices on the Vulnerability Details page, click RisksVulnerabilities and then click a vulnerability name.
If the Confidence Level column is hidden, click the Columns icon (
![]()
) and select it. Select one or more vulnerability instances with a high confidence score of 90 or above and then click MoreRestrict Traffic .
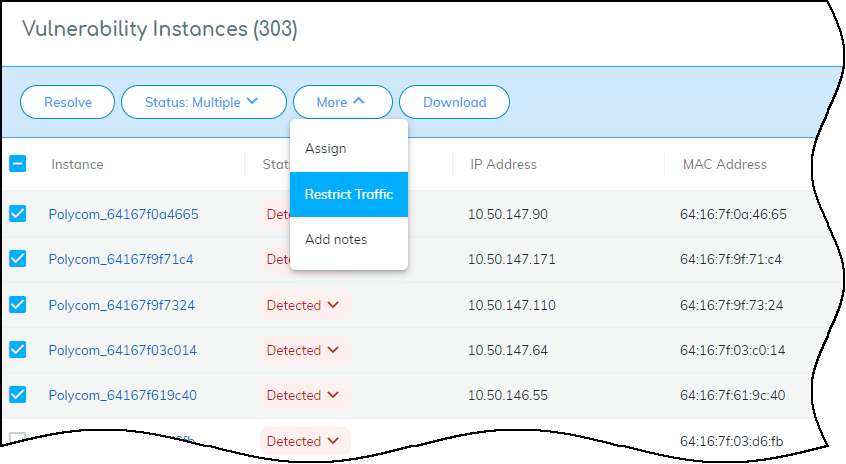
Review the list of vulnerable or potentially vulnerable devices whose traffic will be restricted, optionally add a note for future reference, and then click Confirm .
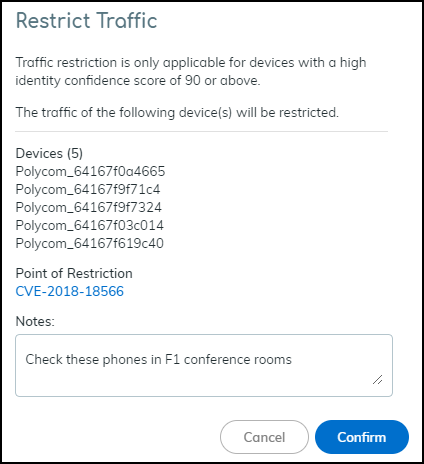
The entry for this device in the Restricted Traffic column changes from No to Yes , indicating that its traffic is being restricted. If you don’t see the Restricted Traffic column, click the Columns icon (
![]()
) and select Restricted Traffic . A new entry appears in the Vulnerability Responses column. Hover your cursor over the entry to see a history of actions taken.
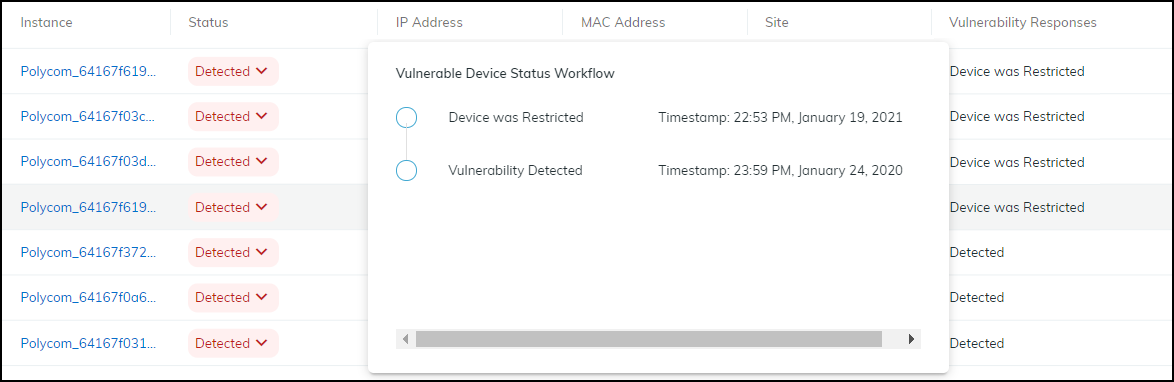
The Device Details page for the traffic-restricted device adds a Restricted Device label next to the device name. If you hover your cursor over the label, a pop-up appears with the time and point of restriction and a link to a vulnerability, security alert, or device details page. In this case, it would be a link to a Vulnerability Details page. The pop-up also includes any notes you made.
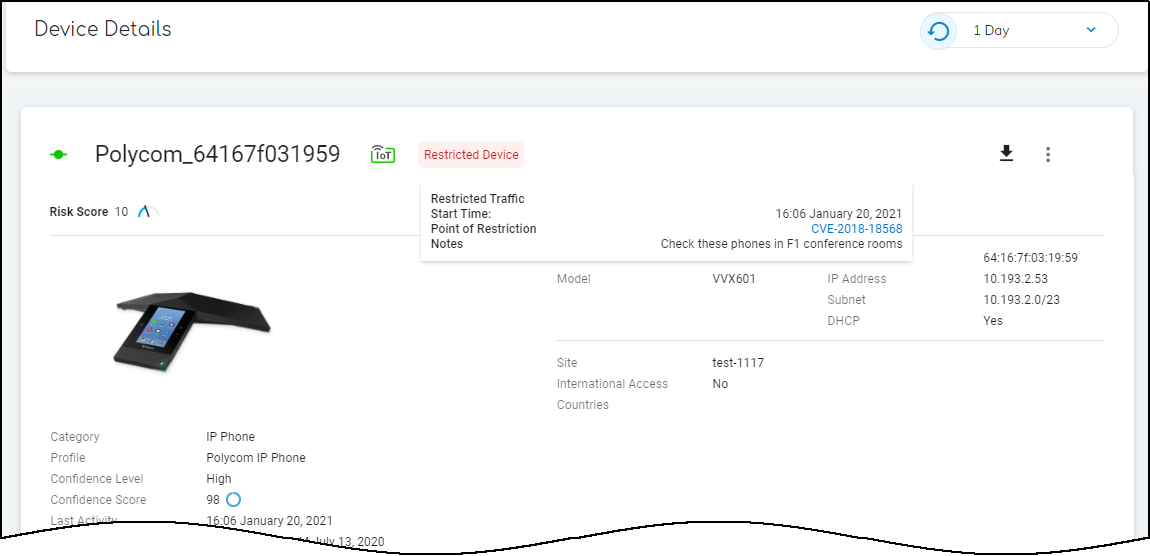
Security Alert as the Point of Restriction
To restrict an IoT device with a specific security alert, click AlertsSecurity Alerts and then click an alert name. On the Alert Details page, click ActionRestrict Traffic .
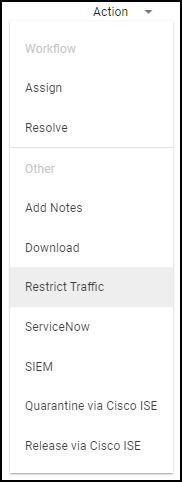
If the confidence score of the impacted device is below 90, the following message appears. The confidence score appears in the Impacted Device section on the Alert Details page.
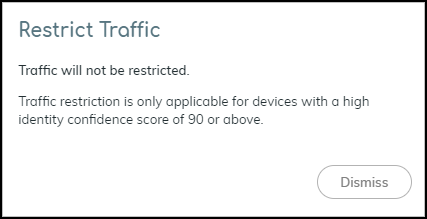
If the confidence score is 90 or above, the Restrict Traffic dialog box appears.
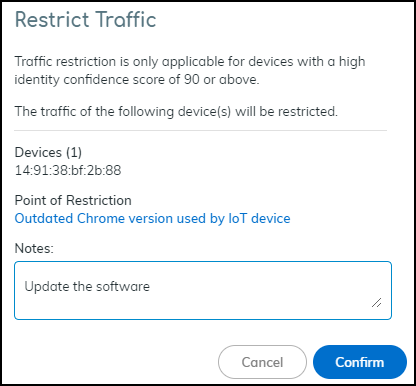
Review the device whose traffic will be restricted, optionally add a note for future reference, and then click Confirm .
A new label appears at the top of the Alert Details page stating Traffic Restricted Yes and a new entry appears in the Alert Events column.
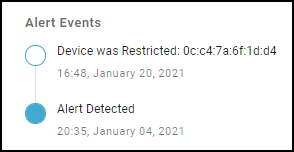
The Device Details page for the traffic-restricted device adds a Restricted Device label next to the device name. When you hover your cursor over the label, a pop-up appears with the time you started restricting traffic; a link to the point of restriction, which in this case would be to a Security Alert Details page; and any notes you made.
IoT Device Details as the Point of Restriction
To restrict a single IoT device on the Device Details page, click Devices and then the name of one of the devices in the inventory table. In the Identity section at the top of the Device Details page, click the Action icon (three vertical dots) Restrict Traffic .
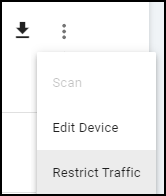
Check that the device whose traffic will be restricted is correct, optionally add a note for future reference, and then click Confirm .
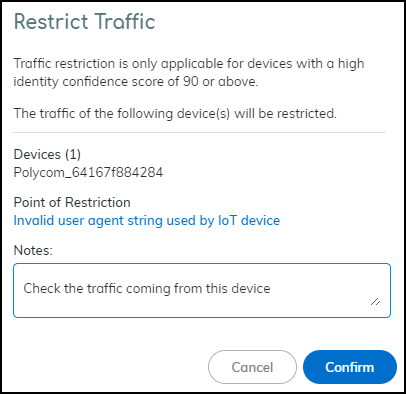
The IoT Security portal adds a Restricted Device label next to the device name on the Device Details page. When you hover your cursor over the label, a pop-up appears with the time you started restricting traffic; a link to the point of restriction, which in this case would be to the same Device Details page you’re already on; and any notes you made.
On the Devices page, the entry for this device in the Restricted Traffic column changes from No to Yes , indicating that its traffic is being restricted. If you don’t see the Restricted Traffic column, click the Columns icon (
![]()
) and select Restricted Traffic in the Traffic section.
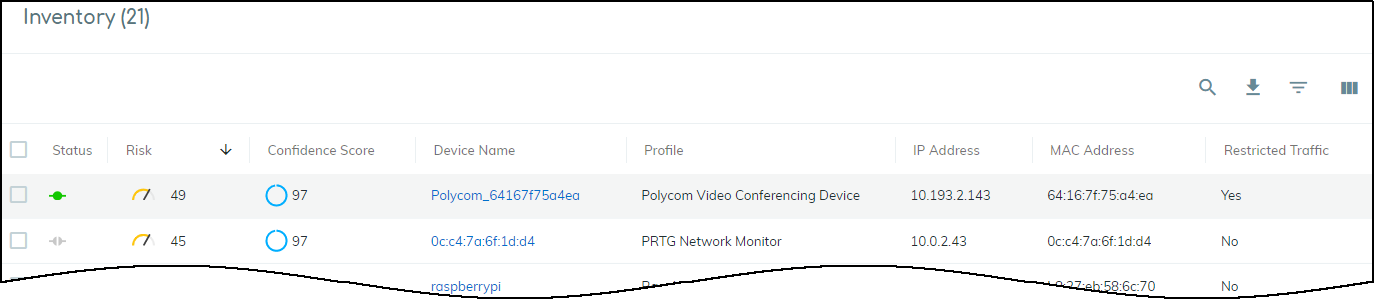
- View all restricted devices.
On the Policy Sets page, click the number of restricted devices displayed in the Overview panel.
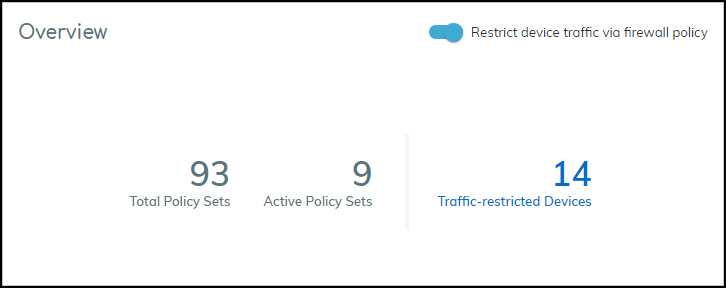
The Devices page opens with a filter applied to show only restricted devices in the inventory table.
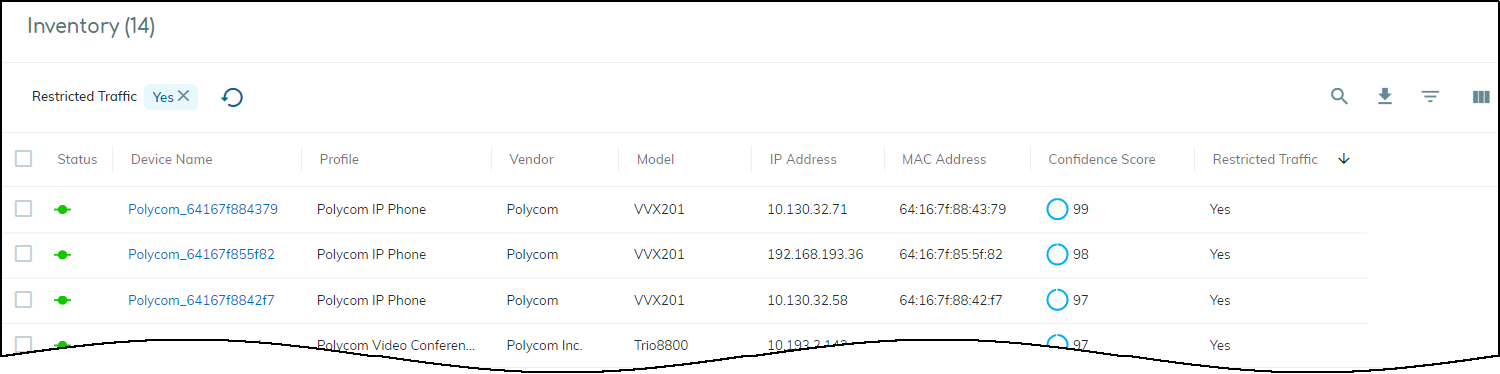
- After investigating and remediating a traffic-restricted device, derestrict traffic for it.
To derestrict traffic for a device, repeat the same process as you did to restrict traffic but click Derestrict Traffic .
You can derestrict multiple vulnerability instances in bulk. Select one or more instances on the Vulnerability Details page and then click MoreDerestrict Traffic .
For other traffic-restricted devices, view the inventory on the Devices page with the Restricted Traffic filter applied. Then click device names one by one to open the Device Details page for each one and click the Action icon (three vertical dots) Derestrict Traffic .
To disable the feature completely, click Policy Sets , toggle off Restrict device traffic via firewall policy , and then Confirm the action. When you do, IoT Security cancels all existing device traffic restrictions. It also changes the entries in the Vulnerability Response column (Risks > Vulnerabilities > vulnerability_name) and Last Action column (Alerts > Security Alerts) for these devices to Device was derestricted .
Medical IoT
|
Where Can I Use This? |
What Do I Need? |
|
|
IoT Security provides a means to monitor how its supported categories of medical IoT imaging devices and infusion systems are utilized and if vendors have issued recalls on medical equipment in your network. It also supports the upload of MDS2 files, which it uses to discover vulnerabilities and raise security alerts for medical IoT devices. These features work together to provide a holistic view of your medical device ecosystem.
When you use the Medical IoT Security portal theme, the IoT Security portal displays the biomedical and utilization dashboards. The biomedical dashboard provides a high-level overview of your devices, including their status, risk levels, and other key metrics to quickly assess the health and security posture of your medical device fleet. The utilization dashboard adds another layer of insight by providing data on how your medical devices are being used. This feature helps you optimize your device allocation, identify underutilized assets, and make informed decisions about device procurement and retirement.
To augment information about medical devices, Medical IoT Security helps you manage Manufacturer Disclosure Statement for Medical Device Safety (MDS2) documents. You can upload your MDS2 documents to Medical IoT Security and join the MDS2 Community. The MDS2 Community feature lets you leverage crowd-sourced information about medical devices, helping you identify and categorize devices more accurately and stay informed about potential security risks.
Additionally, if active recalls affect any of your medical devices, Medical IoT Security displays a Recalls page. This page lets you track and manage device recalls by alerting you to affected devices and helping you prioritize your response.
By combining inventory management, utilization data, community-sourced information, and recall tracking, Medical IoT Security enables you to:
- Maintain an accurate and up-to-date inventory of medical devices
- Identify and mitigate security risks promptly
- Ensure compliance with regulatory requirements
- Optimize device allocation and utilization
- Make data-driven decisions about device lifecycle management
By providing a unified platform for managing these various aspects of medical device security and operations, Medical IoT Security addresses the complex challenges and regulations faced by healthcare organizations in today's interconnected and technology-driven healthcare environment.
Biomed Dashboard
|
Where Can I Use This? |
What Do I Need? |
|
|
IoT Security gathers statistics about medical IoT devices it’s monitoring, assesses their risk, and displays its findings on the Biomed dashboard. You can leverage this data to track medical device inventory and utilization as well as evaluate and address the risk of medical IoT devices.
To view the Biomed dashboard, make sure Medical IoT Security is the activated vertical theme for your portal and then select Dashboard and choose Biomed from the Manage Dashboards drop-down list.
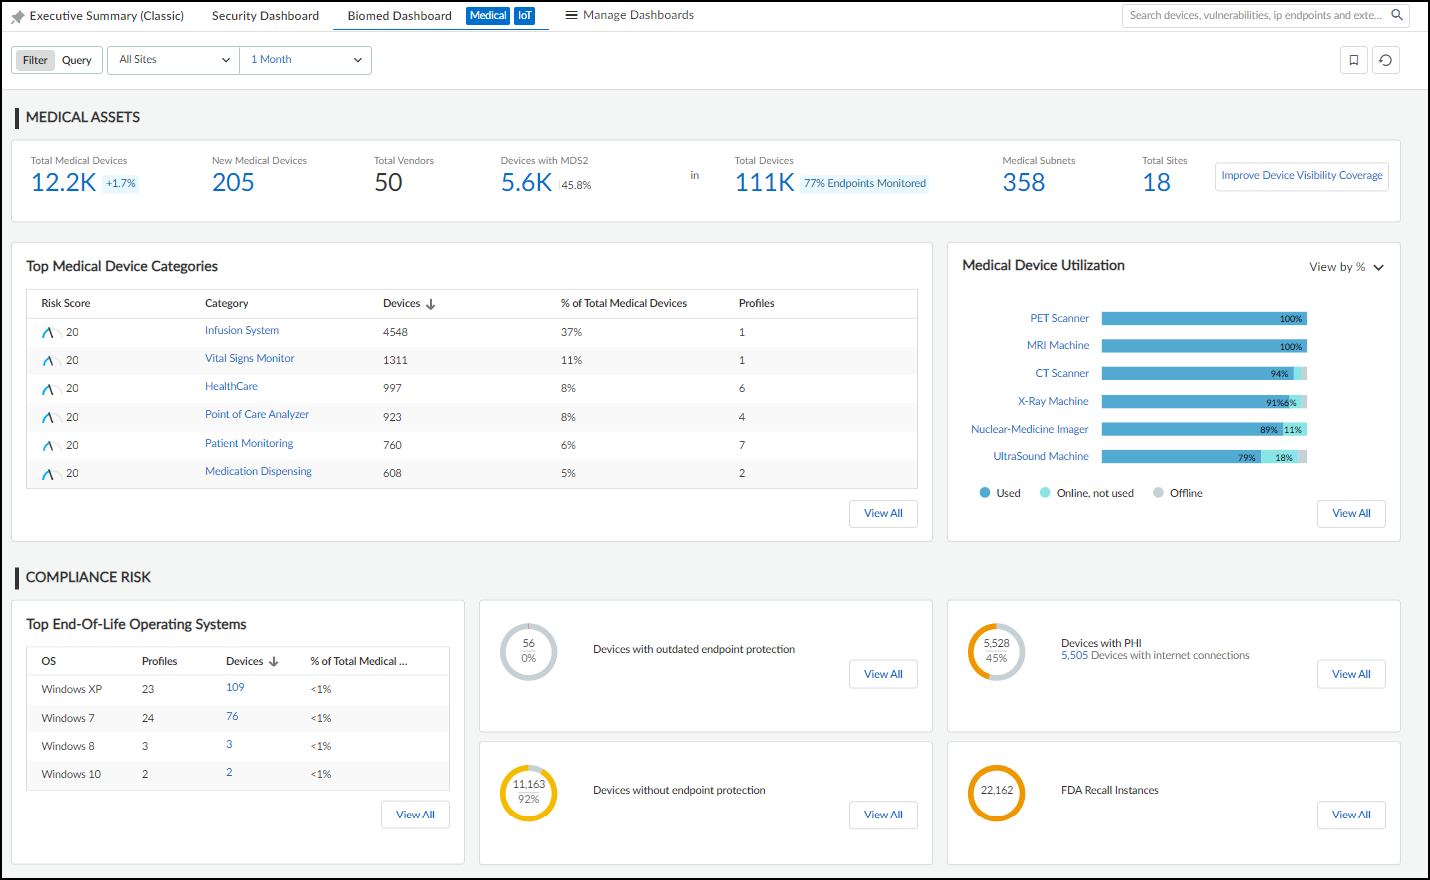
The dashboard is organized into three broad sections. At the top is a set of filters for sites and time ranges. Directly below that is the Medical Assets section, which has a high-level summary of medical device information and two panels showing top medical device categories and medical device utilization. At the bottom of the dashboard is the Compliance Risk section, which has several panels showing potentially risky types of medical devices.
Medical Assets
At the top of the Medical Assets section is a list of totals for all medical IoT devices, new medical IoT devices, their vendors, and those medical IoT devices with MDS2 forms. To provide context for these numbers, the totals for all devices, subnets, and sites in the network are also provided.
In more detail, the high-level summary contains the following device statistics:
- Total Medical Devices : This is the total number of medical IoT devices whose traffic was detected on the network at the sites and during the time range set on the Biomed dashboard. Clicking the total opens the AssetsDevices page to show entries for all medical devices detected within the defined site and time-range filters.
- New Medical Devices : This is the number of medical devices that IoT Security discovered at the specified sites and within—but not before—the specified time range. Clicking the total opens the AssetsDevices page to show just entries for the medical devices discovered within the defined site and time-range filters.
- Total Vendors : This is the number of vendors for medical devices referenced in Total Medical Devices.
- Devices with MDS2 : This is the number of medical devices for which IoT Security has an MDS2 form.
- Total Devices : This shows the total number of devices on the network as determined by the sites and time range filters set on the Biomed dashboard and the global filter for device type set on another page such as Devices. Clicking the number opens the AssetsDevices page to show device entries matching defined filters for site, device type, and time range.
- Medical Subnets : This is the total number of subnets containing medical devices as determined by the site and time range filters set on the Biomed dashboard and the global filter for device type set on another page such as Devices. Clicking the number opens the NetworksNetworks and SitesNetworks page.
- Total Sites : This is the absolute total number of sites for the tenant regardless of the current site and time range filters set on the Biomed dashboard and the global filter for device type set on another page. Clicking the number opens the NetworksNetworks and SitesSites page.
- Improve Device Visibility Coverage : This button opens the Data Quality Diagnostics page ( AdministrationData Quality ). There you can see the quality of data that IoT Security is receiving. In particular, the page focuses on IP endpoints and low-confidence devices, how they can lower data quality, and ways to reduce their numbers through improved network coverage.
The two panels in the Medical Assets section contain information about the main categories of medical IoT devices and their utilization:
- Top Medical Device Categories : This panel lists the medical device categories and ranks them by device count, with those that contain the largest number of medical devices at the top. Clicking a category name opens a new browser window displaying the AssetsDevices page filtered to show just entries matching this category. Clicking View All in the lower right opens the AssetsDevices page filtered to show all medical devices.
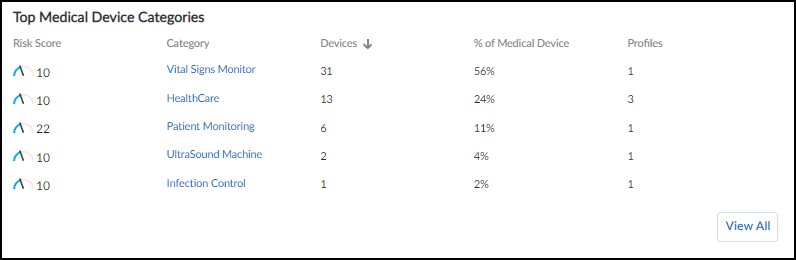
- Medical Device Utilization : This panel shows all medical IoT categories and how the devices in each one are being utilized. A bar chart shows the percentages of time the devices in a category are detected in use, online but not in active use, and offline. Hover your cursor over a bar to see a pop-up with numbers for each kind of utilization. Click a medical device category to open the AssetsDevices page in a new browser tab or window. The page is filtered to show devices in the selected category.
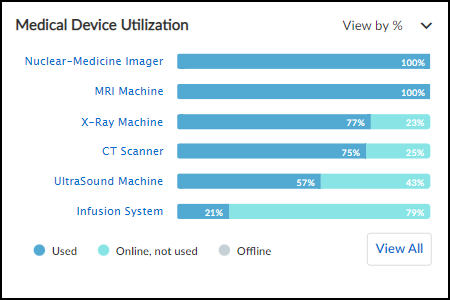
Compliance Risk
This section of the dashboard shows information about medical IoT devices that affect their risk exposure.
- Top End-of-Life Operating Systems : These are devices running an OS version that the vendor no longer supports with patch updates, making them more vulnerable to attack. The table shows how many device profiles have devices with an end-of-life OS and the percent of affected medical devices relative to all medical devices. Clicking a number in the Devices column opens the AssetsDevices page filtered to show only devices running this operating system and version.
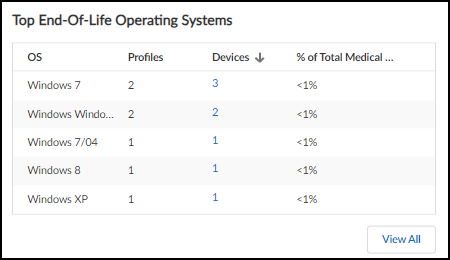
- Devices with various risk factors are listed. For each one the total number of devices with this risk and their percent relative to all medical IoT devices are shown. Clicking View All for the first three opens the AssetsDevices page with a filter to show just these devices. Clicking View All for Devices with FDA recalls opens the VulnerabilitiesRecalls page.
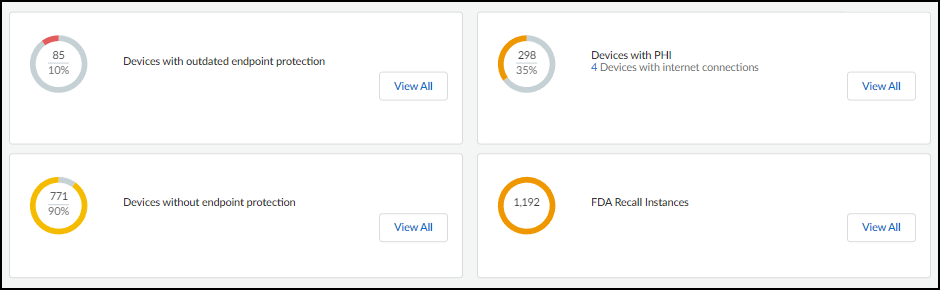
Devices with outdated endpoint protection : These are devices that have endpoint protection, such as anti-virus protection, but they haven't communicated with their vendor and haven't been updated in over a month. This makes them vulnerable to new types of attacks released since their last update.
Devices without endpoint protection : These are devices that do not have any endpoint protection installed on them.
Devices with PHI : These devices contain personal health information (PHI).
FDA Recall Instances : This shows the total number of devices that have been issued a recall order by the Food and Drug Administration (FDA) because of a product flaw that affects safety and requires it to be fixed or replaced.
Utilization Dashboard
|
Where Can I Use This? |
What Do I Need? |
|
|
When the IoT Security portal theme is Medical IoT Security, you can see the Utilization dashboard. IoT Security gathers utilization statistics and metrics about the medical IoT devices it is monitoring and displays them on this dashboard. You can then leverage this data to minimize device downtime, reduce total cost of ownership (TCO), and increase revenue through better capital planning. In addition to minimizing downtime and maintenance, you can also use the gathered data to identify unused assets (possibly broken or misplaced) and ensure safe and secure device disposal at the end of the IoT device life cycle.
Make sure the application content version on your firewalls is 8367-6513 or later; that is, the major version, which is identified by the first four digits, is 8367 or above (8368, 8369, 8370, and so on), starting from 8367-6513. These versions include healthcare-specific applications that allow IoT Security to discover medical equipment and provide utilization data. They also allow firewall security policy rules to include healthcare-specific applications.
To view the Utilization dashboard, select Dashboards and then choose Utilization from the Manage Dashboards drop-down list.
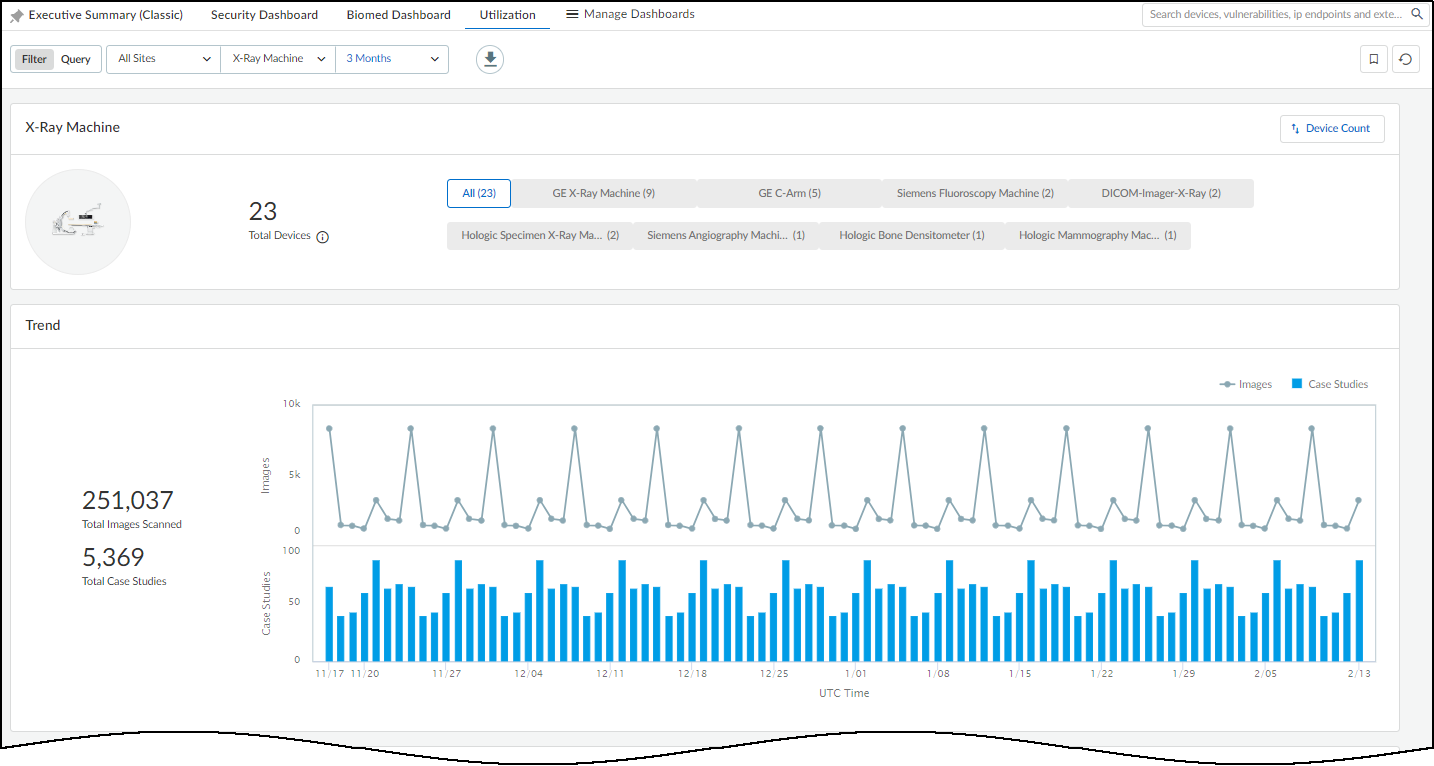
The dashboard is organized into two broad sections. At the top is a set of filters for sites, medical IoT device categories, and time ranges that control what appears on the page. Below the filters are information panels that display various types of information about how medical IoT devices are being utilized.
In addition to viewing the dashboard in the IoT Security portal, you can download its data as an Excel spreadsheet. Click the Download icon to the right of the top filters, set the filters to include the data you want to save, and then click Download .
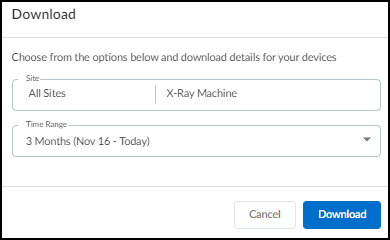
IoT Security creates an Excel file with the details you specified on multiple tabs and makes it available for download.
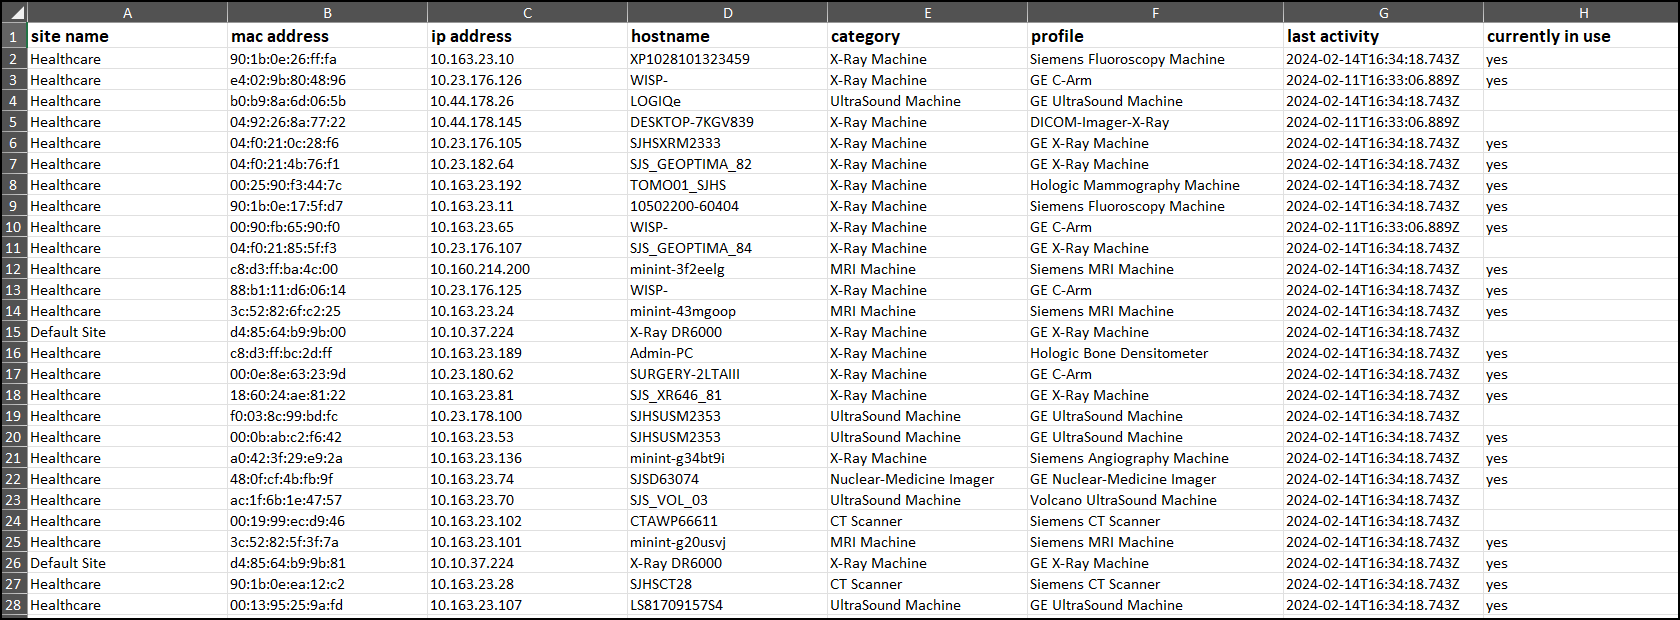
Utilization Dashboard Filters
Utilization Information Panels
|
Where Can I Use This? |
What Do I Need? |
|
|
At the top of the dashboard are filters for sites, medical IoT device categories, a time range (1 week, 1 month, or 3 months), and device profiles. The filters determine the data that appears throughout the dashboard.
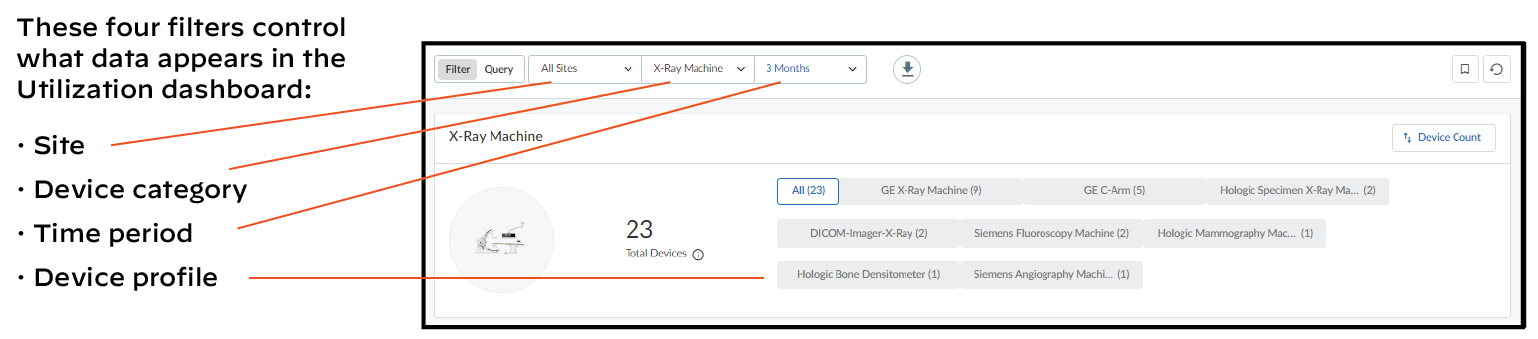
Sites : The choice of site filters includes All Sites and one or more individual sites. IoT Security site filters provide great flexibility by letting you combine multiple selections.
Medical IoT device categories : The contents of this list are dynamically determined by the devices discovered on your network and are listed in alphabetical order. When you initially navigate to the Utilization dashboard, it uses the filter for whatever device category comes first alphabetically. If you change the category filter, navigate away, and then return to the Utilization dashboard, it remembers your previously chosen filter and continues to use it.
The following are the supported medical IoT device categories that can appear as filters based on whether such devices are found on your network:
- CT scanner
- Infusion System
- MRI Machine
- Nuclear-Medicine Imager
- PET Scanner
- UltraSound Machine
- X-Ray Machine
Time range : The time range filters for the Utilization dashboard consist of 1 Week, 1 Month, and 3 Months, referring to the last seven days, last 30 days, or last 90 days. When you initially navigate to the Utilization dashboard, it inherits the time filter set on another page or dashboard. If the time filter is not 1 Week, 1 Month, or 3 Months, the inherited filter is still displayed but the contents on the dashboard are set for 1 month.
Together with the filters for sites and medical IoT device categories, the time filter determines the scope of data in the information panels. However, the device total shown in the device profile filter is always for the past year regardless of the time range filter.
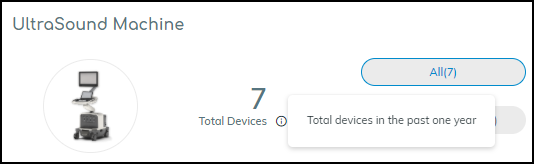
Device profiles : Below the page title and top filters bar is a panel with the total number of medical IoT devices in the selected device category during the past year and the device profiles within that category to which devices belong. These profiles are additional filters that allow you to zoom in on utilization details from the broader device category level to individual device profiles.
By default, the Utilization dashboard displays device profiles in order from those with the most devices to those with the least. To list them alphabetically, click Device CountProfile Name .
In addition, the Utilization dashboard displays data for all device profiles within the category encompassing them by default. To filter it further, select a device profile.
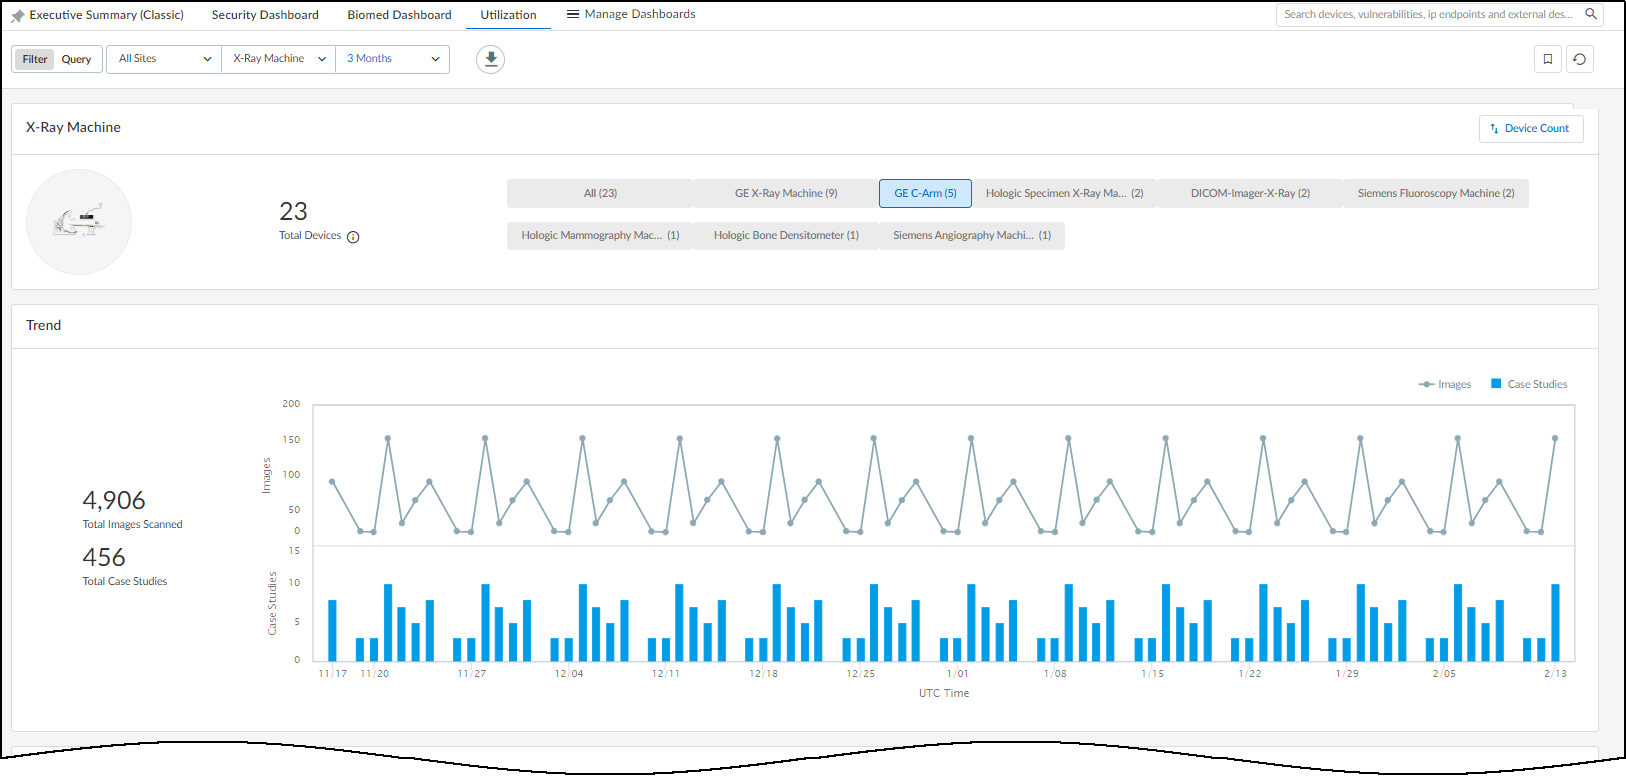
Utilization Information Panels
|
Where Can I Use This? |
What Do I Need? |
|
|
The Utilization dashboard contains various information panels. The types of panels differ depending on the medical IoT device category filter you select.
Data does not immediately appear in the Utilization dashboard. It requires a minimum of 24 hours to collect enough data to populate the information panels with meaningful data.
Trend – The Trend information panel displays graphs that help you spot trends in the way your devices are being used.
For medical imaging devices, the Trend panel shows two graphs. The line graph shows the number of images taken at intervals throughout the period set as the time filter. The bar graph shows the total case studies created during the same period. At a glance, you can see patterns of activity and any periods of lulls and spikes. Hovering your cursor over a data point shows the number of images and case studies at that point. If you only want to see one chart or the other, click Images or Case Studies in the upper right corner of the Trend panel to show or hide them. If you want to focus attention on one graph but not completely hide the other, hover your cursor over Images or Case Studies to cause the other one to fade.
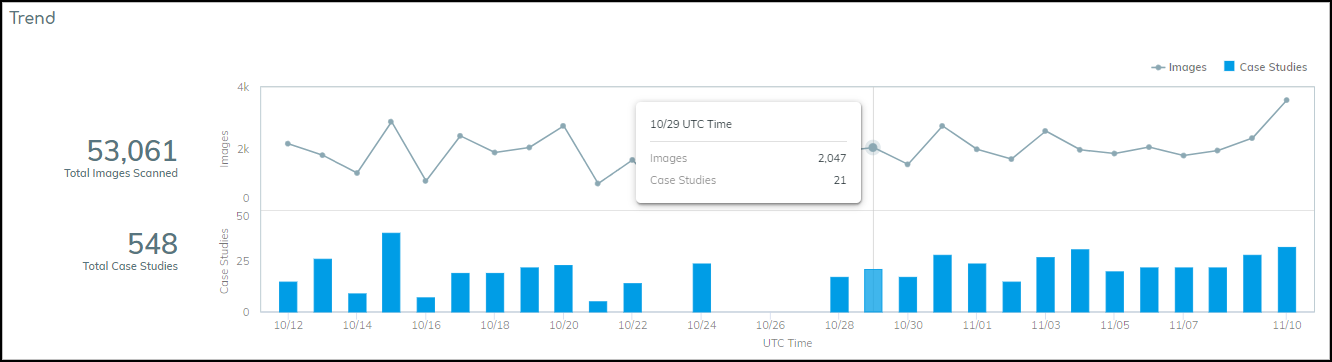
For infusion systems, the Trend panel displays a line graph to track the number of systems in use and the number connected to the network (online) but not necessarily in use. If all connected infusion systems were both connected and in use, the two lines appear to be a single line because all their data points align. However, if you hover your cursor over Devices Used or Devices Online Only in the upper right corner of the Trend panel, you can show or hide one line or the other. Hover your cursor over a data point to see the number of devices that were used and those that were connected at that point.
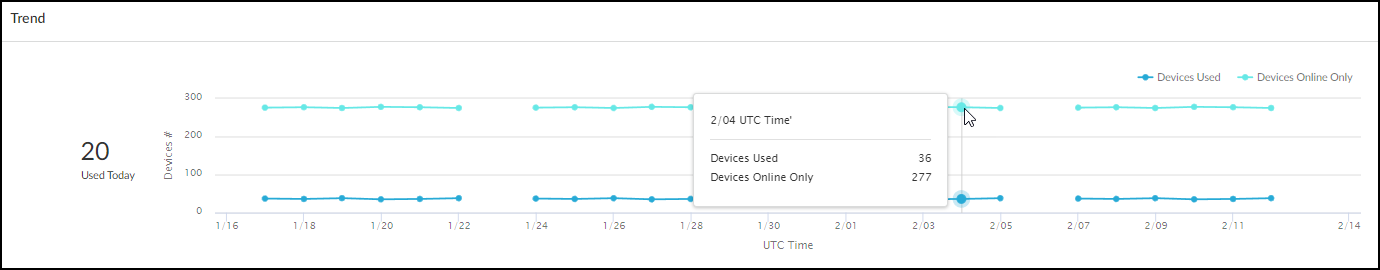
The number that appears to the left of the chart is not an overall total. It shows how many infusion systems were used today, using the most recent time for which a total can be calculated.
Imaging Scan Analysis – This panel summarizes the sections of the human body that were scanned by imaging devices. It is shown for all DICOM devices except ultrasound equipment, which doesn’t identify scanned body parts in its traffic.
The panel is divided into two sections. On the left is a human figure consisting of four major anatomical regions:
- Head and Neck
- Upper Extremity
- Trunk
- Lower Extremity
There is a fifth grouping called "Other". This is for scans that are unidentifiable.
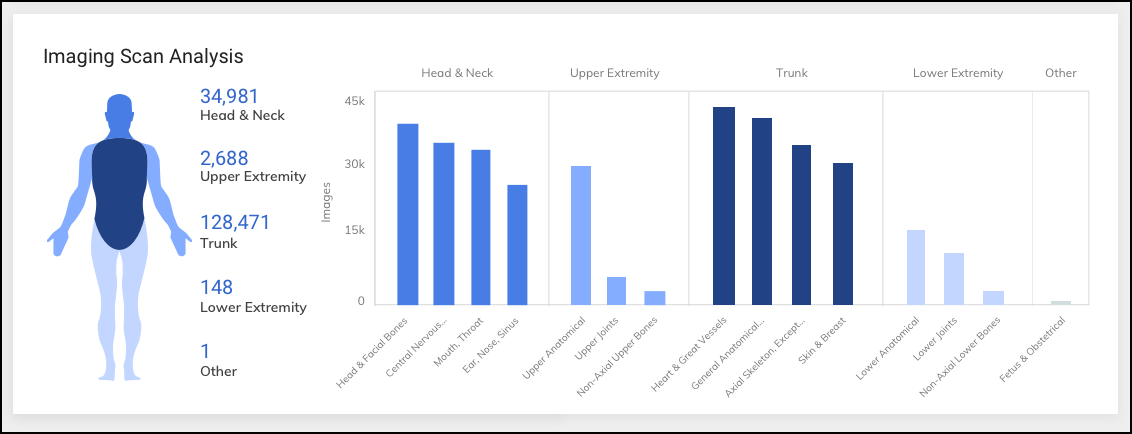
The coloring of each body region represents the volume of scans performed on it. The darker a section is the more scans were done there.
On the right are five bar charts, one for each of the four major anatomical regions and a fifth for the Other grouping. Chunking the data in this way makes it easier to see how your imaging equipment is being used. The bars in each chart represent the number of scans for more specific body areas (for example, a bar for the more specific Mouth and Throat is within the bar chart for Head and Neck). The charts include bars for areas where the most scans were performed. To see a full list, hover your cursor over one of the main sections and a popup appears.
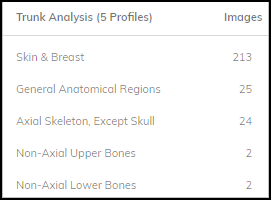
Devices – This information panel shows the total number of devices on the network in the past year and how many devices were connected to the network and used, connected but not used (online only), and disconnected (offline) during the filtered time range.
- Used – These are devices that matched all the filters and were not only on the network but sent traffic with a protocol indicating that they were being used.
- Online Only – These are devices that matched all the filters and were detected on the network but did not send traffic that indicates they were being used.
- Offline – These are devices that IoT Security detected on the network within the past year but not during the time range set in the time filter.
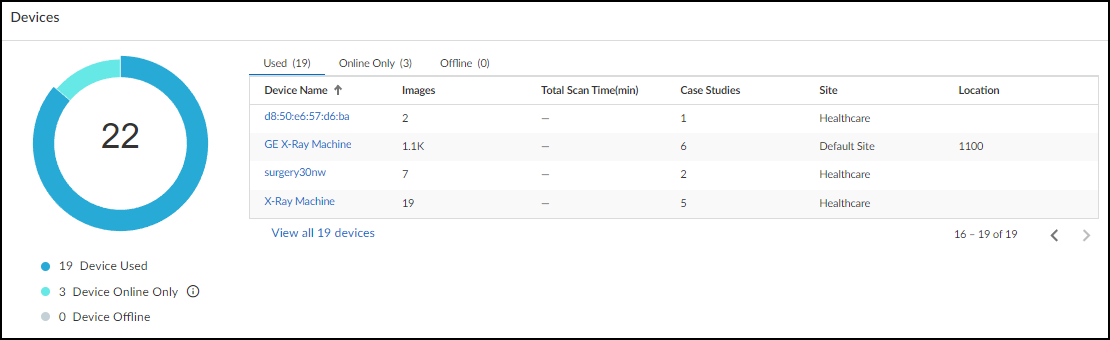
Click a section of the donut graph or a tab heading to switch lists. Click View all <number> devices to open the Devices page with a filter set to show only the devices in the active list. Click a specific device name to view device details for it.
When you click an entry in the Device Name column, the Device Details page for it opens. While viewing the Device Details page, click Utilization to see more detailed information.
The Utilization section on the Device Details page for any imaging device such as an ultrasound machine, X-ray machine, or CT scanner, shows when that device is and is not being used, how it's being used, and when it communicated with the device vendor. For example, with the time filter set to 1 Month at the top of the Device Details page, the Device Usage by Hours information panel shows the times when the device was in use during the past month.
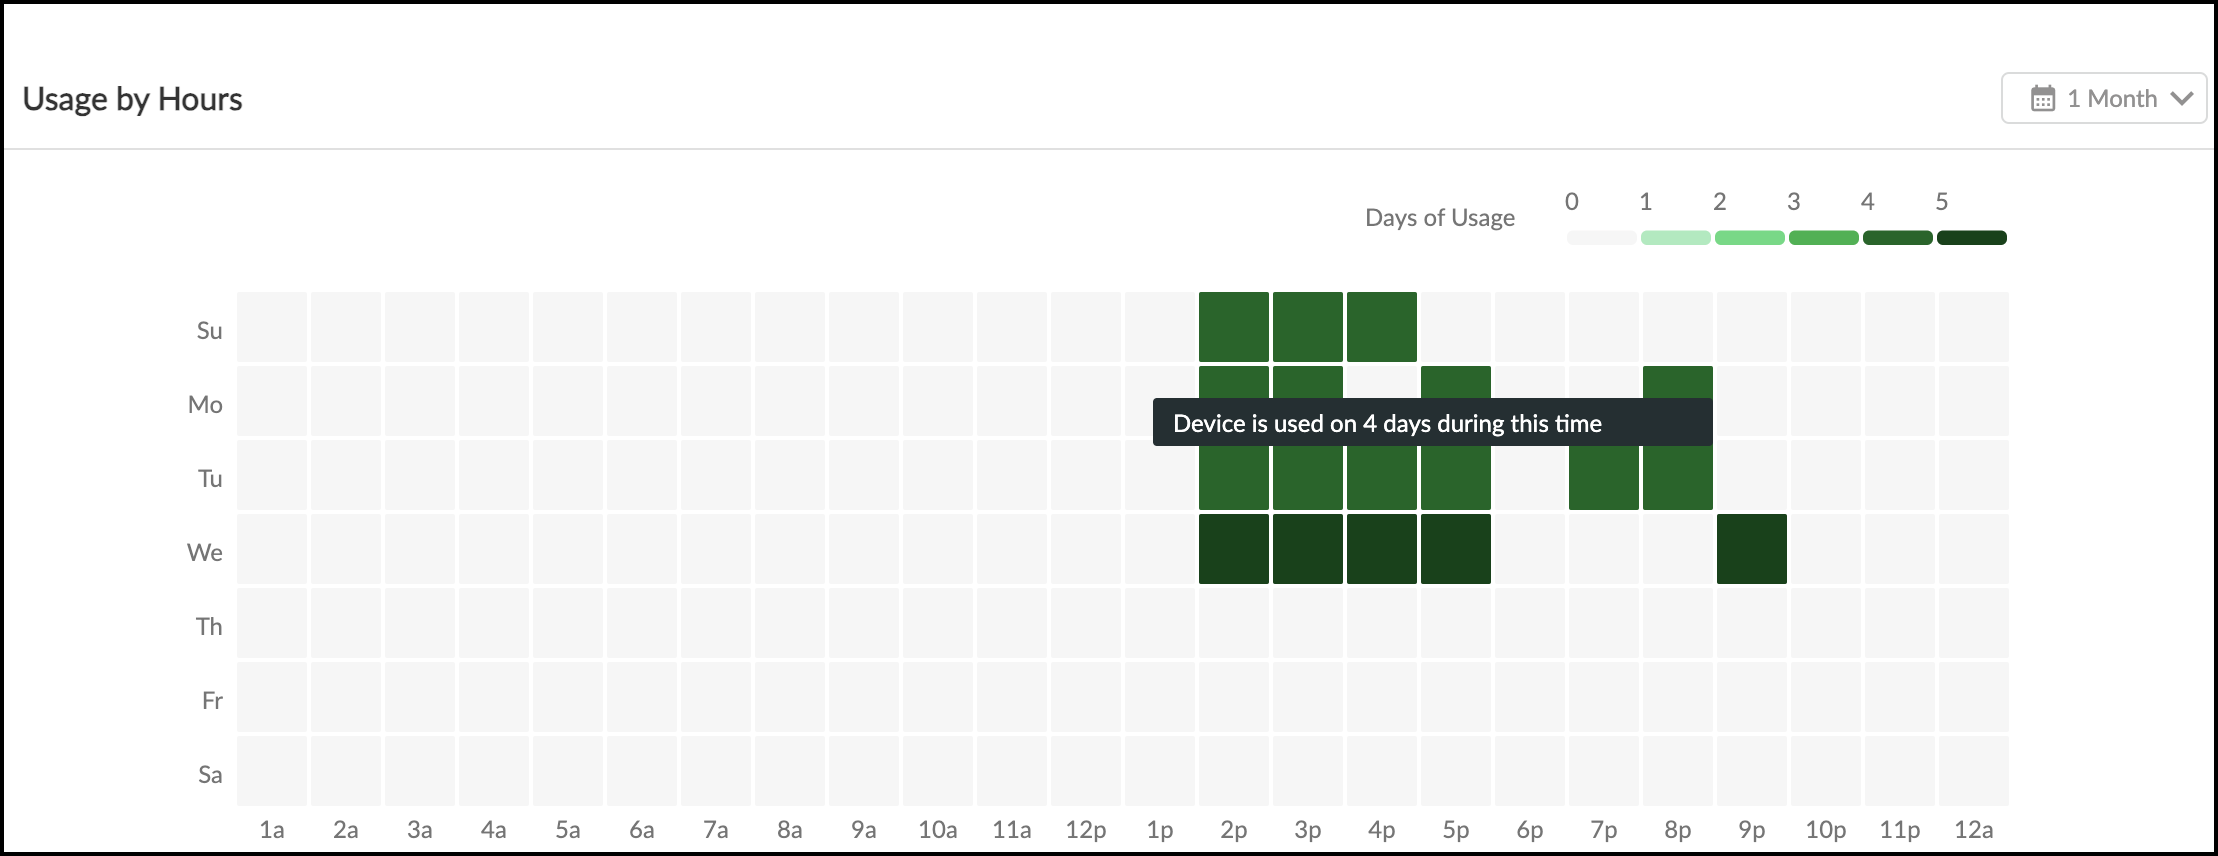
The legend in the upper right explains how the colors indicate how much the device was used at each hour. The darker the green, the more it was used. You can also hover your cursor over a square to see a tooltip explaining how often the device was used at that time. For example, in the image shown above, the device was used three times on Wednesday during the 2:00 PM hour.
The legend is dynamic based on which time range you selected: for 1 Week, it’s 0–1, for 1 Month it’s 1–5, and for 1 Year it’s 0–40+.
In Device Usage by Number, you can see the number of images the device took–or, by clicking Case , the number of cases for which the device took images. In Vendor Activities, you can see when the device communicated with its vendor, which for many devices is an automated means for obtaining software and security updates. You can see the traffic that the vendor initiated and total vendor traffic, which is a superset of all communication between the device and the vendor regardless of which one initiated it.
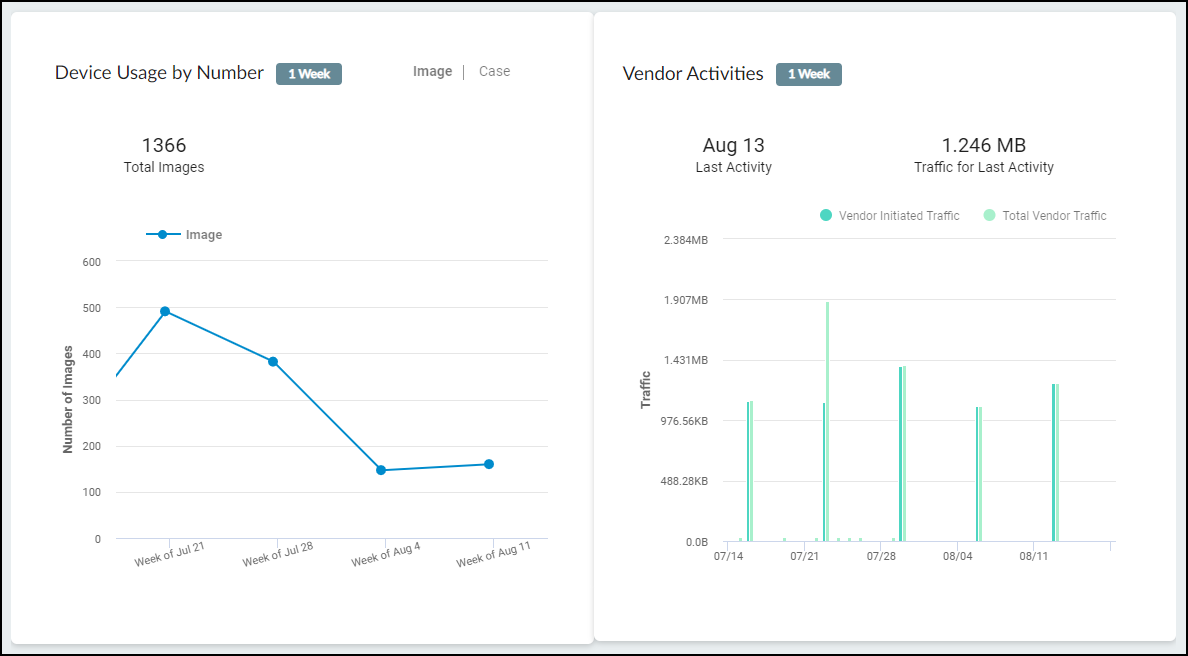
When viewing the Utilization section on the Device Details page for an infusion system, the IoT Security portal displays the following information.
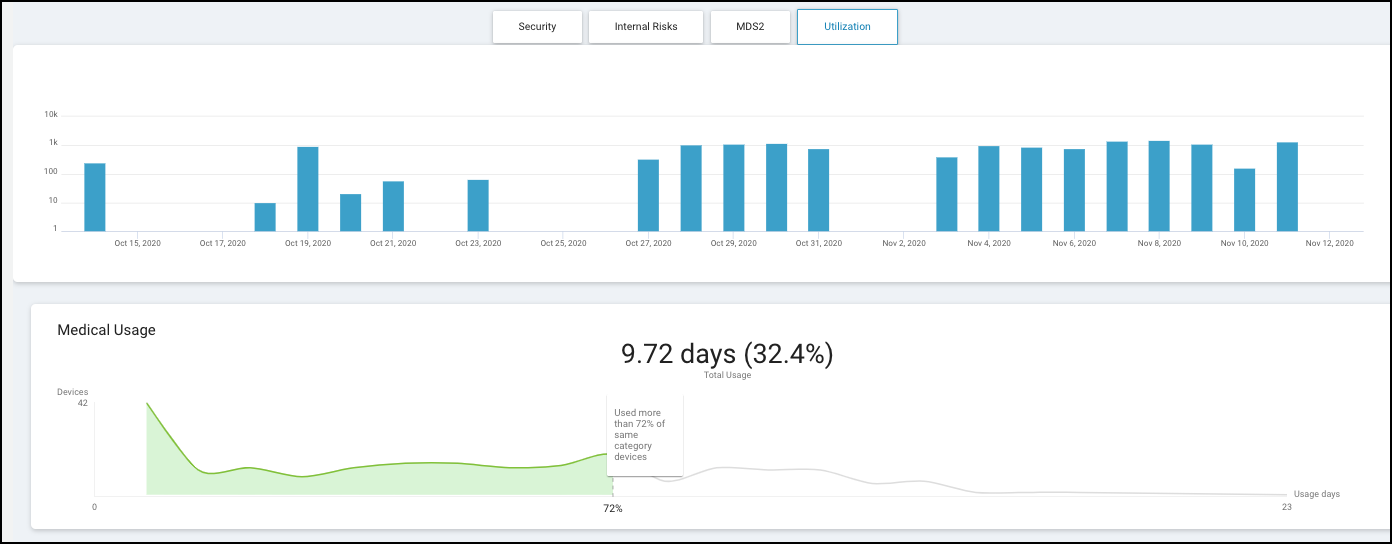
The blue bars in the upper graph, show how long the device was in use. For 1 week, 1 day, or 2 hours, each blue bar indicates the number of minutes per hour (60 minutes maximum) that the device was in use over the past 168, 24, or 2 hours. For 1 month or 1 year, it shows the number of minutes per day (1440 minutes maximum) that the device was in use every day for the past 30 or 365 days.
The lower graph shows how this device compares with others in the same device category. You can see how long it was in use and the percent of time it was actively used in relation to the time range set. In the example above, it was used for 9.72 days divided by 30 days or 32.4% of the time. The line graph shows that out of 42 devices in the same category, this device was used more than 72% of the others (indicated to the left in green) and less than the remaining 28% (indicated to the right in white).
The following site-specific information panels appear only when you’re using IoT Security for multiple sites.
Used Devices by Site – These bar charts show how many medical IoT devices were used at each site within the filter parameters. The number of devices that were in use during the filtered time range is shown in relation to the total number of devices at each site over the past year.
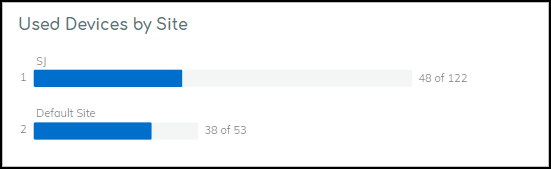
If you filter the dashboard to show data for a single site, this panel shows not only the devices that were in use at this site but also other sites that had active devices to provide a reference for comparison.
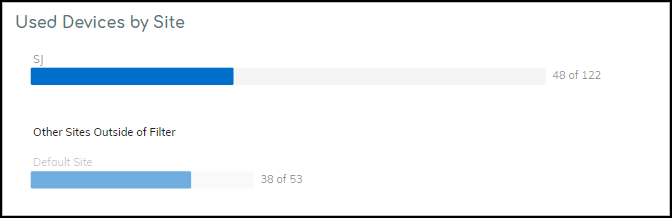
Scanning Data by Site – When the medical IoT device category is for imaging devices, this information panel shows the number of scanned images and cases for each site with active devices. Click Cases or Images to toggle between them.
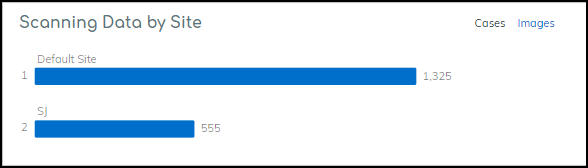
If you filter the dashboard to show data for a single site, this panel shows not only scanning data for this site but also other sites that have scanning data to provide a reference for comparison.
Average Usage by Site – When you set Infusion System as the medical IoT device category filter, this information panel shows the average device usage at each site. The average is calculated by dividing the total number of hours that devices at a site were in use during the time filter (1 week, 1 month, or 3 months) by the total number of devices in use at that site during the same time. Any devices that were not in use during that time are excluded from the calculation. In short, hours in use / devices in use = average usage.
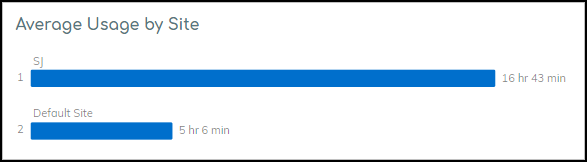
If you filter the dashboard to show data for a single site, this panel shows not only the average usage of infusion systems for this site but also that of other sites with active infusion systems to provide a reference for comparison.
MDS2
Utilization Information Panels
|
Where Can I Use This? |
What Do I Need? |
|
|
Note: The VulnerabilitiesMDS2 page only appears when the portal theme is Medical IoT Security.
Medical device vendors often list the security-related features of their products in Manufacturer Disclosure Statement for Medical Device Safety (MDS2) forms, which they share with their customers. Vendors issue these MDS2 documents for each version of a medical device and include valuable information such as whether a device processes PHI (personal health information); if it stores PHI and, if so, if it's encrypted; and if antivirus software is installed on the device.
Over time, healthcare providers can collect thousands of MDS2 documents for thousands of medical devices. When used as intended, MDS2 documents can greatly enhance your security posture and incident response (IR). However, absorbing the details from these documents for the specific version of the software running on their connected devices is a daunting task. As a result, MDS2 files often go unused.
IoT Security simplifies the management and use of the MDS2 files you have. If you upload an MDS2 file for a device to IoT Security, it then includes this data along with other environmental factors when assessing the risk to the device. For example, if the software version of a device specified in an MDS2 file has a known vulnerability, IoT Security more precisely identifies it as a vulnerability instead of just a potential vulnerability. IoT Security supports MDS2 files in 2004, 2008, 2013, and 2019 formats.
You can upload MDS2 files to IoT Security and use files shared by other IoT Security users through the MDS2 community. To join, select VulnerabilitiesMDS2 , click Learn More , read about how the MDS2 community works, and then click Join Now . After that, IoT Security scans the community and shows previously uploaded MDS2 files from other community members that match your devices. At the same time, Palo Alto Networks security engineers review any MDS2 files that you've already uploaded. If they are approved, IoT Security then shares your files with other community members. In this spirit of cooperation, everyone benefits from the files shared with each other.
If members upload duplicate MDS2 files (that is, more than one file applies to the same vendor, profile, and model), IoT Security uses the following logic in order from the top to prioritize one over another and automatically apply it to your devices:
- If an MDS2 file is excluded, do not use it.
- Use a manually selected MDS2 file over an automatically selected file.
- Use an MDS2 file that you uploaded.
- Use an MDS2 file that’s shared in the community.
- Use a version of an MDS2 file released later than another version.
- Use a later format version of an MDS2 file over an earlier format; for example, use a 2017 MDS2 file instead of a 2013 format version.
When you select VulnerabilitiesMDS2 after joining the MDS2 community, IoT Security displays the MDS2 Files Matched page. This lists the MDS2 files that match medical IoT devices in the IoT Security inventory. You can navigate from here to a page with MDS2 files that you previously uploaded, a page with files uploaded by other IoT Security customers, and a page listing medical IoT devices that match the MDS2 files here.
On VulnerabilitiesMDS2 , you can view files that match medical IoT devices in the inventory, download them, and exclude them if you don't want IoT Security to apply them to your medical IoT devices. You can also download a complete list of all uploaded MDS2 files or a list of one or more selected files.
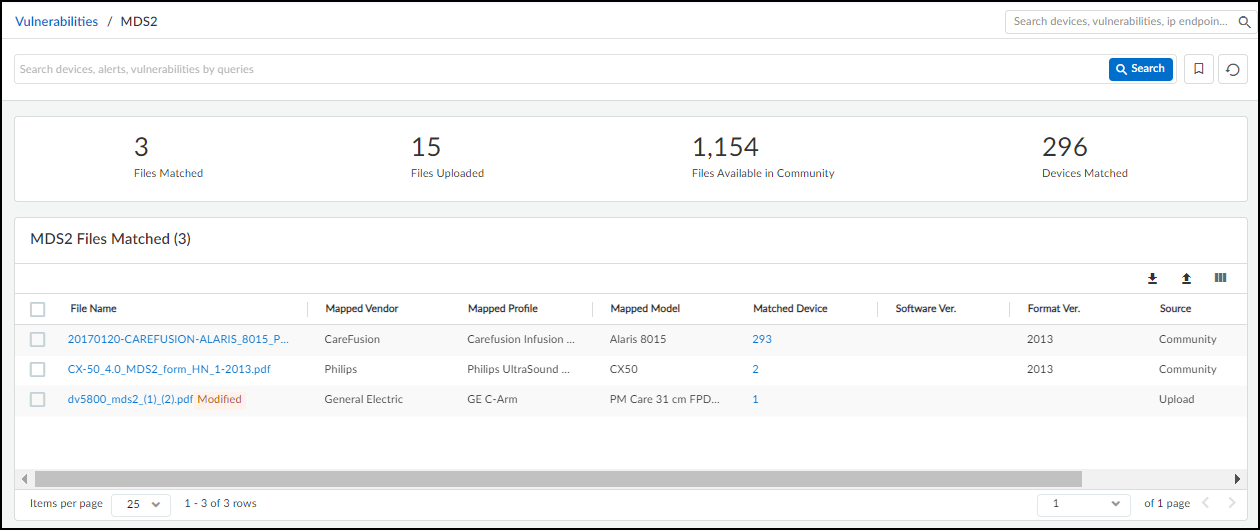
To upload a file, click the Upload icon (
![]()
), navigate to an MDS2 file in PDF format, and then select and upload it.
IoT Security matches the uploaded MDS2 file with devices that share the same model, vendor, and profile as those specified in the file. Although you can upload an MDS2 file on the Device Details page , IoT Security only applies the MDS2 file to that individual device. On the other hand, if you upload an MDS2 file on the MDS2 page, IoT Security searches its inventory for all devices with the same model, vendor, and profile attributes and applies the MDS2 file to all matched devices. Furthermore, if new devices are added to the inventory later, IoT Security will apply the MDS2 file to those devices as well.
Clicking a number in the Matched Device column opens the Devices page with a filter applied to show just those devices that match the MDS2 file.
The number in the Matched Device column on the MDS2 page is the total for all sites. If you have administrative access to device data for a subset of sites, the number of matched devices on the Devices page might be smaller than the number on the MDS2 page.
To view some details about an MDS2 file, click the entry in the File Name column. An information panel slides open on the right side of the main window listing the three attributes that IoT Security uses to map the MDS2 file to devices. Below this, it lists several key points about the device, the document, and security.