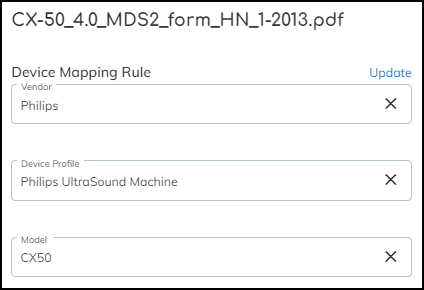
When you upload a MDS2 file, check if there are any inaccuracies among the device mapping rule values. It’s possible that text alignment issues in the PDF cause characters to be parsed incorrectly. If that happens, IoT Security won’t be able to match the MDS2 file with devices. In such cases, click Edit to the right of Device Mapping Rule, modify the text as necessary, and then click Update .
In addition to the values in the Device Mapping Rule, you can edit other attributes in the MDS2 file if they were parsed incorrectly as well. Whenever you click Update —either for changes to Device Mapping Rule or Data from MDS2 File—IoT Security immediately removes any previous matches for the MDS2 document and runs the matching process again.
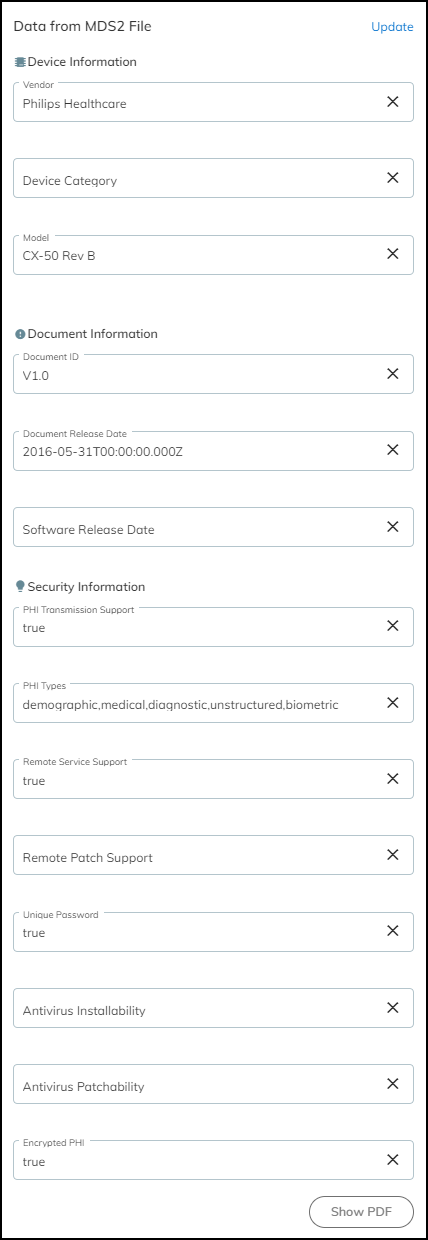
To view an entire MDS2 file in PDF format, click Show PDF in the information panel.
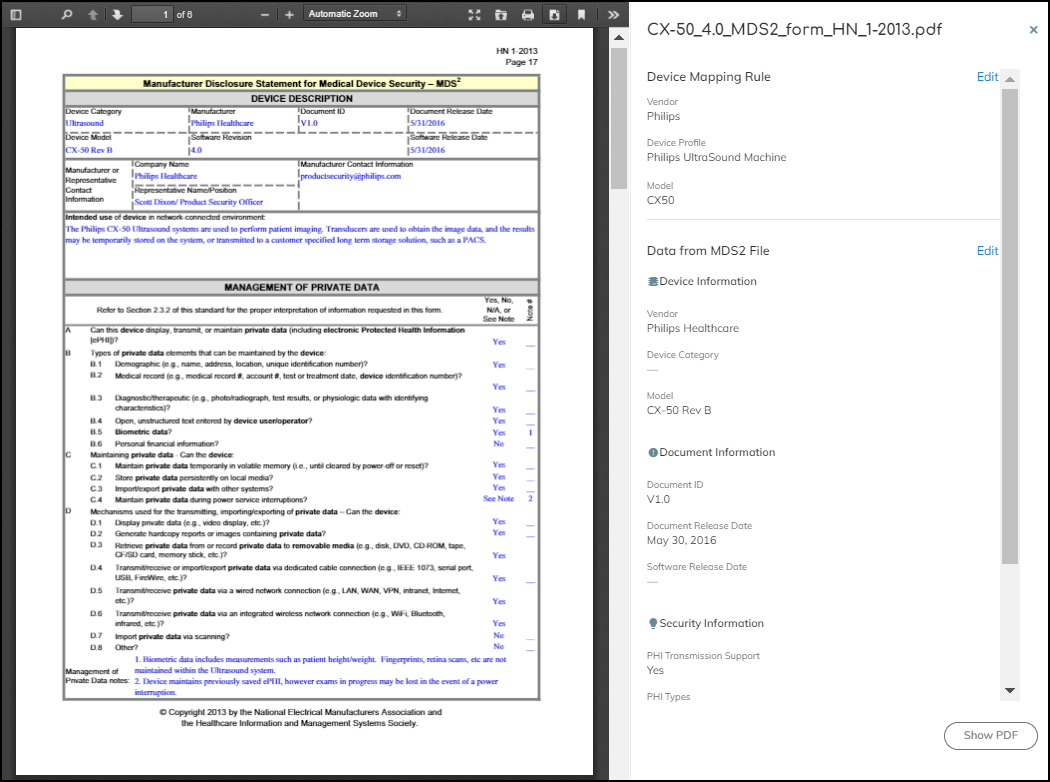
To download the PDF, click the Download icon (
![]()
) at the top of the PDF viewer.
To close the information panel (and PDF viewer if it’s also open), either click the X in the upper right corner or click the file name again.
To download a list of all uploaded MDS2 files in a .csv file, click the Download icon (
![]()
) above the MDS2 table. To download a list of one or more MDS2 files in a .csv file, select check boxes of the ones you want to download and then click Download .
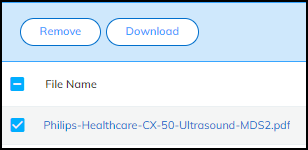
To delete one or more previously uploaded MDS2 files, select the check boxes of the files to delete and then click Remove .
MDS2 Community
|
Where Can I Use This? |
What Do I Need? |
|
|
If you want, you can override the automatic MDS2 file selection and apply a different file of your choice. See the last step below for instructions.
- View your uploaded MDS2 files and shared community files.
- On the VulnerabilitiesMDS2 page, click <number> Files Available in Community .
The VulnerabilitiesMDS2MDS2 Files page opens with two tabs: one for the files you uploaded ( Uploaded Files ) and one for files shared in the community ( Community Files ).
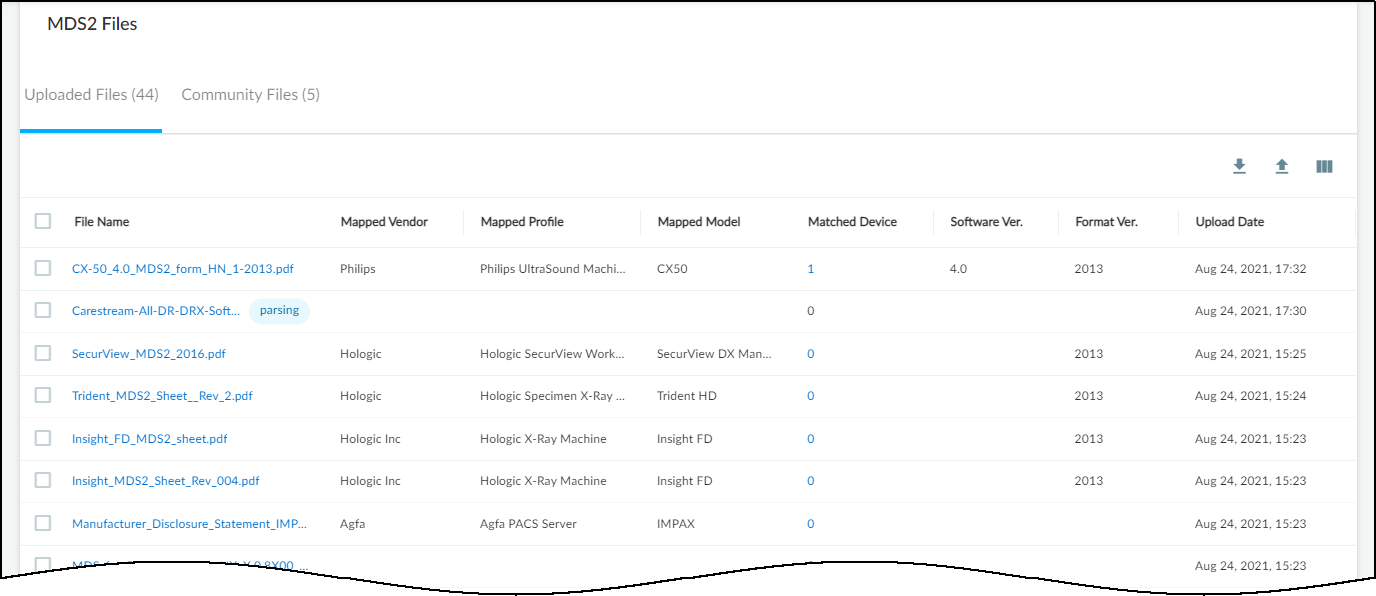
The table provides key details about the MDS2 file: the vendor, profile, model, and software version it applies to; how many devices in your inventory it matches; the format version of the MDS2 file; and when it was uploaded to IoT Security.
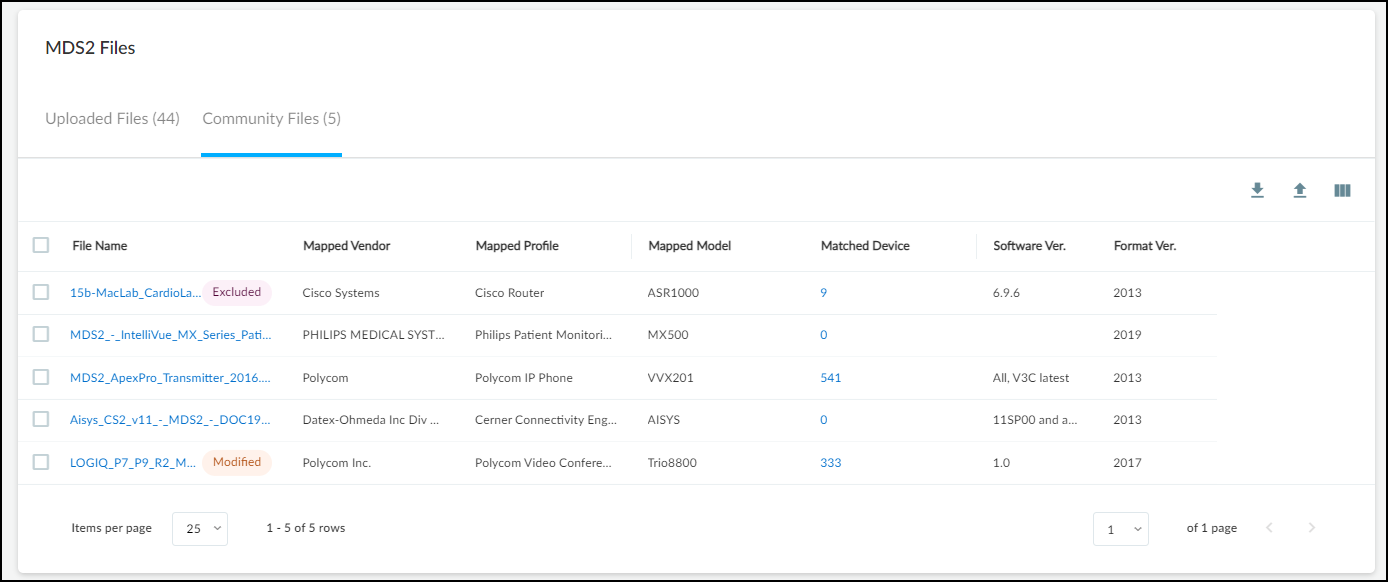
The table on the Community Files page provides almost all the same information as that on the Uploaded Files page except for the date the file was uploaded.
- If there are shared MDS2 files that you don’t want IoT Security to apply to your devices, exclude them.
You might not want IoT Security to apply one or more community files to your medical IoT devices, perhaps because you prefer a different version for some reason. In this case, you can exclude them from the automatic selection process.
- Select VulnerabilitiesMDS2MDS2 FilesCommunity Files , select the check box of an MDS2 file you want to exclude from the automatic selection process.
Exclude and Download buttons appear above the table.
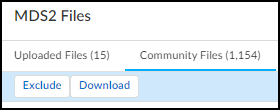
- Click Exclude .
If you change your mind, repeat these steps but click Include instead of Exclude . IoT Security displays an Include button for previously excluded MDS2 files.
- If there are duplicate MDS2 files and you want to use something different from what IoT Security automatically selected, manually override the selection.
When more than one MDS2 file applies to the same vendor, profile, and model, you might want IoT Security to apply a different MDS2 file other than the one it automatically selected. For example, you might choose an earlier format version if your medical IoT devices are running earlier software versions and this MDS2 file applies to them more accurately than a later one would.
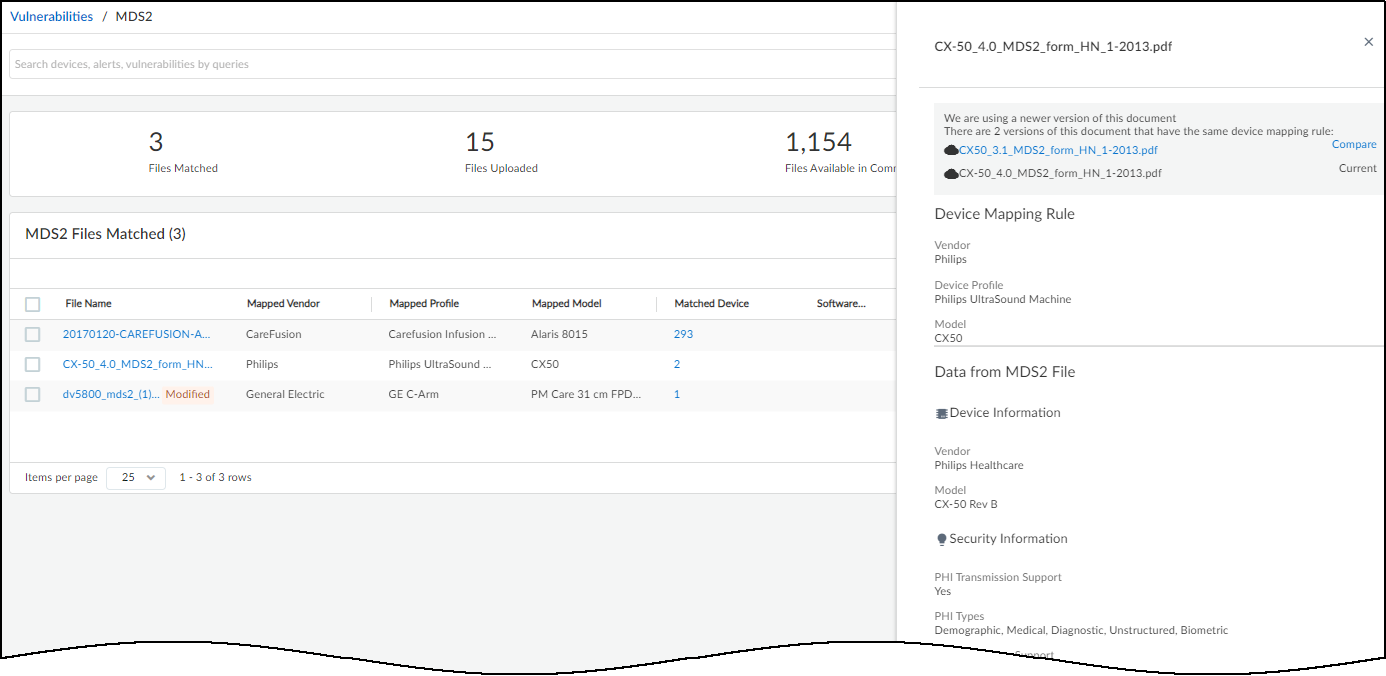
- Click an MDS2 file name on the VulnerabilitiesMDS2 page.
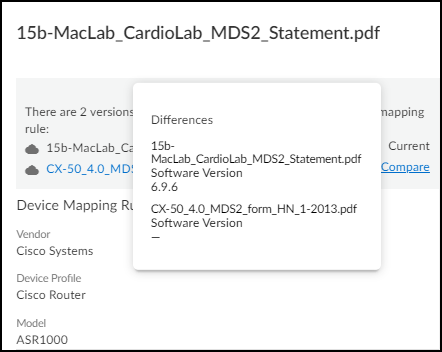
The information panel that opens on the right side of the page lists duplicate MDS2 files in order of priority.
The information panel for a file you uploaded includes an Edit option, but the panel for a community-shared file does not.
- To compare two duplicate files, either click or hover your cursor over Compare . IoT Security compares it with the currently applied file. In the example shown here, you can see that the first MDS2 file is prioritized because it has a software version whereas the second file does not.
- To use a different file, click its name and then click Use < file-name > instead .
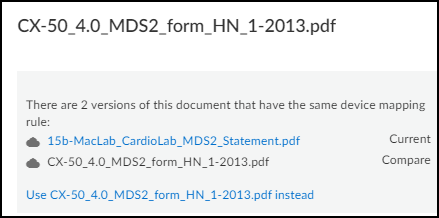
The name of your selected file now appears in the File Name column and is shown as Current in the information panel.
Recalls
|
Where Can I Use This? |
What Do I Need? |
|
|
The VulnerabilitiesRecalls page lists the Food and Drug Administration (FDA) recalls for devices on your network.
The IoT Security portal only displays the Recalls page when the portal theme is Medical IoT Security and it detects that at least one of the medical IoT devices on the network has been recalled. The application content version on your firewalls must be 8367-6513 or later to detect healthcare-specific applications and include them in security policy rules.
The Recalled Devices column shows the number of devices on your network that have been recalled, and if the status is open, the manufacturer is still accepting device returns for them.
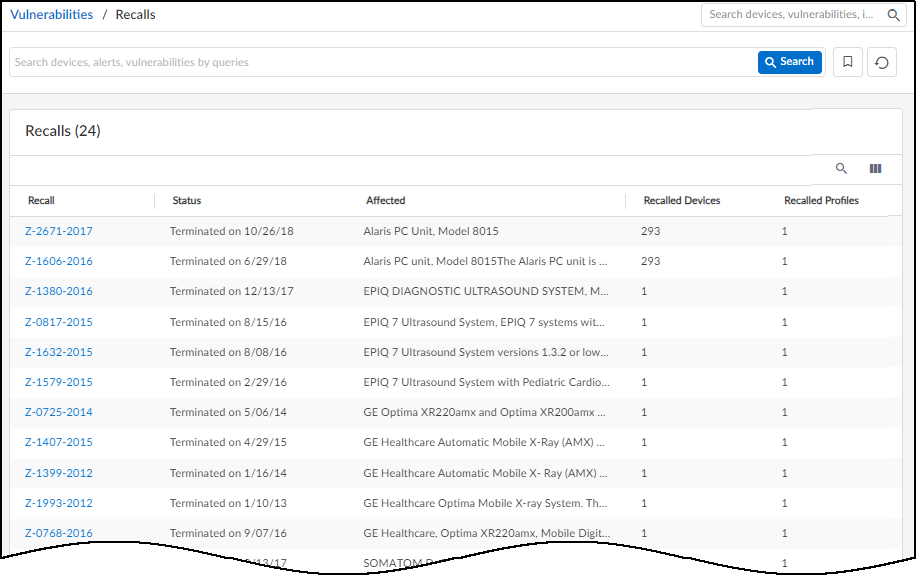
Each recall identifier links to a URL on the U.S. Food & Drug Administration website with information about the recall. For example, clicking Z-1380-2016 in the Recall column shown above opens the following webpage .
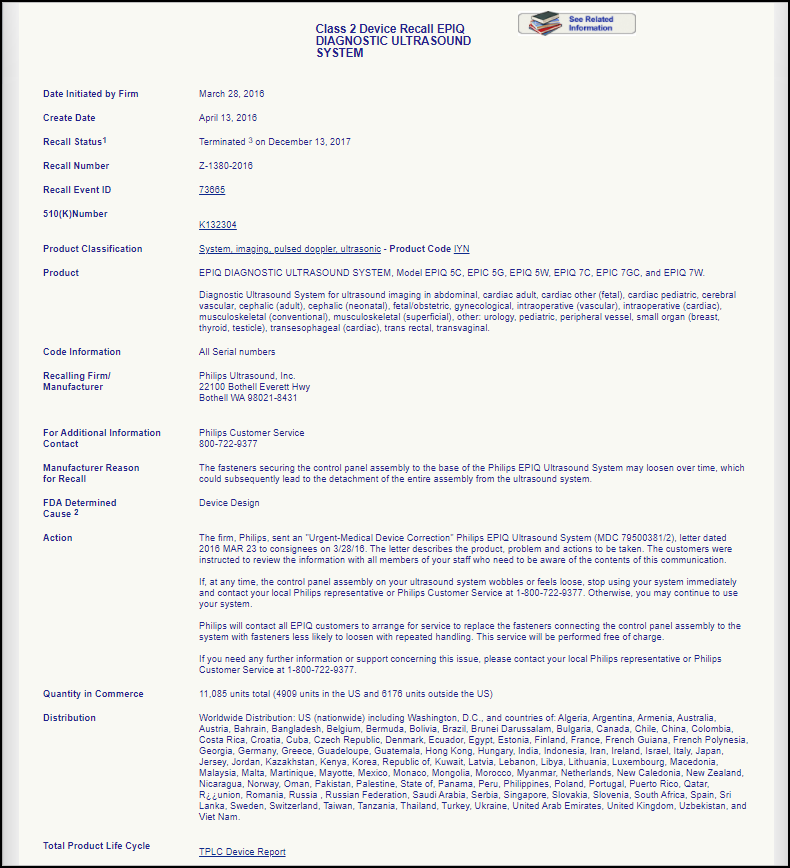
Whether or not you receive instructions from a manufacturer when a product is recalled, you can open the recall URL to get identifying information such as lot numbers, serial numbers, or version numbers for the recalled devices and learn the manufacturer’s contact information. You can then use these numbers to locate the devices and call or write the manufacturer.
Monitor IoT Security Health
|
Where Can I Use This? |
What Do I Need? |
|
|
To ensure that you get the most out of IoT Security, use the provided tools to monitor the health of your IoT Securitysolution .
Reports let you to generate , schedule, and view detailed reports on device inventory, risks, alerts, and utilization. You can customize report types, schedules, and filters to focus on the most relevant information for your needs. Use reports to get a high-level view of your network, track trends, and see the breadth and depth of monitoring that IoT Security does.
To ensure IoT Security is working effectively, use the Data Quality Diagnostics page to check the quality of network data being received. This helps identify issues like IP endpoints without unique identifiers or low-confidence device classifications. By monitoring these metrics, you can take steps to improve data quality and device identification accuracy.
The IoT Security integration status pages for firewalls and Prisma Access provide visibility into connectivity, log forwarding, and policy recommendation requests. This helps you verify that IoT Security receives the necessary data to perform its analysis and provide protection.
When deeper investigation is needed, the on-demand PCAP feature enables authorized packet captures on firewalls. When you authorize on-demand PCAP, the IoT Security Research Team can access network traffic metadata for offline analysis of unknown devices or applications, enhancing threat detection capabilities.
By leveraging the full suite of monitoring and diagnostics tools, you ensure IoT Security has high-quality data to work with, integration issues are quickly identified, and you have the insights needed to remediate issues and maintain a strong security posture for your IoT devices. This holistic approach lets you maximize the value of IoT Security in protecting your critical IoT assets.
Reports
IoT Security Integration Status with Firewalls
|
Where Can I Use This? |
What Do I Need? |
|
|
The Reports section ( Logs & ReportsReports ) is where you can view and download reports of various types:
- Summary provides a summary of device inventory, risk assessment, and alerts.
- Discovery provides a view of devices that IoT Security discovered on your network, their distribution in different subnets/VLANs, and devices with high-risk scores and pending alerts.
- New Device reports all the new devices detected on your network since the last report. IoT Security can generate reports on a daily, weekly, or monthly basis.
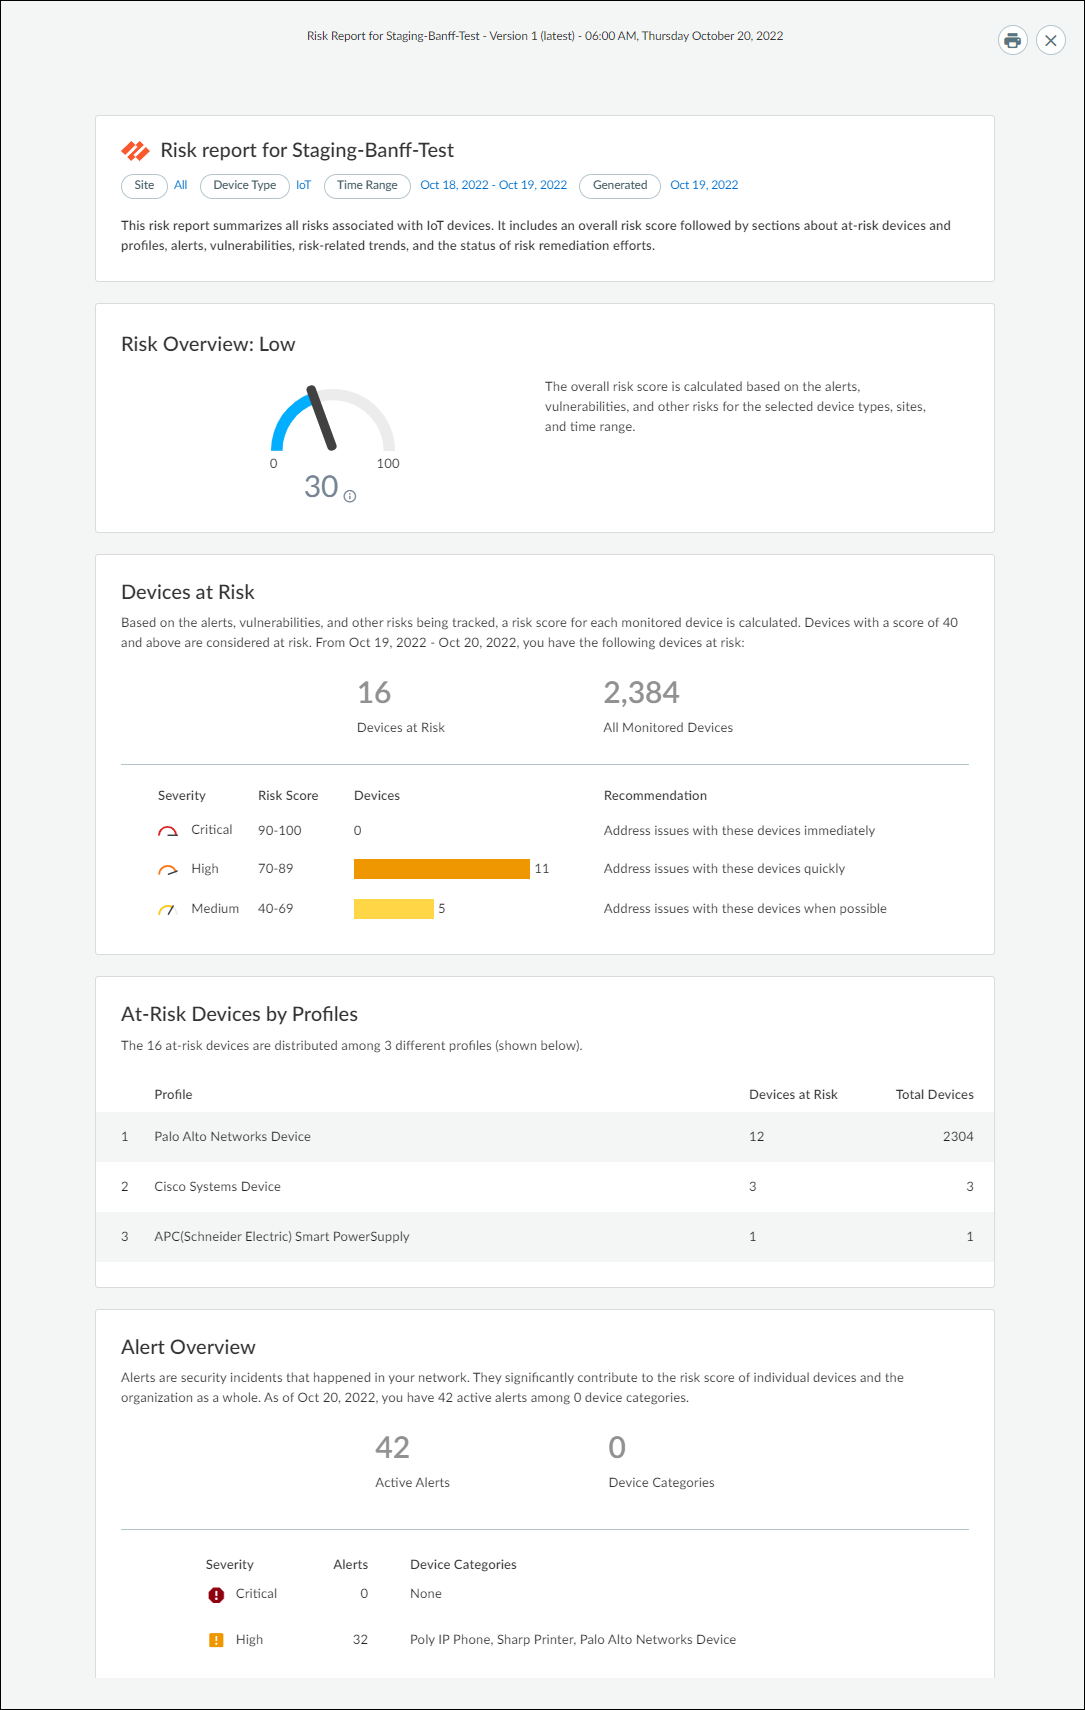
- Risk summarizes all risks associated with IoT devices. It reports an overall risk score, at-risk devices, alerts, vulnerabilities, risk-related trends, and the status of risk remediation efforts.
- Inventory Gap (when IoT Security is integrated with a CMMS) shows devices discovered by IoT Security, those in your CMMS (computerized maintenance management system) inventory, and where the two sets of devices do and do not overlap.
- Utilization provides data visualizations about medical IoT device operations and usage.
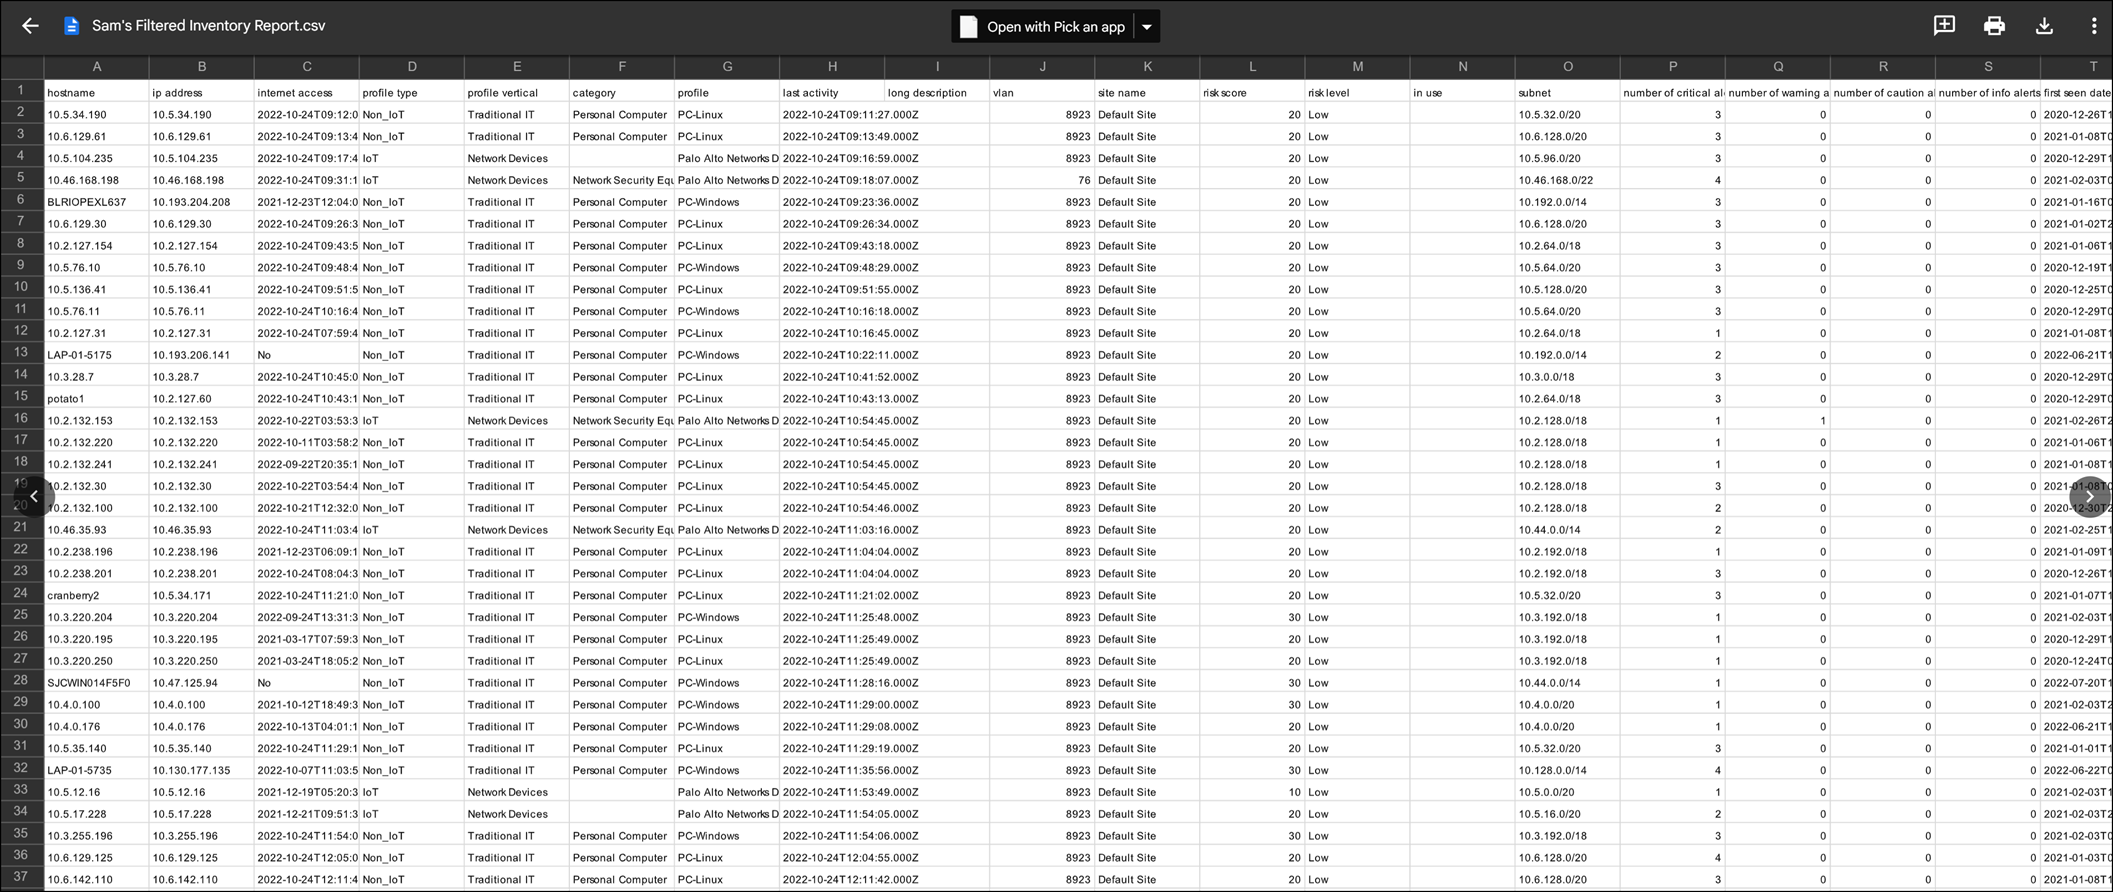
- Filtered Inventory prepares a device inventory report using a previously defined filter of your choice from the Devices page.
There are two ways to generate a report—immediately and scheduled. The scheduled reports can be generated either once or on a recurring basis.
- Discovery reports can be generated only immediately
- All the other report types must be scheduled
- Risk reports and Utilization reports can be generated both ways
Configure Reports
You can configure your reports to either generate on demand or schedule them to be generated at a later date .
Generate a Report Now
You can only generate Discovery, Utilization, and Risk reports immediately; all others must be scheduled. To generate a report immediately, click the + icon on the top right of the reports page and select Generate a report now . Provide or choose the required details and click Generate .
- Report type : Choose the report type from the drop-down list.
- Report Name : Enter a name for the report.
- Sites : You can choose all sites, an individual site, or–if you arranged your sites in hierarchical groups–a group of sites.
- Alert Severity and Risk Level : For Discovery reports, alert severity is for security alerts and risk level is for vulnerabilities. You can choose one, two, or three severity and risk levels. IoT Security will filter the devices it includes in the Discovery report based on your choices. If you leave these empty, then alert severities and risk levels aren't used to filter which devices to include in the report.
- Device type : Optional for Risk reports; choose all device types or one or more individual types (automotive, industrial, medical, and so on). For Discovery reports, choose from either discovered or monitored. “Discovered” are devices that IoT Security knows are on the internal network but it's not monitoring and protecting. “Monitored” devices are also on the internal network and IoT Security is monitoring their network activity to do device profiling, behavioral analysis, and risk monitoring.
- Device Category : For Utilization reports, the device category field for an Inventory report is limited to infusion systems and image scanners (X-ray machines, UltraSound machines, MRI machines, CT scanners, and PET scanners).
- Subscribe : Choose the email address to which you want to send the reports.
- Select a time range : Choose from the available time ranges or create a custom time range for which you want to generate reports.
The report gets generated in a few moments and is available on the reports page.
Schedule a Report for Later
Scheduled reports can be generated once or on a recurring basis. All reports can be scheduled except Discovery and Utilization reports. To schedule a report for a later date, click the + sign on the top right of the reports page and select Schedule a report for later . Provide or select the required details and click Schedule .
In addition to the fields described in the the
previous section
, fields specific to scheduled reports are described below.
- Scope : For Summary reports, this decides what the report will include and can either be set as Site or Device Type (automotive, industrial, medical, and so on). Choosing All does not filter for sites or device types.
- Saved Filters/Queries (optional): For Filtered Inventory reports, choose from the saved filters from the drop-down.
- Set a recurring schedule : You can schedule reports to be run on a daily, weekly, monthly, or custom time basis.
- Summary reports: Weekly, Monthly on Day 1
- Risk reports: Daily, Weekly, Monthly on Day 1, Custom schedule (set to any day and time of the week)
- New Device and Filtered Inventory reports: Daily, Weekly, Monthly on Day 1
The first time a scheduled report is generated, it will include data that IoT Security gathered over the time period set in the report configuration. For example, if you create a monthly recurring New Device report on 27 October to start on the first of the month, IoT Security will generate its first report on November 1 with 31 days worth of new devices starting from October 1. The same holds true for daily and weekly scheduled reports. After a scheduled report is initially generated, IoT Security continues to produce reports at the specified interval with data in each new report gathered during the time since the last one.
The report is now scheduled to be generated at the time you selected. Similar to immediate reports, this report is also available on the Reports page.
View Reports
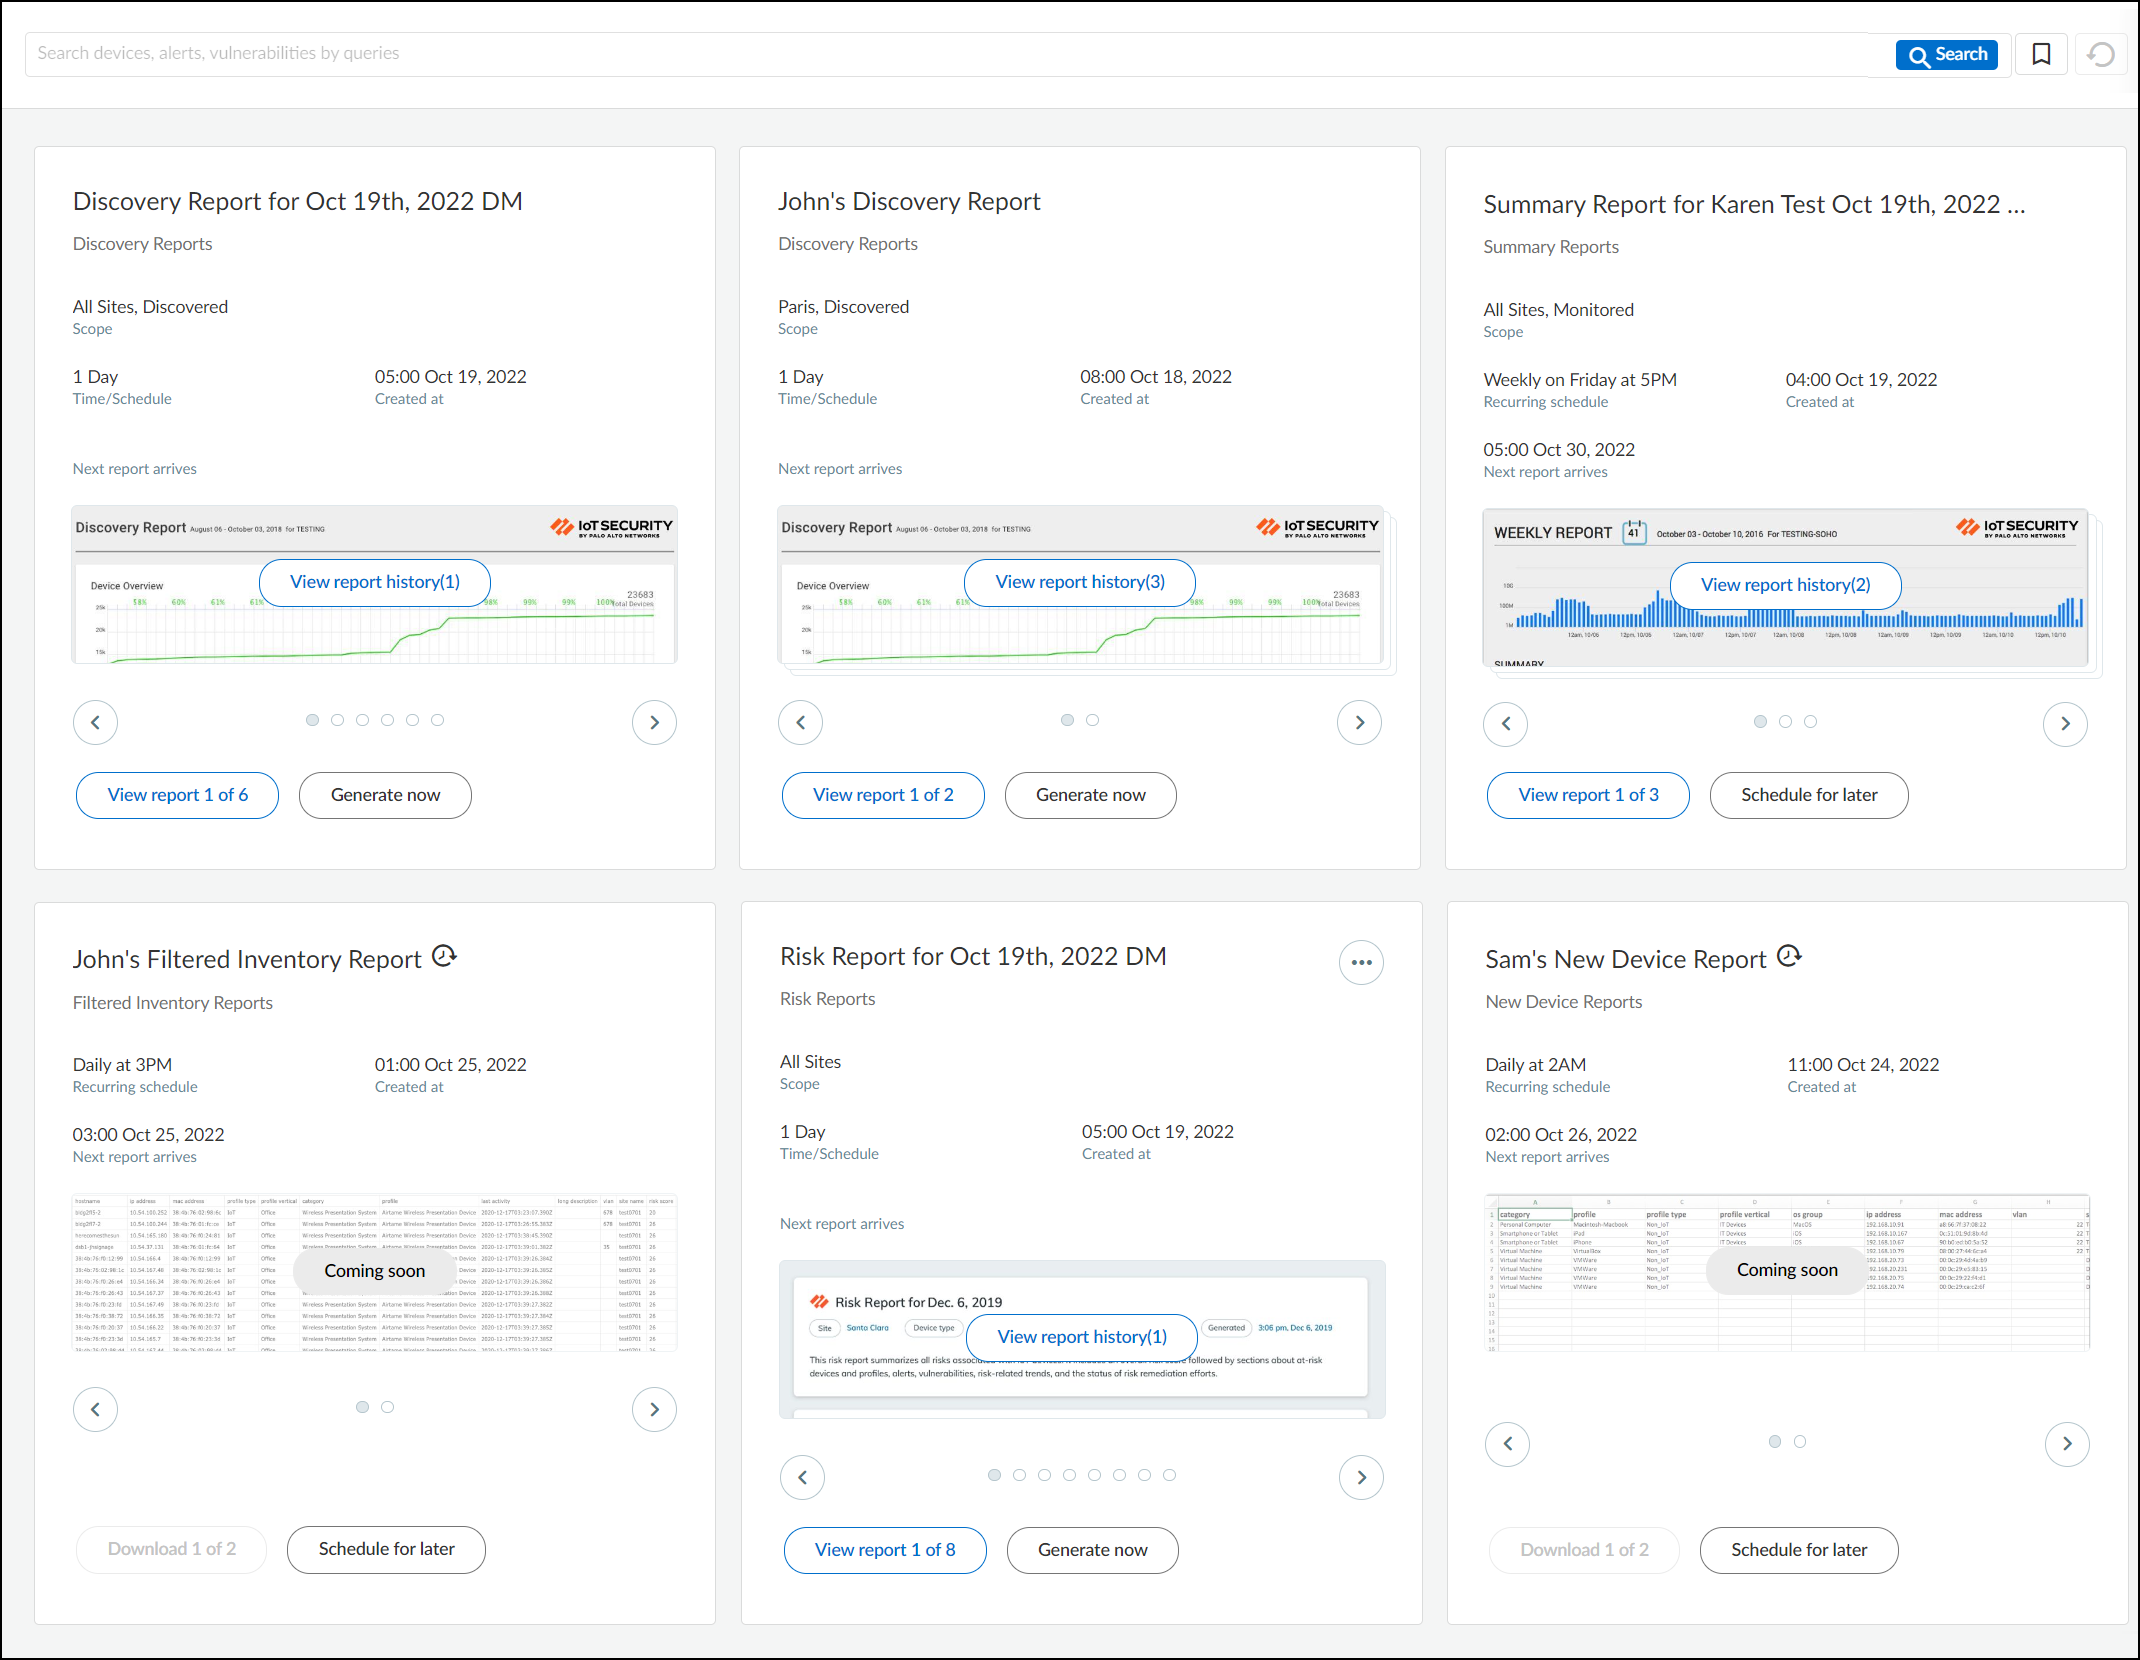
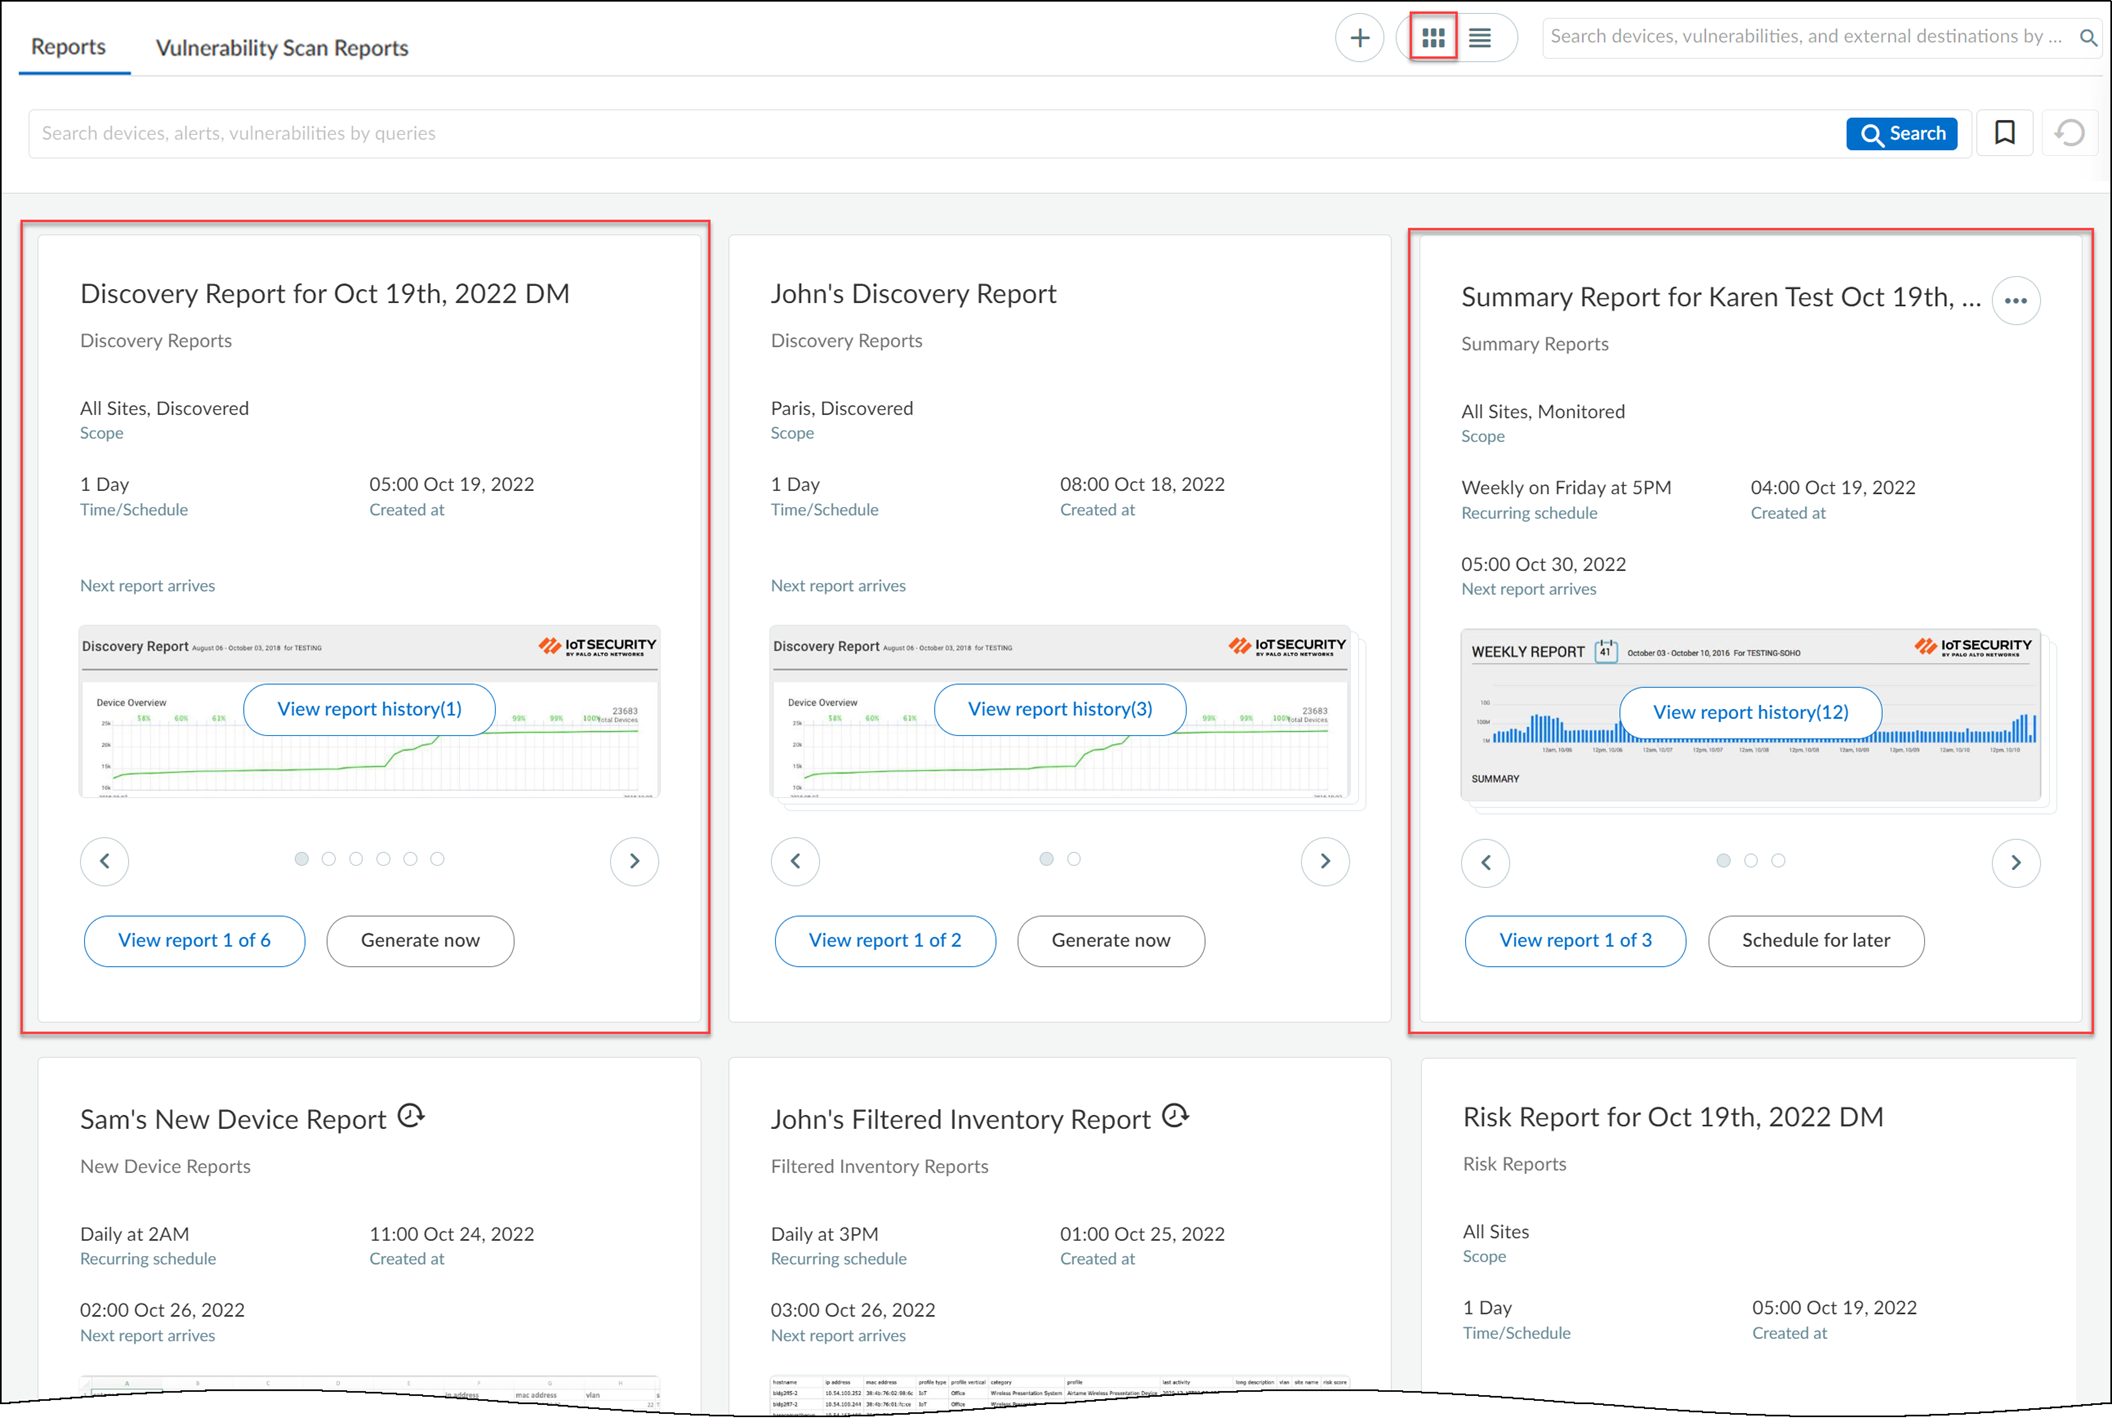
You can view your reports in either the card view or list view. The view setting is in the upper right of the Reports page between the + icon and Search field.
The card view on the Reports page displays similar reports grouped inside a card. Cards are grouped by three parameters: Report type, Scope, and Schedule. For example:
- All Discovery reports with a scope set as “All Sites, Discovered ” and a schedule set as 1 day are grouped together under a single card.
- All Summary reports with a scope set as “All Sites, Monitored ” and a schedule set as “Weekly on Friday at 5 PM” are grouped together under another single card.
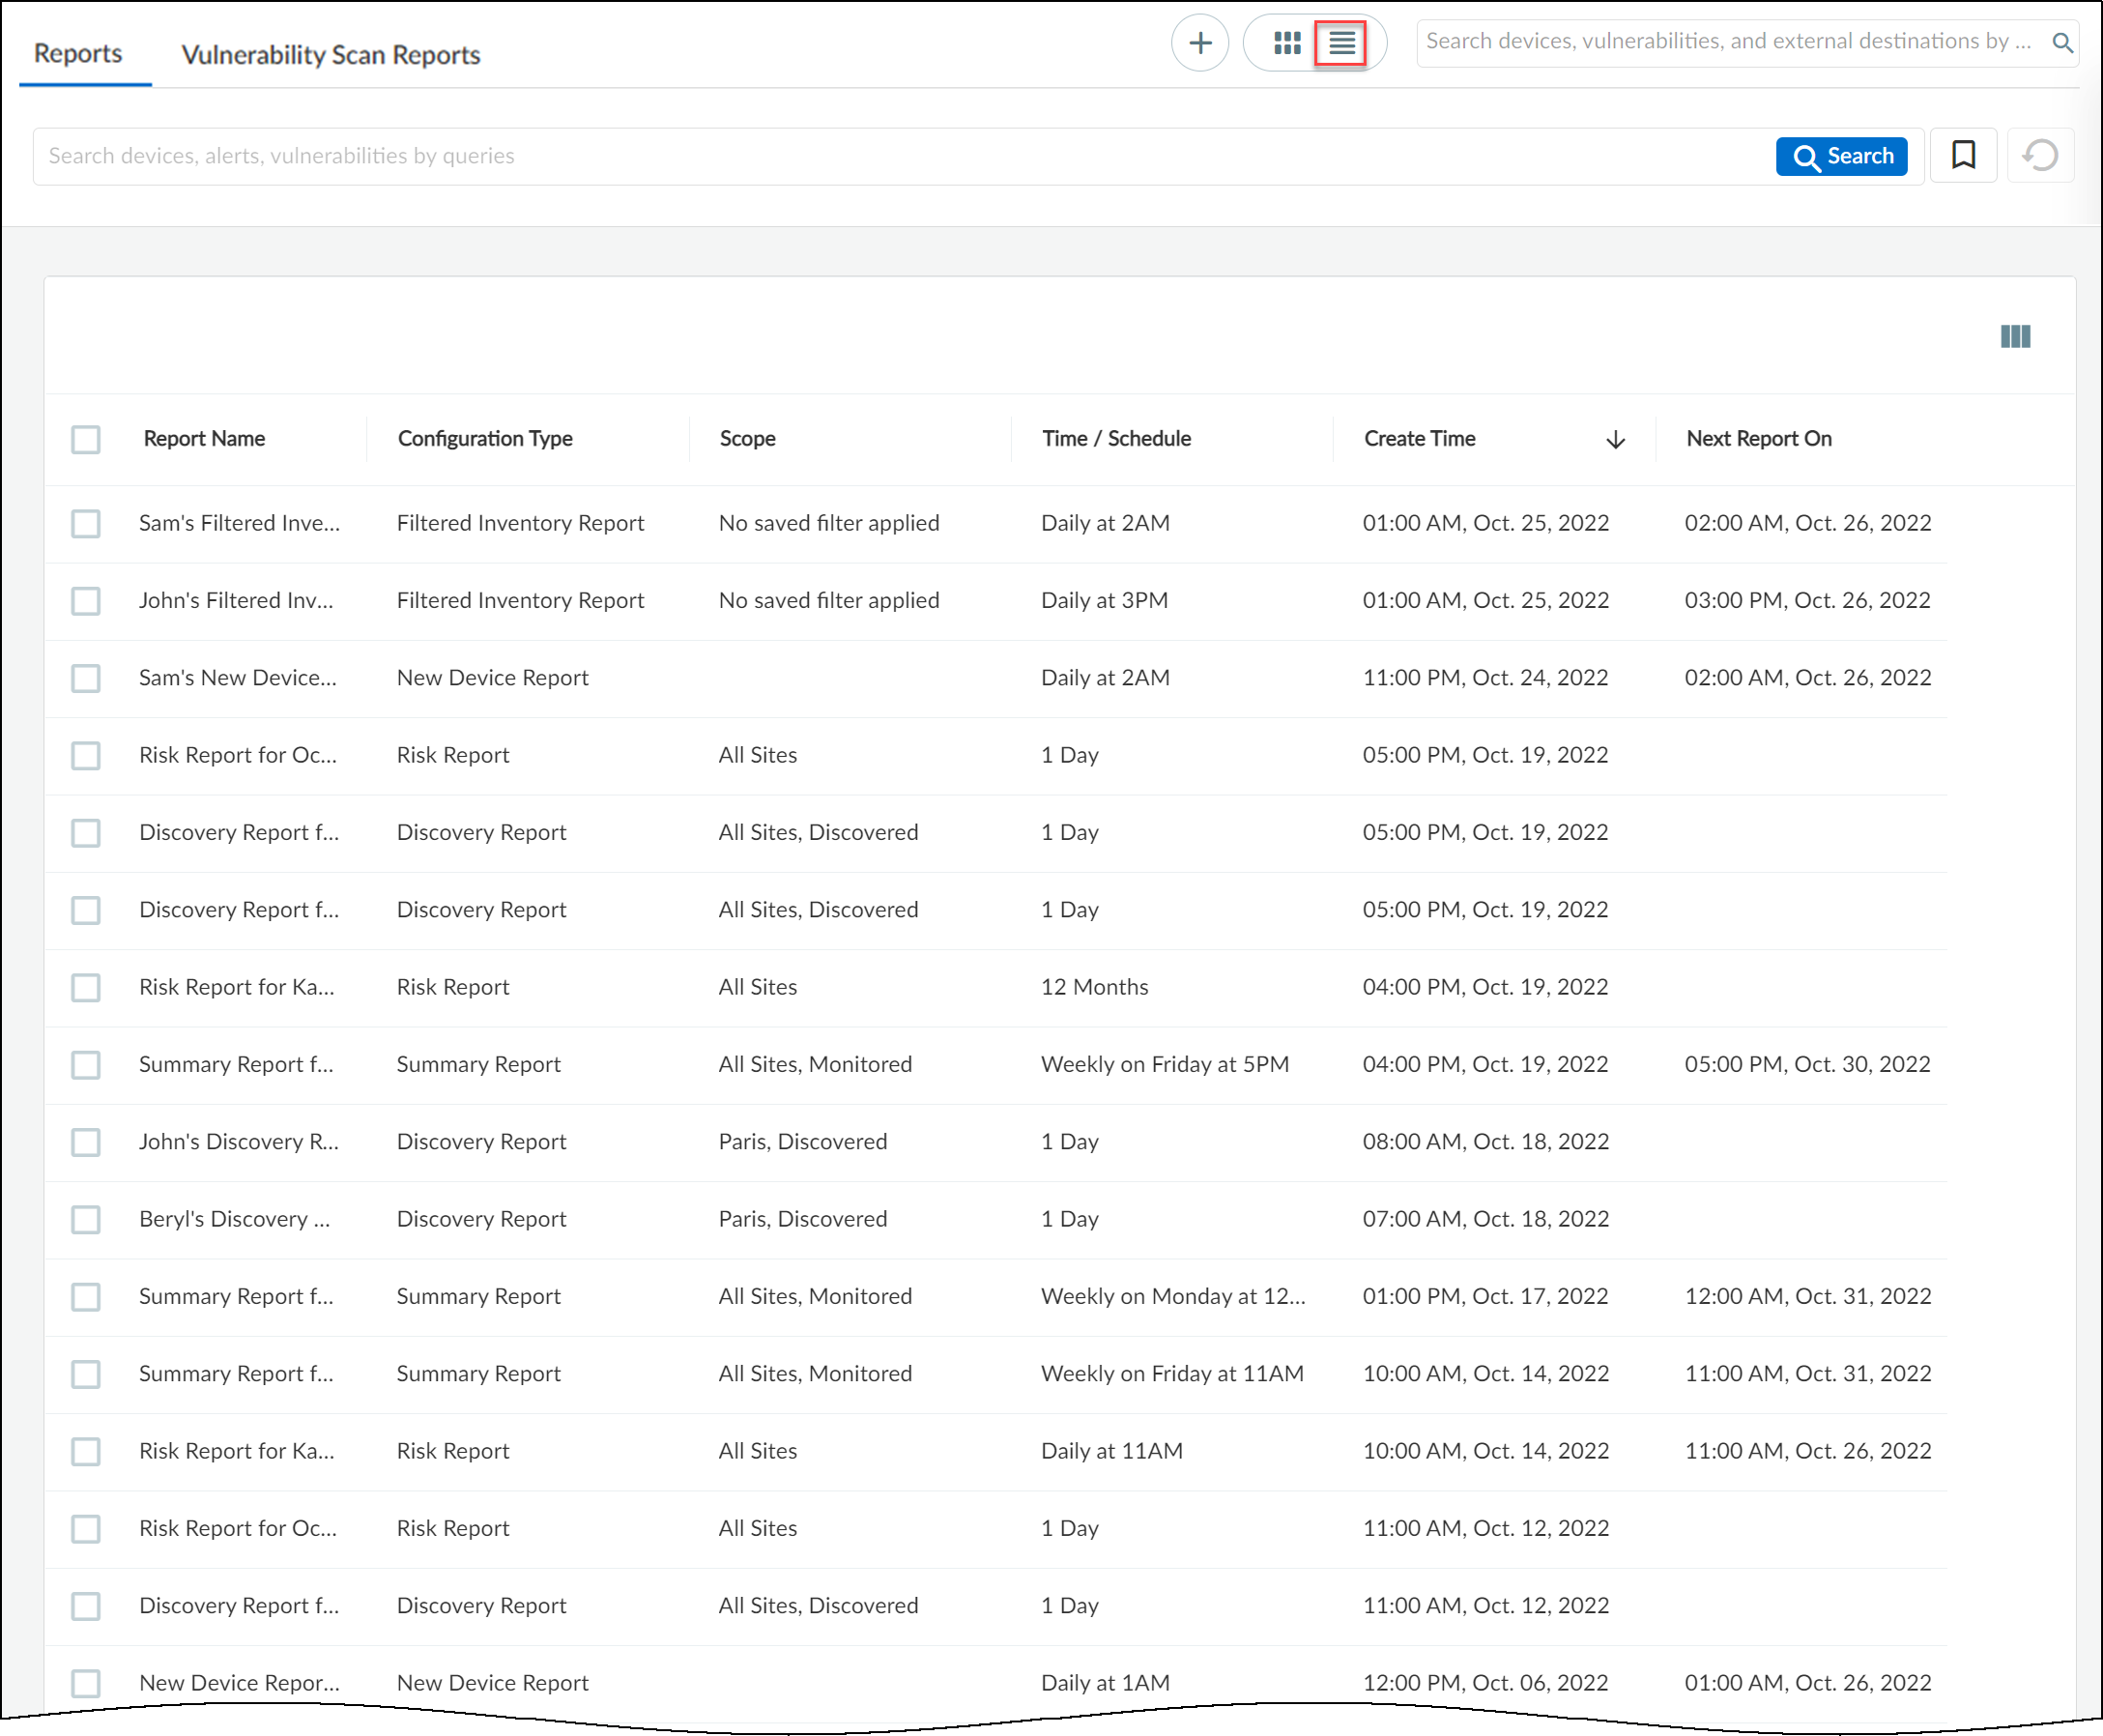
The list view on the Reports page displays all reports in a list format. You can sort the reports according to Report name, Configuration, Scope, and so on. You can delete a report only in the list view.
Similar reports by multiple users are grouped together under a single card in the card view. Similar reports by multiple users can be viewed by sorting them in the list view. A report generated by a user can have multiple versions.
View Report History ( n ) and View Report ( m ) of ( n )
View report history( n ) is different from View report ( m ) of ( n ) as can be seen in the following sample use case:
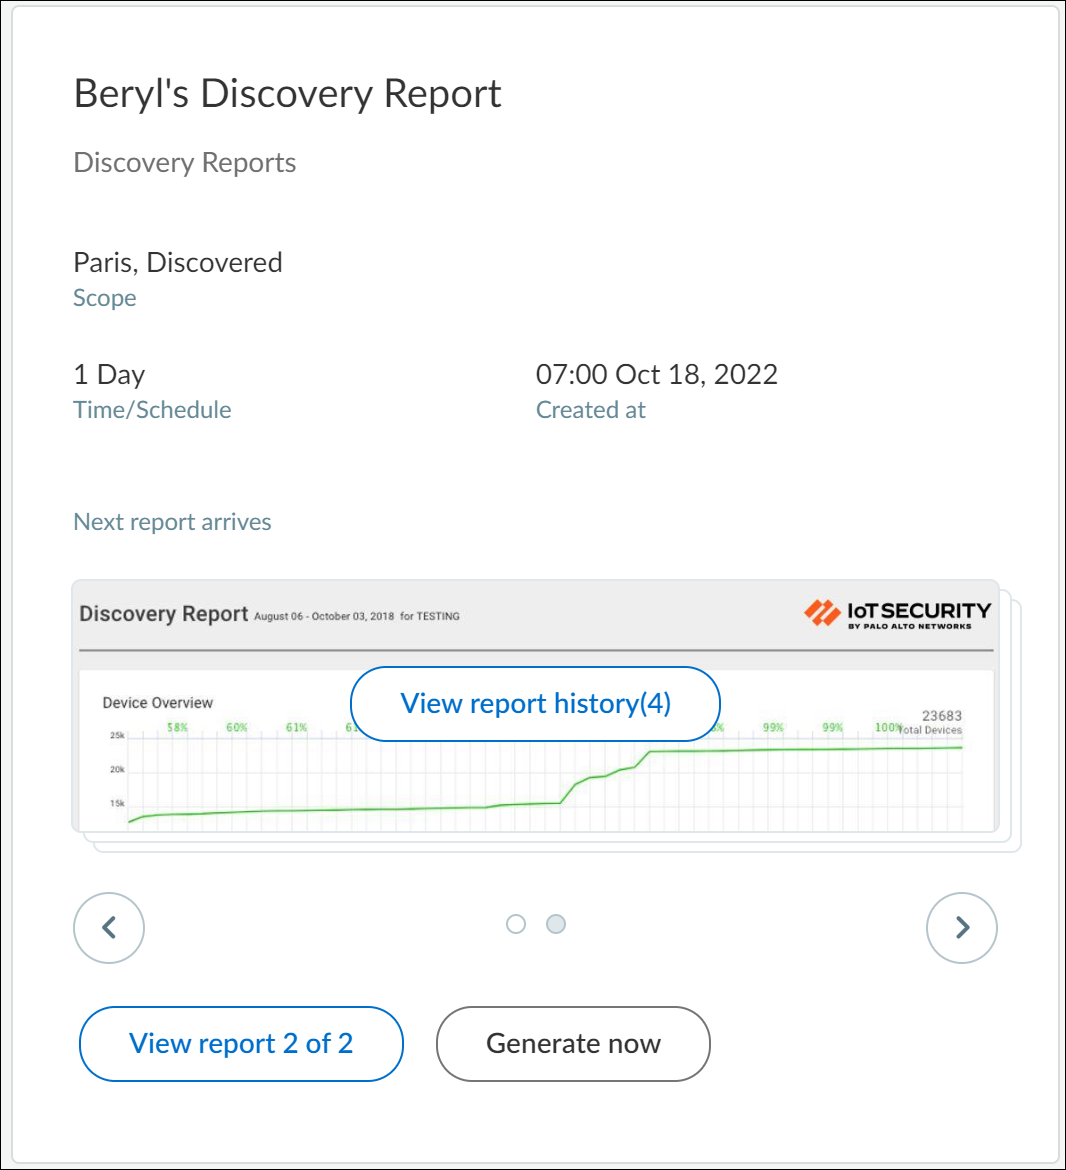
John and Beryl generate the same report: Discovery report with a scope set as “Paris, Discovered ” and a schedule set as 1 day. The reports of both are placed inside a single card. Each time John clicks Generate now to generate his report, the View report history (n) increases incrementally. For example, when you see View report history (3) for John’s report, it means that John has generated his report three times. So, View report history indicates the different versions of the same report by the same user. The View report 1 of 2 at the bottom indicates that this report (which is also the latest) was generated by John and that there’s a second, similar type of Discovery report generated by some other user.
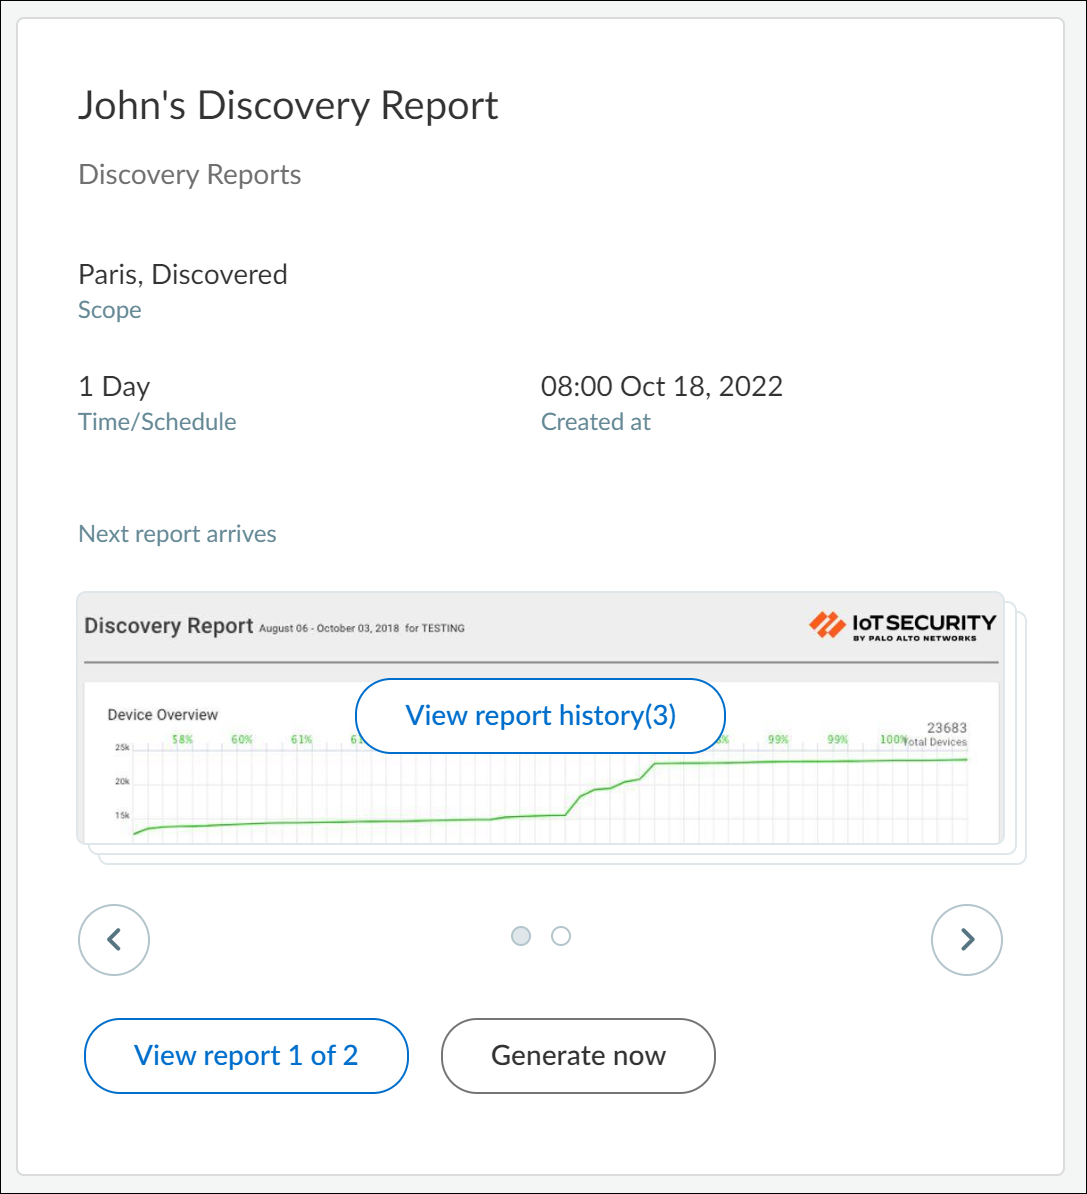
To view the second user’s report, click > at the bottom of the card, the number now changes to View report 2 of 2 (see image below). Report 2 was generated by Beryl. Beryl generated her report four times, so we now see View report history (4) .
View Reports in a Browser
Because Summary, Connectivity, Discovery, Risk, Inventory, and Utilization reports are generated as HTML, they can be viewed in a browser. To view your reports, click on View Report History (n) or View Report (m) of (n) on the report. You can also print and download them as PDF files.
Download Reports to View
Because New Device reports and Filtered Inventory reports are generated as .csv files, they can only be viewed in a spreadsheet reader or editor after downloading them. To download your reports, click on View Report History (n) or View Report (m) of (n) on the report.
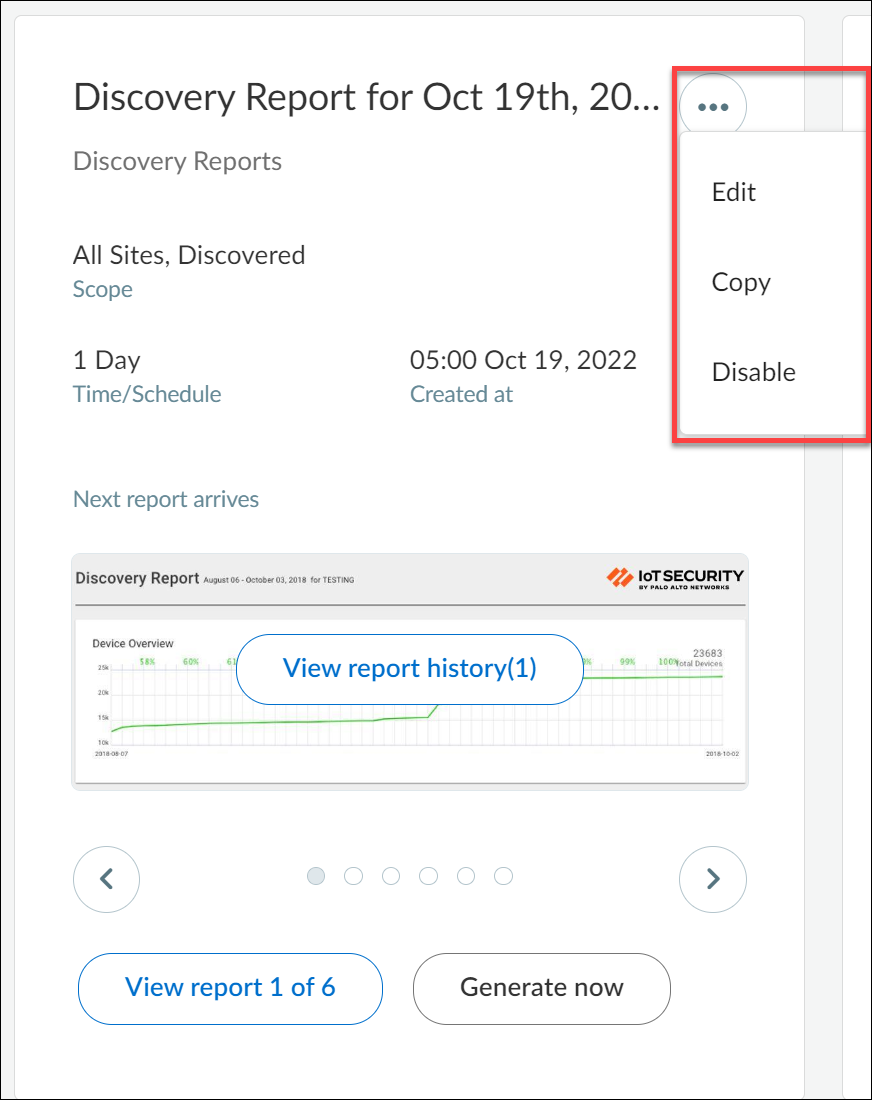
Edit, Copy, and Disable Reports
Click the Action menu icon ( ... ) on a report to edit, copy, and disable it.
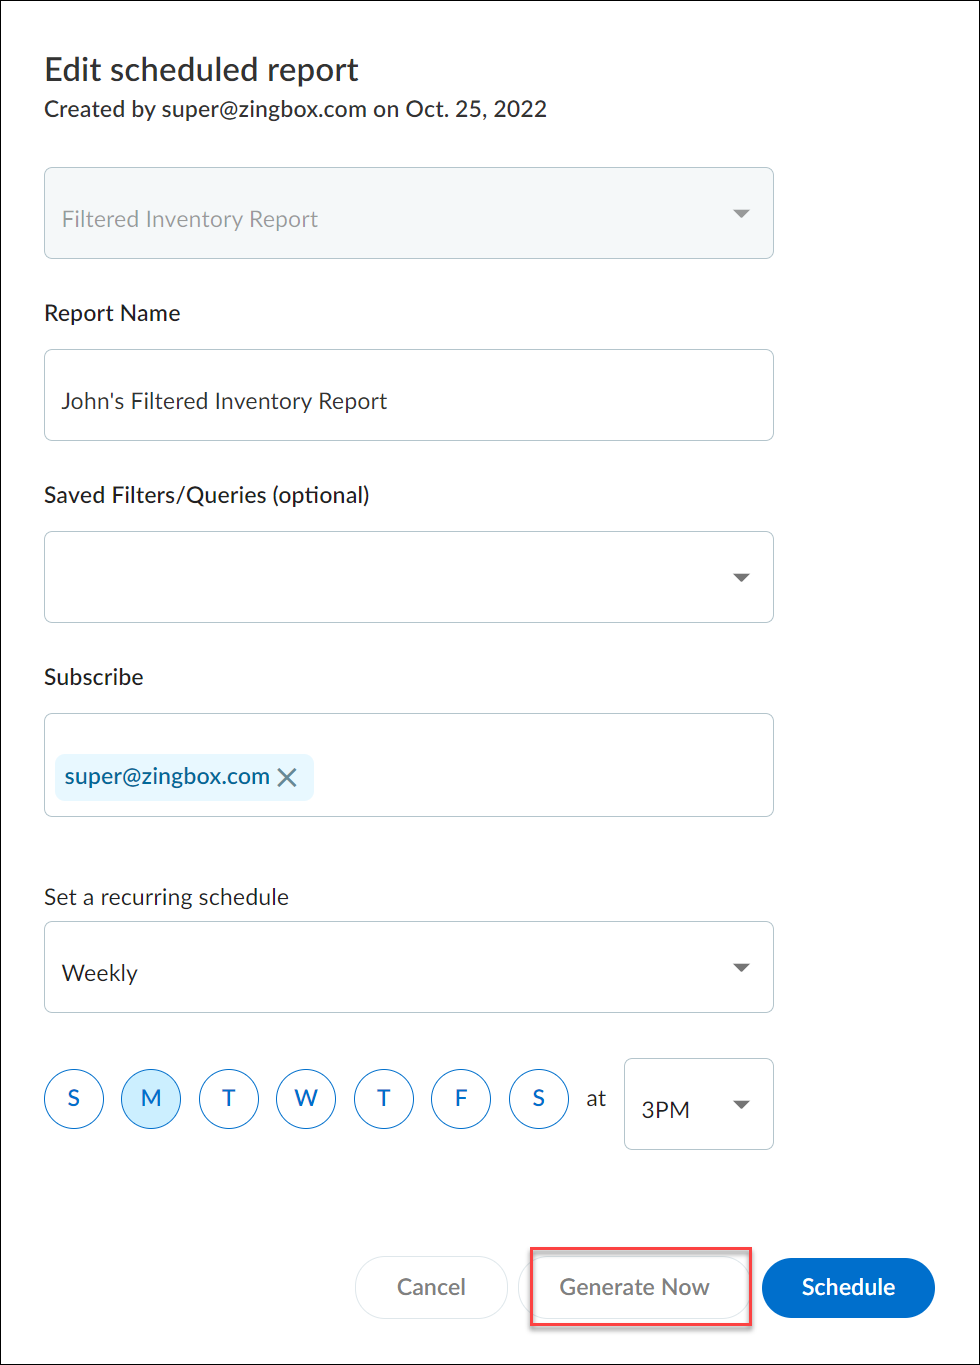
Edit Reports
Edit a report to adjust settings. For example, you might want to increase or decrease the frequency of a scheduled report or add or remove subscribed email addresses.
You can also generate a scheduled report on demand instead of waiting for the scheduled time. When you click EditGenerate Now for scheduled reports, IoT Security generates a report based on the period of time- daily , weekly, or monthly-that's set in the configuration, going back a day, a week, or a month from the moment you clicked Generate Now and generates a report for till that moment. For example, if you have a New Device report scheduled to be generated every Monday at 3:00 AM and you click Generate Now on Wednesday at 10:00 AM, you’ll then get a report for a full week (7 days) from the previous Wednesday at 10:00 AM up to the moment you clicked Generate Now .
Copy Reports
Copy a report to keep your original report but create another one based on it with some changes; for example, you might want to regularly generate two New Device reports-one report each day for a daily sanity check and another each month for a monthly team report.
Disable Reports
Disable a report to suspend its scheduled generation, perhaps during a scheduled network maintenance. However, you can still view existing reports while it’s disabled. You can enable the report again later when you want to resume its use.
IoT Security Integration Status with Firewalls
IoT Security Integration Status with Prisma Access
|
Where Can I Use This? |
What Do I Need? |
|
|
The Firewalls page ( AdministrationFirewallsFirewalls ) provides an overview of firewall connectivity and activity, the status of logs that firewalls send and the requests they make for policy rule recommendations and IP address-to-device mappings, and individual firewall details.
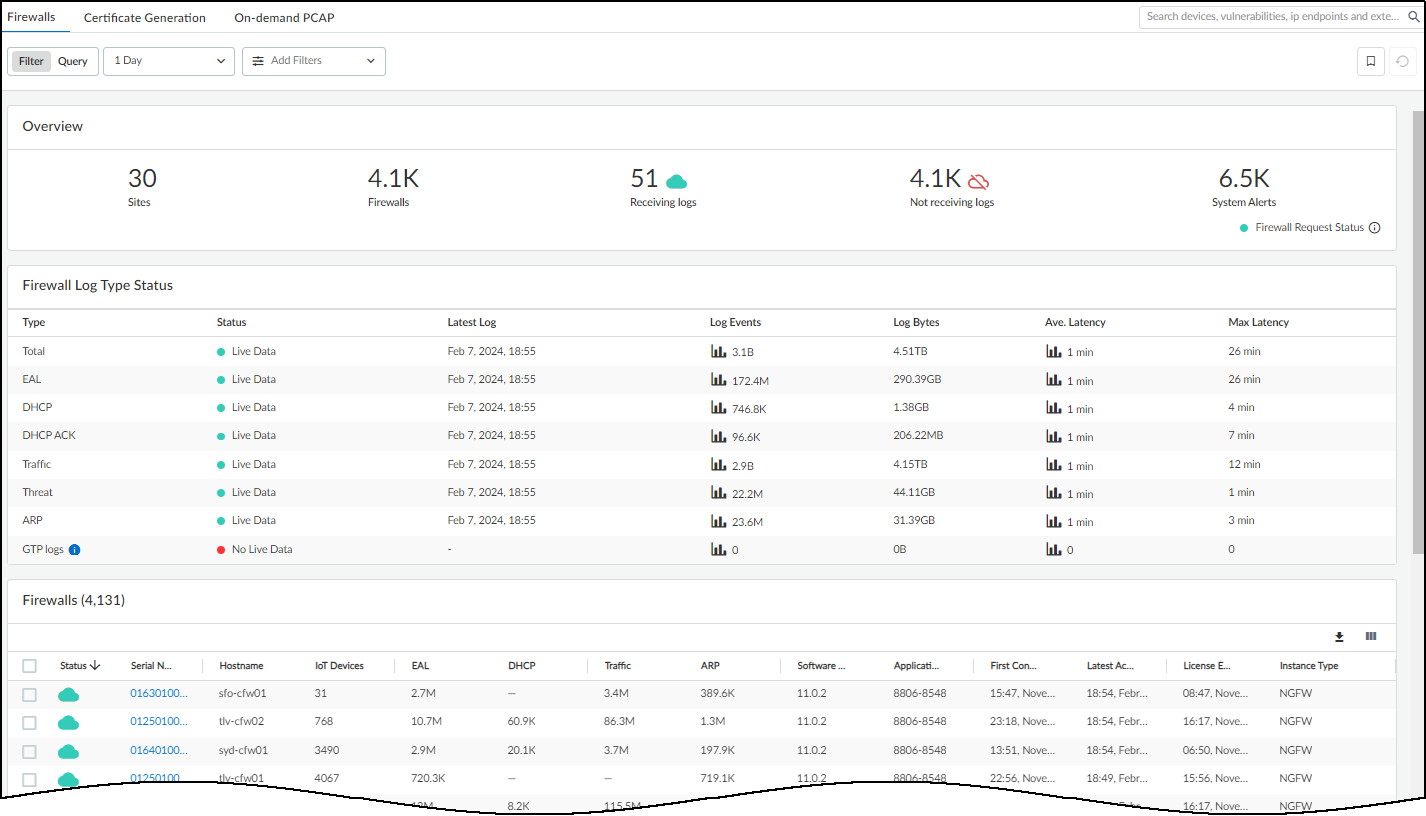
The overview at the top of the page shows how many sites are under IoT Security management, how many firewalls are subscribed to IoT Security, how many firewalls are active and from which IoT Security is receiving logs, how many firewalls IoT Security isn't receiving logs from, and how many system alerts there are. Click the system alerts number to view the list of alerts at AdministrationSystem Events .
IoT Security considers a firewall to be active if it received a log from it within the past 30 minutes, and if it doesn’t receive a log during this time, it automatically generates an alert. The Firewalls page also shows how many log events firewalls sent to IoT Security over the past 7 days, 24 hours, or hour (depending on the time filter you set), the time the last log was received, and the connectivity status of the firewalls.
IoT Security coordinates data received from all the firewalls at the same site. Not every firewall needs to send logs to IoT Security as long as other firewalls do and their logs capture network traffic data from all the IoT devices that you want IoT Security to monitor.
Hover your cursor over the Firewall Request Status icon to see if IoT Security is receiving requests from firewalls for policy recommendations and IP address-to-device mappings.
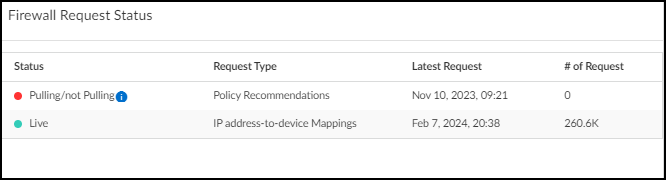
When IoT Security has received requests for one of these within the past 30 minutes, the status icon is green. Otherwise it's red.
For firewalls in an active/passive HA pair that have sent log events to IoT Security within the past 30 minutes, the status of the active firewall is shown as Receiving logs . The status of the passive firewall is usually shown as Not receiving logs except for a period of 30-60 minutes after it reboots. During this time, its status changes to Receiving logs before returning to Not receiving logs again. This is true for a passive firewall with physical interfaces and a passive firewall with aggregate interfaces without Link Aggregation Control Protocol (LACP) passive pre-negotiation configured. If the passive firewall has aggregate interfaces with LACP passive pre-negotiation configured, it always appears as Receiving logs because it continually sends learned ARP entries to IoT Security.
If you upgrade your firewalls from PAN-0S 9.x to 10.0 or later and notice that passive firewalls in HA pairs that appeared as Active in IoT Security now appear as Inactive, check if they have aggregate interfaces and if they have LACP passive pre-negotiation configured.
Firewalls send log events to the logging service, which streams them to IoT Security for analysis and, depending on your IoT Security subscription type, sends them to Strata Logging Service for storage. IoT Security then processes and analyzes the raw metadata it receives from the logging service and retains the data generated from its analysis for the following lengths of time:
- One month of data retention for device network traffic behavior
- One year of data retention for the following:
- Device identity
- Security alerts, risks, and vulnerabilities
- (Medical IoT) Device utilization
The above retention periods are for IoT Security. For more information about IoT Security data retention, see IoT Security . For information about Strata Logging Service data retention, see the Strata Logging Service Privacy Sheet .
The Firewall Log Type Status section shows whether or not IoT Security has received log events from the logging service for EAL, DHCP, DHCP ACK, ARP, traffic, and threat logs within the past 30 minutes. If it has, the status is Live Data . If it hasn’t, the status is No Live Data .
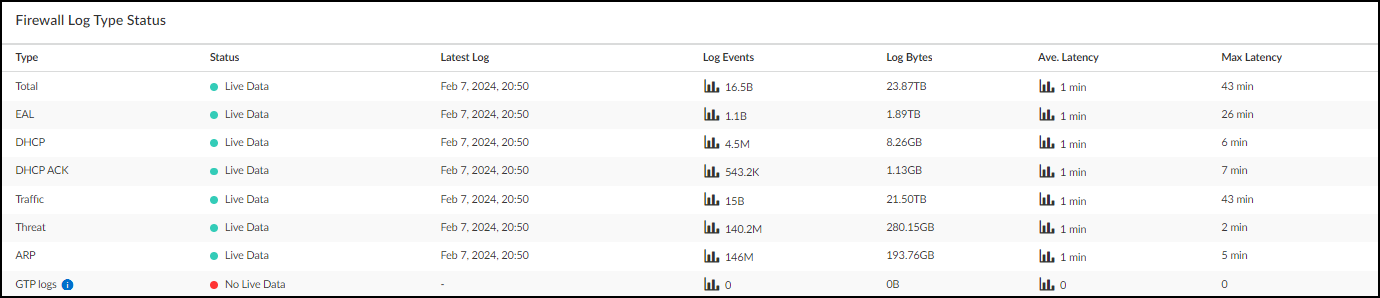
When the status is Live Data , it does not mean that all active firewalls have sent log events to the logging service within the past 30 minutes. Although that is possible, you can only safely deduce that at least one active firewall has done so and that the logging service has then streamed whatever log events it received to IoT Security. However, if the status is No Live Data , you can safely conclude that within the past 30 minutes the logging service has received no log events from any firewalls.
The status of firewalls in the overview section as Active or Inactive is not real-time data. It’s updated every 30 minutes on the hour and half hour. On the other hand, the firewall log type status is close to real time. Every time you refresh the page, the Firewall Log Type Status shows the current status of these four log types. As a result, a temporary mismatch can sometimes occur between the two status indicators.
Hover your cursor over the graph icon in the Log Events column to see a panel pop-up with information about each type of log.
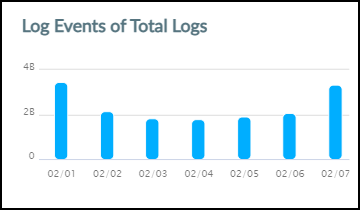
The panel contains a graph that shows the total number of log events that IoT Security received. When you set the time filter at the top of the page to 1 Week , the data is displayed in seven 24-hour intervals covering the last 7 days. When you set the filter to 1 Day , the data is displayed in six 4-hour intervals covering the last 24 hours. And when you set it to 1 Hour , the data is displayed in six 10-minute intervals for the last 60 minutes. Hover your cursor over various data points to see a tooltip with more information about it.
Hover your cursor over the graph icon in the Average Latency column to see a panel popup with information about the latency between the time that a firewall uploads logs to the logging service and the time that IoT Security receives them.
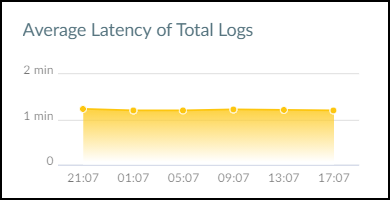
When you set the time filter at the top of the page to 1 Week , the average latency is displayed for each of the last 7 days. When you set the filter for 1 Day , the average latency is displayed in six 4-hour intervals covering the last 24 hours. When you set it to 1 Hour , the average latency is displayed in six 10-minute intervals for the last 60 minutes. Hover your cursor over various data points to see a tooltip with more information about it.
The remainder of the Firewalls page contains a table with all the firewalls subscribed to IoT Security services. You can use the column control tool (icon with three gray bars that appears above the table) to customize the data that appears in the table. In addition to the status, hostname, serial number, IP address (not visible by default) of a firewall and the version of PAN-OS running on it, the table displays several other data points. There are columns for the IoT dictionary version, application content version for App-ID, and firewall license type—Prod (Production), Eval (Evaluation), or Lab. You can also see the number of different types of log events from each firewall, the site where it’s located (not visible by default), when it first connected with IoT Security, and when it was last active.
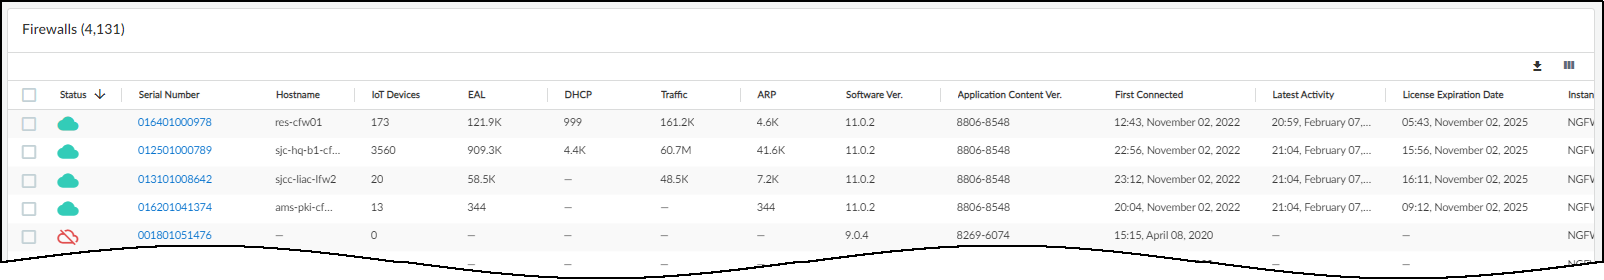
By default, the IoT Dictionary Version column is visible in the table. If it does not appear in the table, click the column visibility icon (three vertical bars) and select IoT Dictionary Ver . This column shows the version-build number of the dictionary file on each firewall. A new version is released every two weeks, with the build number incrementally increasing across versions. For example, version was 1-218 released, and then two weeks later (and two internal builds later) version 2-221 was released.
All firewalls should have the same IoT dictionary version; that is, the latest version. If a firewall is using an outdated dictionary—most likely because it cannot reach the update server—it cannot use Device-ID to enforce Security policy rules with complete accuracy. Take steps to restore its connectivity to the update server so the next time the firewall automatically checks its IoT dictionary version against the one on the server, which it does every two hours, it will detect a new version and download it.
Only firewalls running PAN-OS version 10.0 or later support Device-ID and IoT dictionaries. For firewalls running earlier versions of PAN-OS, a dash appears in this column.
The application content version determines the type of protocol data in the logs a firewall sends to IoT Security. A low version might not generate the IoT protocol logs that IoT Security needs.
The far-right column provides options to move a firewall from one site to another.
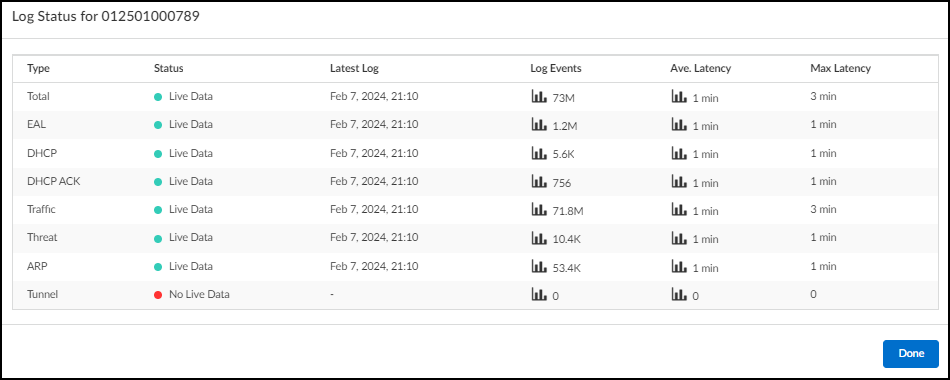
If you click a firewall serial number, a pop-panel appears with information about the logs from this firewall. You can see if IoT Security is currently receiving live data, timestamps of the latest logs, the number of events received, the average latency, and the maximum latency within the time filter specified for the Firewalls page ( 1 Week , 1 Day , or 1 Hour ).
oT Security Integration Status with Prisma Access
IoT Security Integration Status with Firewalls
|
Where Can I Use This? |
What Do I Need? |
|
|
In the IoT Security portal, the Sites and Firewalls pages provide the status of next-generation firewalls with active IoT Security subscriptions. They show the total number of firewalls at each site, the connection status of each firewall, the total number of log events they’ve forwarded to logging services, and the types of logs they’re sending. However, when Prisma Access subscribes to IoT Security through the IoT Security add-on, the information displayed on these pages is unlike that shown for next-generation firewalls.
Sites
When Prisma Access is using an IoT Security add-on, the site name for it on the NetworksNetworks and SitesSites page is simply “Prisma Access”. Whether a single Prisma Access instance is protecting one or a hundred remote sites, IoT Security remains unaware of their number. From the perspective of IoT Security, the numbers of devices and IoT devices come from a single Prisma Access entity regardless of how many remote sites it protects.
The following screen capture shows a mixed deployment of Prisma Access and several sites with on-premises next-generation firewalls for comparison.
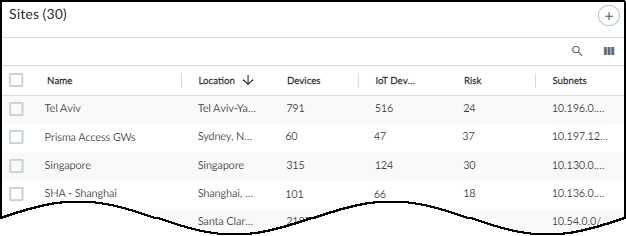
The Sites page contains the following types of information for Prisma Access:
Status : A green cloud means that IoT Security is connected to Prisma Access and is receiving logs. A red cloud with a line through it means that IoT Security does not detect logs forwarded from Prisma Access to Strata Logging Service.
Name : Prisma Access
Location : This is the site location, if a location was previously defined.
Devices : This is the total number of devices that IoT Security identified across all remote sites under Prisma Access protection.
IoT Devices : This is the total number of IoT devices that Prisma Access identified across all its remote sites. This is a subset of the total shown in the Devices column.
Risk : This is the overall risk score calculated for all IoT devices protected by Prisma Access.
Subnets : These are the subnets across all Prisma Access remote sites. Because IoT Security has no visibility into how many sites Prisma Access is protecting, this might come from a single site with a single subnet, a single site with multiple subnets, multiple sites each with a single unique subnet, multiple sites with multiple subnets, or any combination of these scenarios.
Group : This indicates the group within the hierarchical site organization where the site is positioned.
Source : If IoT Security has a third-party integration with BlueCat IPAM or Infoblox IPAM and learns site names from there, the name of the integration appears here. When a third-party integration isn't how IoT Security learned of a site, a dash appears here.
Firewalls
This page ( AdministrationFirewallsFirewalls ) is not particularly applicable to Prisma Access. If you are using IoT Security exclusively with Prisma Access, the top of the page shows a total of two sites, one for Prisma Access and one for the default site, which is where IoT Security initially assigns on-premises firewalls. The Active and Inactive status will be 1 or 0 depending on whether IoT Security detects any logs from Prisma Access to Strata Logging Service in the last 30 minutes.
IoT Security displays the number of system alerts relating to Prisma Access. These pertain to the reception of requests from Prisma Access for policy recommendations and IP address-to-device mappings. For example:
IoT Security hasn't received any requests for policy recommendations in the past 30 minutes.
IoT Security is receiving requests for IP address-to-device mappings again.
Click the number of system alerts at the top of the Firewalls page to open AdministrationSystem Events to see them. The source for Prisma Access system alerts is always All firewalls .
The rest of the Firewalls page doesn’t have any data relevant to Prisma Access.
If your deployment includes a mix of Prisma Access and on-premises next-generation firewalls, then this page contains the information mentioned above for Prisma Access and much more information about firewalls and the logs they provide.
Data Quality Diagnostics
IoT Security Integration Status with Prisma Access
|
Where Can I Use This? |
What Do I Need? |
|
|
The quality of the network data that firewalls process and forward to the logging service directly impacts the quality of analysis that IoT Security is able to make. The AdministrationData Quality page is where you can see the quality of data that IoT Security has to work with. Two key factors are IP endpoints and low-confidence devices.
IP endpoints are devices without a unique identifier, making them untrackable over time. When IoT Security cannot locate a unique device identifier for a device, it categorizes it as an IP endpoint. This typically happens when IoT Security knows the IP address but not MAC address of a device through DHCP or ARP, and when IoT Security knows the IP address of a device but its device profile isn't stable enough to classify it as a static IP device. In the first case, the MAC address is the unique identifier for a DHCP client. In the second case, the IP address is the unique identifier for a static IP device if its profile is stable enough to show that the IP address isn't shifting among different DHCP clients.
Low-confidence devices are devices that IoT Security can identify with a confidence level under 70%. One of the fundamental services that IoT Security provides is identifying network-connected devices and assigning device profiles to them. It considers a host of factors throughout this process and creates a confidence score for each identification. The score is a number between 0-100, with 100 being the most confident. The confidence level is important because IoT Security only sends a firewall an IP address-to-device mapping if the confidence score for a device identity is high (90-100%), and if it has sent or received traffic within the past hour.
A confidence score indicates the level of confidence IoT Security has in its identification of a device. IoT Security has three confidence levels based on calculated confidence scores: high (90-100%), medium (70-89%), and low (0-69%).
When firewalls forward fewer data logs to the logging service for IoT Security to analyze, it tends to identify devices less confidently. On the other hand, when firewalls forward more logs to the logging service, the more confidently IoT Security can identify devices and the more thoroughly it can baseline their behaviors. This results in higher device identity confidence scores.
This page shows the number of IP endpoints and low-confidence devices on the network and the percent of devices that fall into these two categories in relation to the overall number of devices on the network. You can infer the quality of device data that IoT Security is receiving from these numbers, which are taken from all devices over the last 30 days.
Each deployment has its unique characteristics and your reason for using IoT Security will determine the acceptable percent of IP endpoints and low-confidence devices on the network. For example, if your goal is to discover, identify, and protect only IoT devices, you might only use IoT Security with one or two firewalls near them. In this case, an acceptable percentage of IP endpoints and low-confidence devices would be fairly close to the percentage of non-IoT devices on the network. In short, consider what your goal is and use the data here to see how close you are to it. If there are more IP endpoints and low-confidence devices than you would like on your network, consider the recommendations offered on the page and follow those you think will reduce these numbers.
It’s good practice to check Data Quality Diagnostics weekly for the first few months after deployment to make sure IoT Security is getting the data it needs to identify devices and, if not, make adjustments as needed. After you’re satisfied, return periodically for spot checks and as follow-up whenever there are changes to the network.
Authorize On-demand PCAP
Get Started with Enterprise IoT Security
|
Where Can I Use This? |
What Do I Need? |
|
|
The On-demand Packet Capture (PCAP) feature for next-generation firewalls allows you to authorize the IoT Security Research Team to perform packet captures and automatically upload the captured packet files to IoT Security for offline analysis. The IoT Security Research Team takes packet captures only when necessary, such as when an unknown device or an unknown application appears on your network and the information required to assess the situation can be obtained no other way. The scope of such packet captures is limited so that they don’t affect normal firewall operations.
PCAP files are securely stored and only accessed by IoT Security Research Team members. The files will be deleted either manually after an analysis is complete or automatically after 30 days elapse.
For the IoT Security Research Team to use PCAP to collect network traffic metadata from a firewall, you must first authorize the firewall to allow packet capturing.
To support PCAP on firewalls, they must be running:
- PAN-OS 10.2.10 or later 10.2 releases
- PAN-OS 11.0.4 or later 11.0 releases
- PAN-OS 11.1.0 or later
- Log in to PAN-OS and install the openconfig plugin.
- Select DevicePlugins and search for openconfig .
- Download version 2.1.0 or later and then Install it.
- Log in to the IoT Security portal with a user account with administrator or owner privileges.
- Authorize PCAP on one or more firewalls.
- Select AdministrationFirewallsOn -demand PCAP and then click the Add ( + ) icon.
- Choose the firewall either by its serial number or by the concatenation of its serial number and name.
- Set the time period to authorize PCAP on the firewall, which can be for 1 month, 3 months, or an unlimited length of time.
When an authorization period expires, PCAP is no longer authorized on the firewall. If you want, you can reauthorize PCAP on it. You can then see the new PCAP authorization period in the list of authorized firewalls.
- Confirm the authorization.
- To authorize PCAP on additional firewalls, repeat these steps.
- Unauthorize PCAP on one or more firewalls.
When you want to deauthorize PCAP on firewalls.
- Select one or more firewalls in the Authorized Firewalls list.
- Unauthorize the selected firewalls.
If you want to deauthorize PCAP on just one firewall, you can also click the Reauthorize icon for it in the Actions column.