IoT Administration and Security Concepts
This guide consolidates information regarding the administration of IoT networks using Palo Alto Networks' IoT Security solution. Use the navigation above to explore topics like network configuration, device discovery, inventory management, risk assessment, policy recommendations, health monitoring, and test your knowledge with the quiz.
Prerequisites
Most features described require an active IoT Security subscription for an advanced product tier (Enterprise Plus, Industrial OT, or Medical).
Configure IoT Networks
IoT Security integrates network infrastructure details with physical or logical site information to build a comprehensive model of your organization's network topology. This combined view significantly improves device discovery, classification accuracy, and risk assessment effectiveness.
Networks and Network Segments
Networks represent logical groupings of IP subnets , mirroring your network's structure. IoT Security learns these networks through various methods:
- Observing firewall traffic.
- Integrating with IP Address Management (IPAM) systems (e.g., BlueCat, Infoblox).
- Performing SNMP crawls of network devices.
- Manual subnet uploads by administrators.
Based on discovered subnets, IoT Security also defines appropriate Classless Inter-Domain Routing (CIDR) blocks.
Within these networks, you can define Network Segments . This is particularly useful when different sites reuse the same IP address ranges (overlapping IPs) . Segments allow for finer granularity in organizing devices and applying policies, grouping devices with similar functions or security needs.
Sites and Site Groups
Sites represent physical locations (like campuses or offices) or logical groupings (like business units) within your infrastructure. They overlay the network architecture.
A hierarchical site structure (e.g., Country > Region > Campus > Building) facilitates efficient multi-site management and allows for location-specific policies. Parent sites can encompass child sites, mirroring organizational layouts.
Integrated Topology View
By combining network and site information, IoT Security develops a deep understanding of your network topology. This enables:
- Accurate Discovery: Devices are identified within the context of their network *and* site location.
- Precise Classification: Device characteristics are analyzed alongside network segment and site context.
- Automated Mapping: Discovered devices are automatically mapped to sites based on network location (or firewall location, depending on configuration).
- Contextual Risk Assessment: Risks are evaluated considering network exposure, site-specific threats, and the device's role within its segment.
- Targeted Policy Enforcement: Using Device-ID, security policies can be applied based on a combination of network, segment, and site parameters.
This flexible model adapts to various network architectures, from single offices to complex global enterprises.
Device-to-Site Mapping
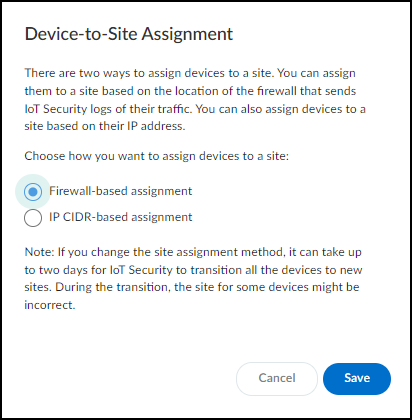
IoT Security offers two primary methods to associate devices with specific sites:
-
IP Address-based Site Assignment ( Preferred & Default for New Tenants ):
- Devices are assigned to a site based on their IP address falling within a pre-defined subnet or CIDR block associated with that site.
- Configuration involves defining IP blocks/subnets on the Networks > Networks and Sites > Networks page and then assigning these blocks to specific sites on the Networks > Networks and Sites > Sites page.
- This method effectively handles scenarios where devices from different sites communicate , as the IP address space clearly defines the location.
- When defining blocks for a site, using the largest encompassing block (e.g., 10.55.0.0/16) is often sufficient, as IoT Security automatically maps smaller subnets within that block (e.g., 10.55.10.0/24) to the same site.
- Devices in subnets not explicitly mapped to a user-defined site are assigned to the "Default" site.
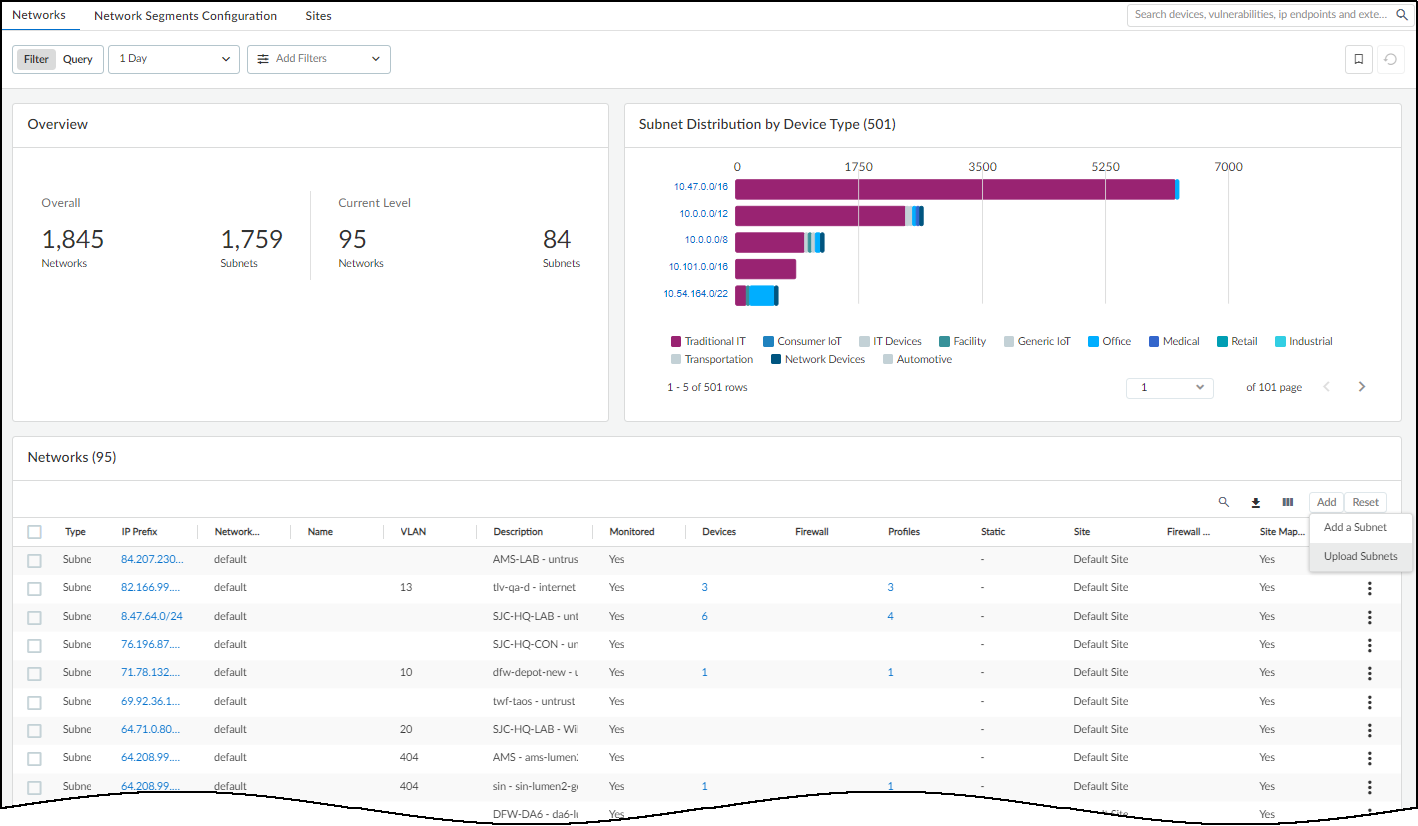
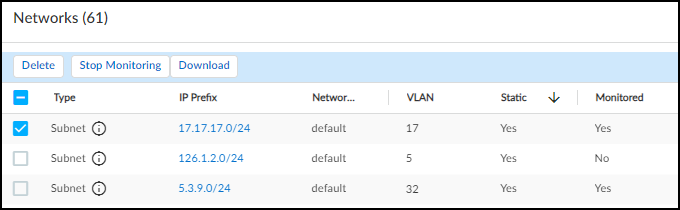
Adding or uploading subnets on the Networks page. 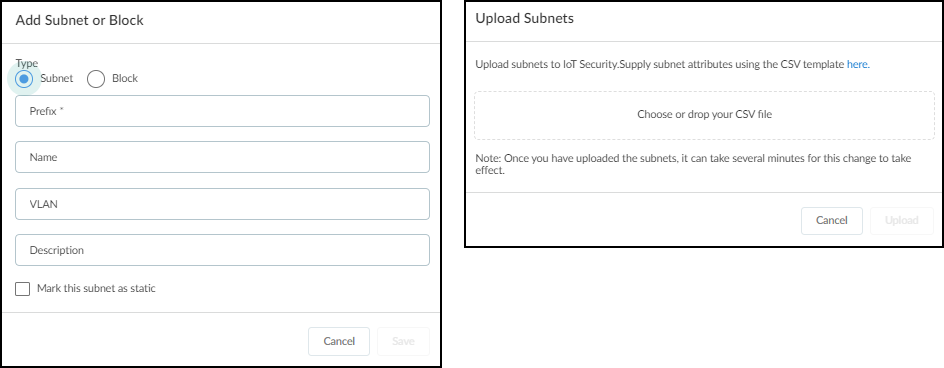
Dialog for adding a single subnet. 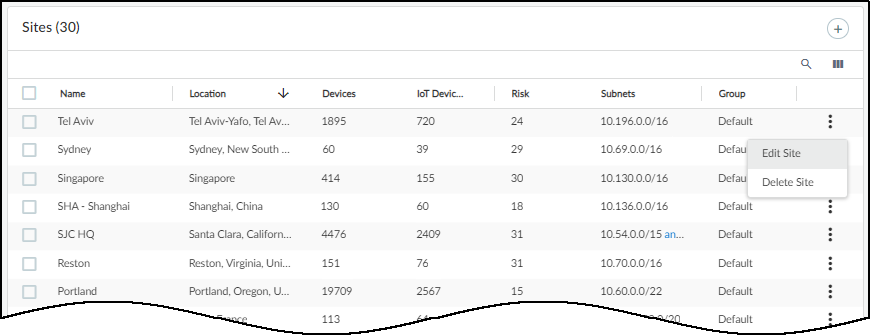
Assigning subnets to a site during site creation/editing. -
Firewall-based Site Assignment (Legacy Method):
- Devices are assigned to the site associated with the firewall that sends their traffic logs to IoT Security.
- Configuration involves assigning each firewall to a site on the Administration > Firewalls page.
- This method works well for simple, single-site deployments.
- Gotcha! It can become ambiguous in multi-site environments where firewalls at different locations might log traffic for the *same* inter-site communication session , making it hard to pinpoint the actual device location.
- Devices associated with firewalls not assigned to a specific site are placed in the "Default" site.
Changing the site assignment for a firewall. 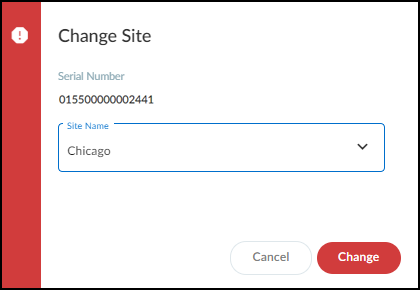
Selecting the target site for firewall assignment.
Changing Assignment Method (Firewall to IP-based)
Important: Only users with owner privileges can perform this change. Existing tenants using the firewall-based method can switch to the IP address-based method. Gotcha! This is a one-time, irreversible change .
- Ensure IP CIDR blocks for all sites are defined under Networks > Networks and Sites > Networks and assigned to sites under Networks > Networks and Sites > Sites .
- Navigate to Networks > Networks and Sites > Sites .
-
Click the gear icon (
 ) in the Sites panel.
- Switch the assignment from Firewall-based assignment to IP CIDR-based assignment .
- Save the change and confirm the irreversible action.
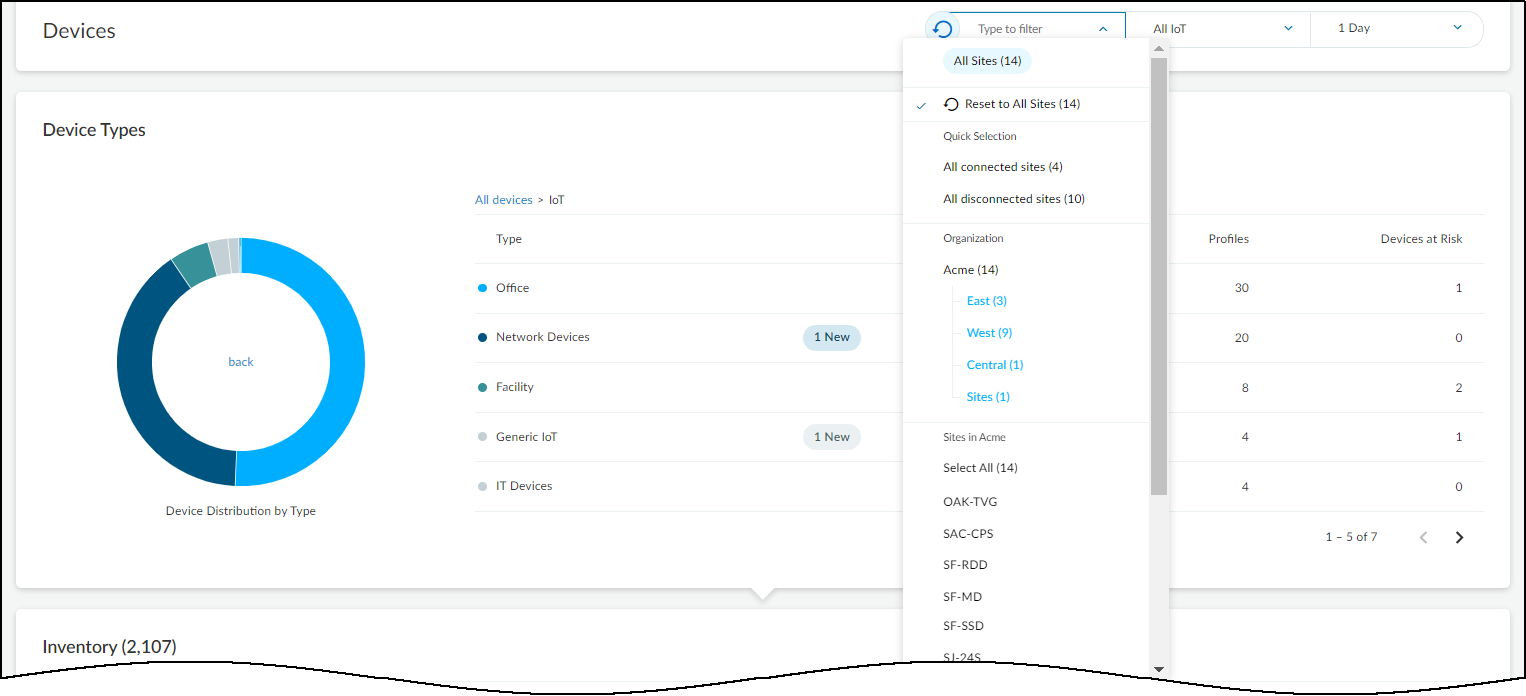
Remark: The transition can take up to two days , during which some site assignments might be temporarily incorrect. After switching, verify subnet mappings under Networks > Networks and Sites > Networks . The "Site Mapping" column indicates if a subnet was manually mapped ('Yes') or inherited mapping from a larger block ('No'). Filters related to firewall connection status ('All connected sites', 'All disconnected sites') are removed as firewalls are no longer directly linked to sites in this mode.

Sites and Site Groups
Sites represent physical locations or logical groupings within your organization's network. Organizing sites helps in managing devices and applying policies effectively across different parts of your infrastructure. Important: Only users with owner privileges can manage sites and site groups.
Managing Sites
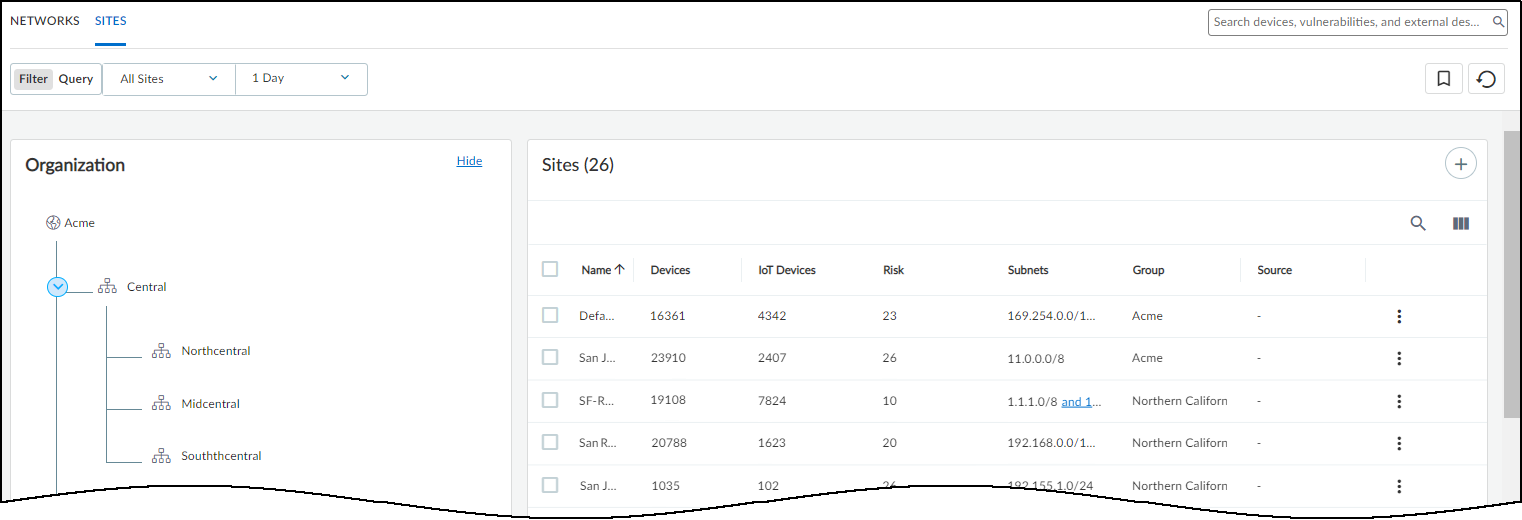
Navigate to Networks > Networks and Sites > Sites to manage sites.
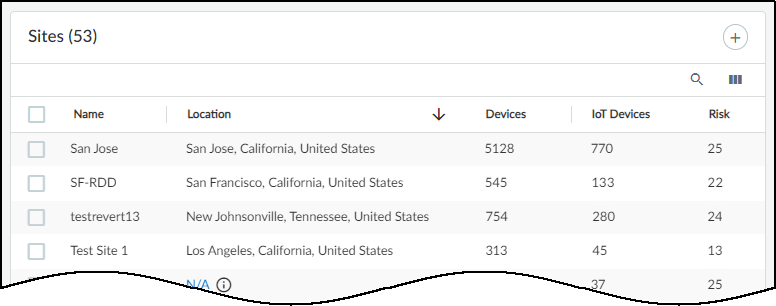
The page includes:
- A global filter bar for site and time range.
- An (optional) Organization section showing the site hierarchy.
- A table listing individual sites with details.
The "Default" site initially holds unassigned IP blocks/subnets or devices.
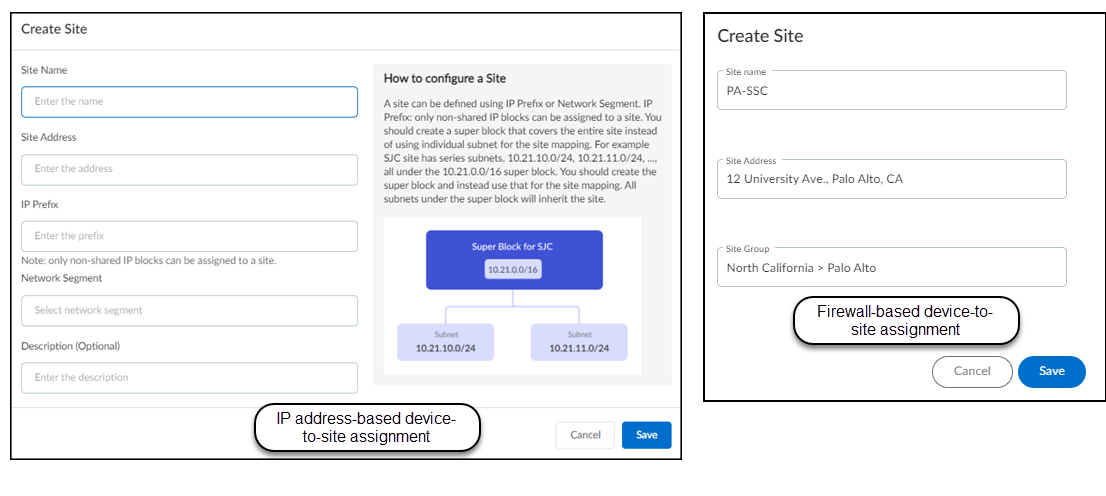
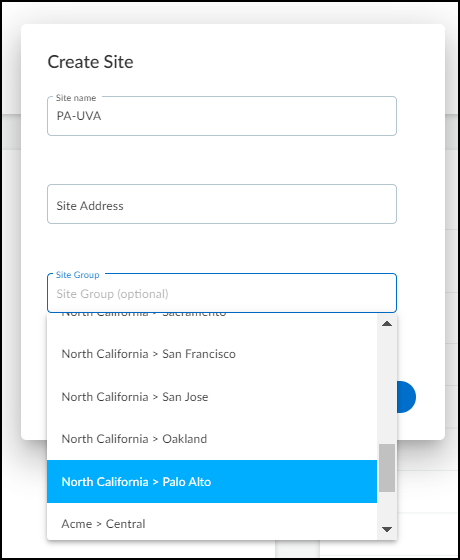
Adding a Site:
- Click the '+' icon above the Sites table.
- Enter a Site Name .
- (Optional) Enter a Site Address and Description .
- If using IP-based assignment: Select the IP prefix (CIDR block or subnet) or Network Segment associated with this site.
- If using Firewall-based assignment: Optionally assign the site to a Site Group. (Firewalls are assigned separately).
- Save the site.
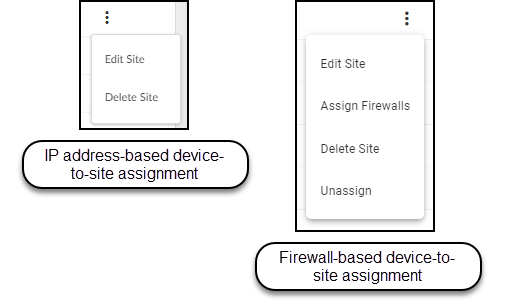
Editing/Deleting a Site:
- Click the three vertical dots ('...') next to a site row for options like Edit, Delete, Assign Firewalls (Firewall-based only), Assign to Group, etc.
- Gotcha! Before deleting a site (using Firewall-based assignment), all associated firewalls must be removed or reassigned.
- Gotcha! Before deleting a site (using IP-based assignment), all associated IP blocks/subnets must be unassigned.
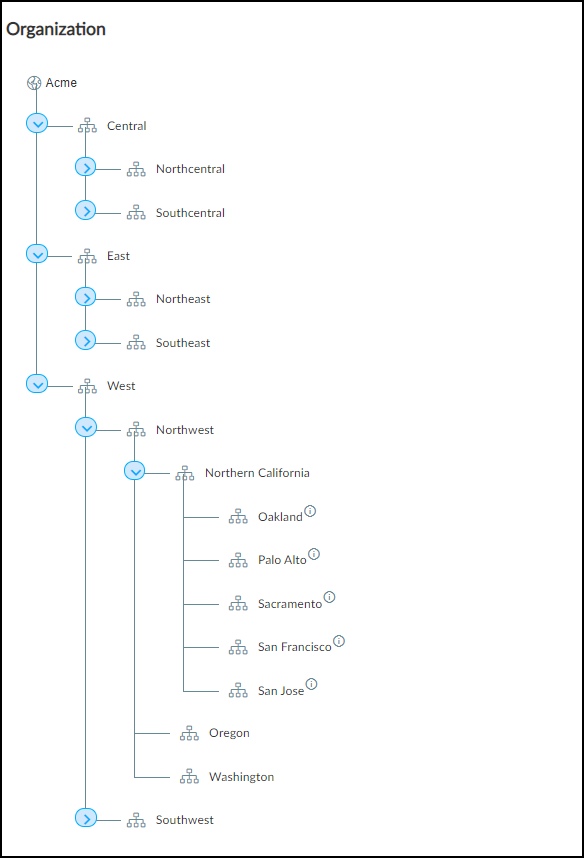
Organizing Sites into Groups (Optional Hierarchy)
You can create a hierarchical structure ( up to 5 levels ) to group sites, reflecting organizational divisions like regions, states, or cities. This aids in filtering data and managing user access.
- Click Show Organization and then Organize Sites on the Sites page to reveal the hierarchy panel.
- The root node (often the tenant name) contains all sites by default.
-
Hover over an existing group and click the 'Add group' icon (
 ) to add a child group.
- Use the '...' menu next to a group to Rename or Delete it.
- Important: Ensure the global filter is set to "All Sites" when building the hierarchy to prevent the panel from collapsing unexpectedly.
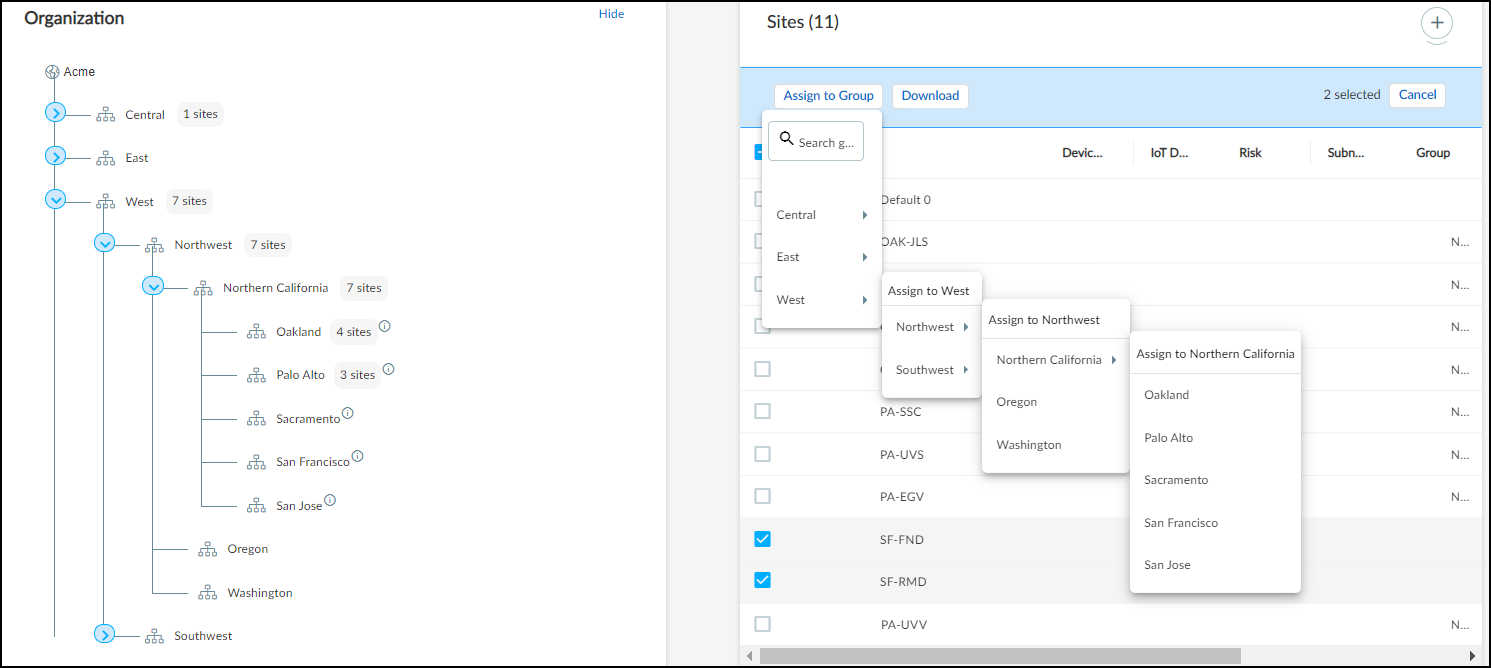
Assigning Sites to Groups:
- Select one or more sites in the table, click Assign to Group , and choose the target group.
- Alternatively, assign a site to a group during site creation/editing via the "Site Group" option.
Group Management Notes:
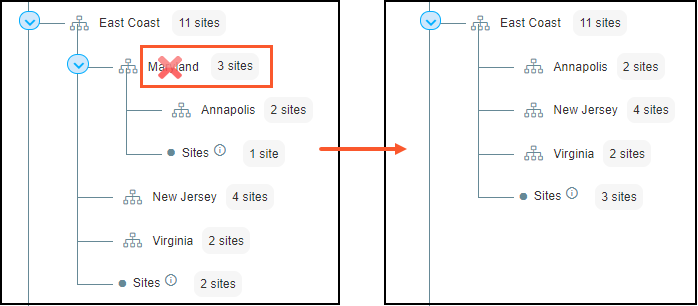
- Remark: Deleting a group reassigns its sites and child groups to the parent group.
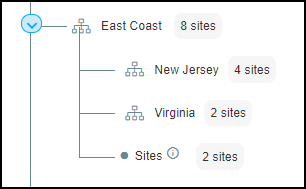
- You can unassign a site from its group using the '...' menu for the site, moving it back to the root node.
- When a group contains both subgroups and directly assigned sites, a "Sites" node appears under it in the tree.
Using Site Groups for Filtering and Access Control
- Clicking a group name in the Organization tree filters the Sites table to show only sites within that group and its subgroups.
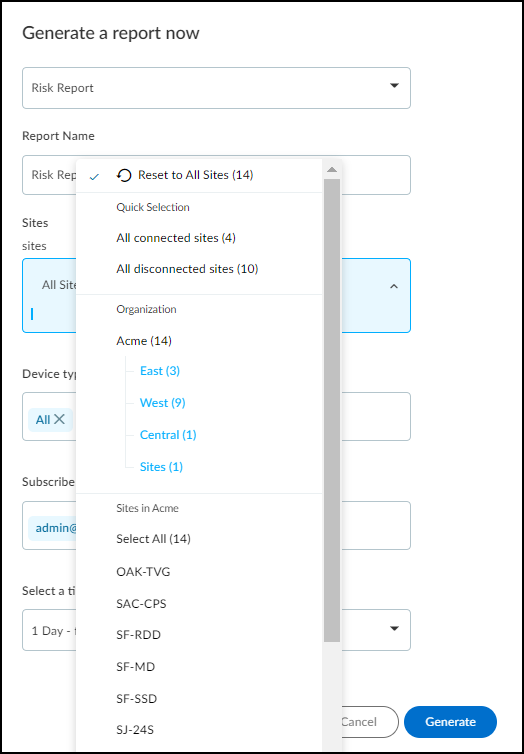
- The global site filter (top of pages like Devices, Reports) also includes site groups for filtering data across the portal.
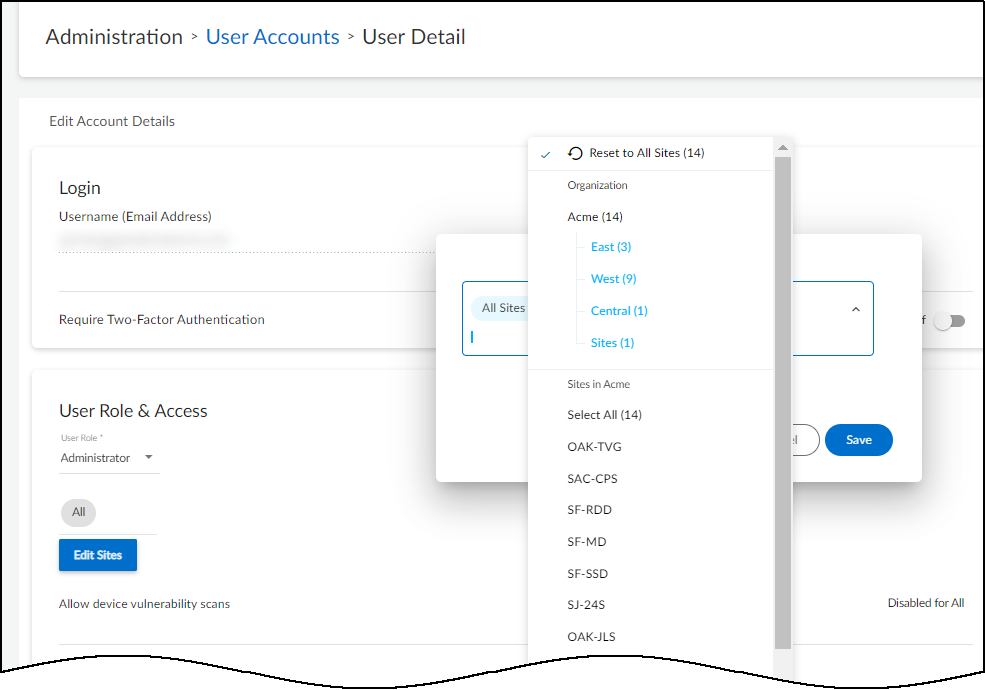
- Important: Users with owner privileges can restrict other users' access to specific sites or site groups via Administration > User Accounts > *username* > User Role & Access . Granting access to one specific site/group revokes the default "all access".
Networks
The Networks > Networks and Sites > Networks page provides a detailed, hierarchical view of your network's IP addressing scheme, including subnets and CIDR blocks.
How IoT Security Learns Network Information:
- Manual Configuration: Adding subnets/CIDR blocks directly, including specifying static IP subnets.
- DHCP Traffic Analysis: Observing DHCP client-server exchanges.
- SNMP Discovery: Querying network switches via SNMP integration.
- IPAM Integration: Syncing with BlueCat or Infoblox IPAM systems.
Network Page Overview:
The page features:
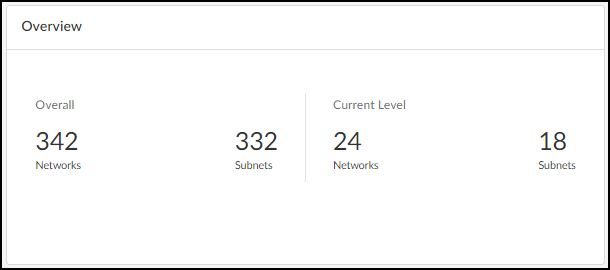
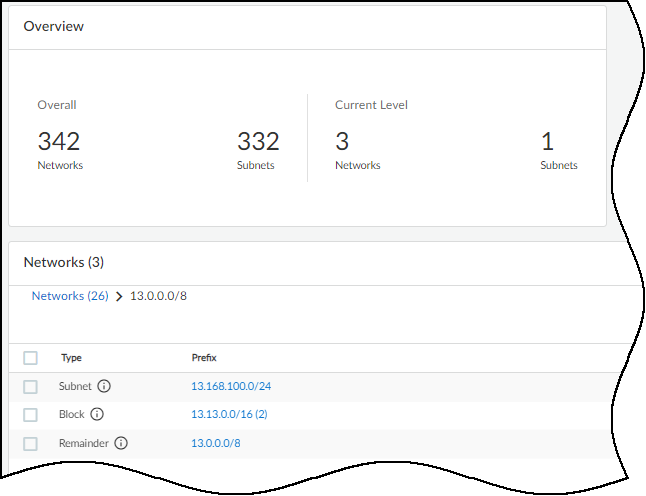
- Overview Panel: Shows the total count of network elements (blocks, subnets, remainders) and the count at the currently viewed hierarchical level.
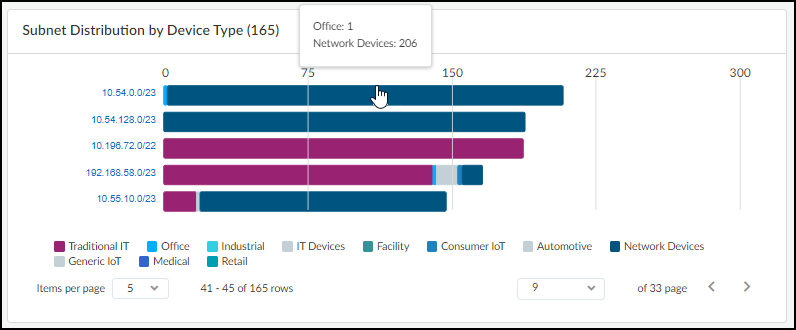
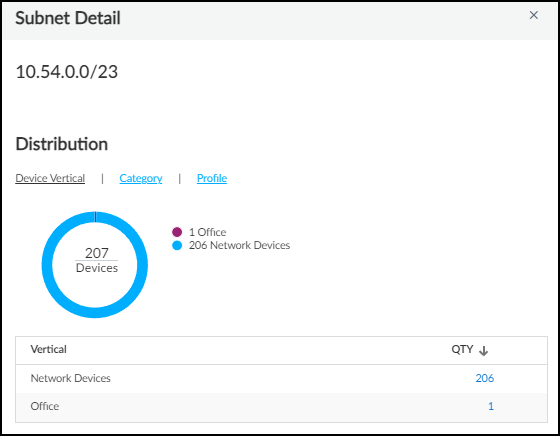
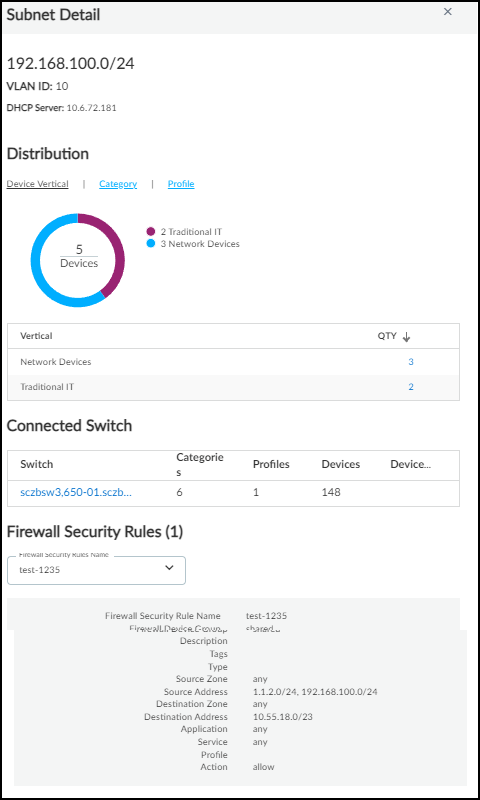
- Subnet Distribution Chart: A bar chart showing the distribution of device types across different subnets. Hovering over bars reveals device type counts per subnet. Clicking a subnet opens the Subnet Detail panel.
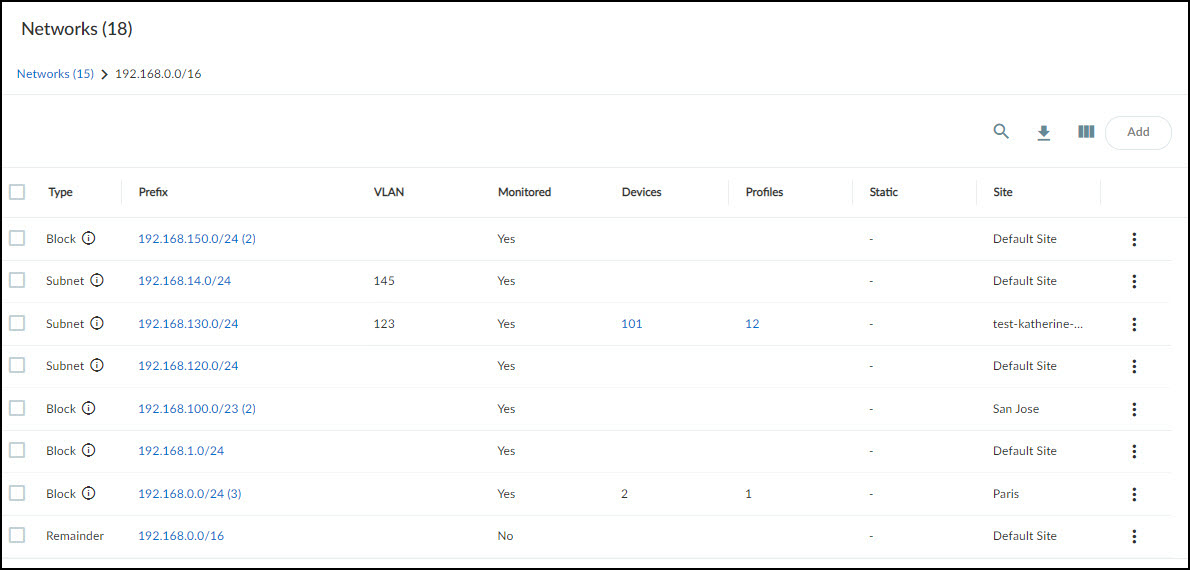
- Networks Table: A hierarchical list of IP blocks and subnets with detailed attributes. Clicking a block prefix drills down into its contents.
- External Connections Map: A world map showing connections from internal devices to external destinations, color-coded for safety (green) or maliciousness (red).
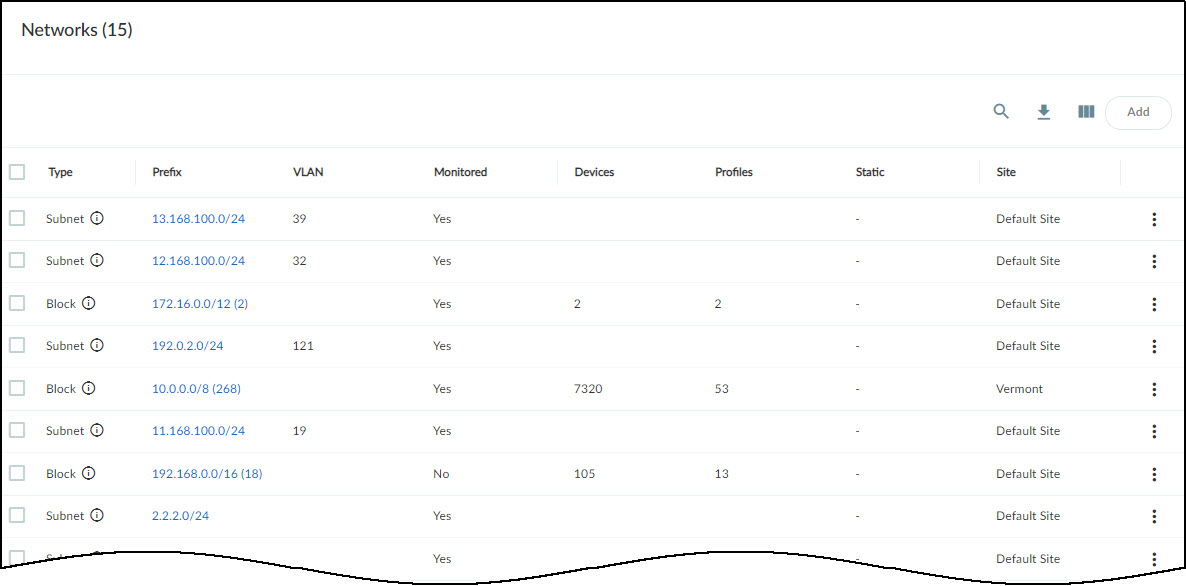
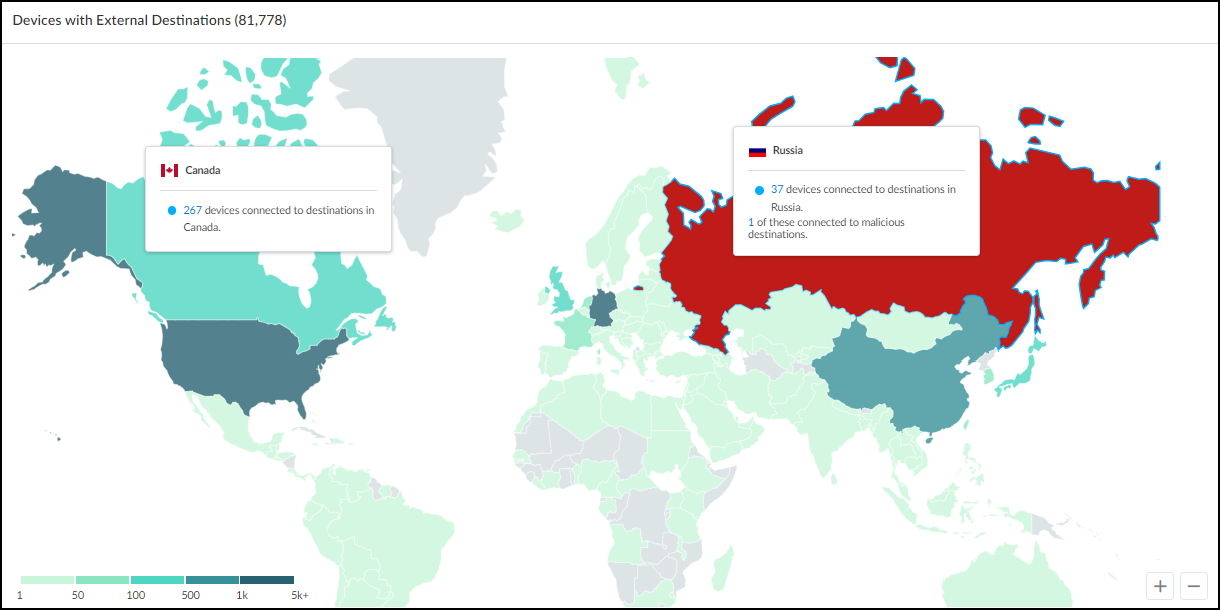
Networks Table Columns Explained:
- Type: Subnet, IP Block, Shared IP Block (reused IPs across segments) , Non-shared IP Block (unique IPs), Remainder (unassigned IPs within a block), Network Segment (logical grouping for overlapping IPs).
- Name, VLAN, Description: Identifying information, often learned via manual input or integrations (IPAM, SNMP).
- Monitored: Yes/No indicates if IoT Security actively monitors devices in this network element.
- Categories/Profiles: Count of distinct device categories/profiles within a subnet.
- Source: How the element was added (Discovered, Config, Preconfig, BlueCat IPAM, Infoblox IPAM, Network Discovery SNMP).
- IP Endpoints: Count of devices where only the IP is known (no MAC, unstable behavior). Clicking downloads a report.
- DHCP/Gateway: Addresses learned via SNMP or IPAM integration.
- Prefix: The CIDR notation (e.g., 192.168.1.0/24). Clicking opens details or drills down.
- Devices: Count of discovered devices.
- Static: 'Yes' if the subnet is configured to contain only static IPs.
- Firewall Security Rules: Count of Panorama rules referencing this subnet ( requires XSOAR integration ).
- Low-confidence Devices: Count of devices with identity confidence below 70%.
- Site Mapping: Yes/No indicates if mapping was manual or inherited.
- Site: Assigned site name.
- Devices Discovered via Integration: Count of devices learned from third-party systems.
- Removable: Indicates if the element can be deleted.
Network Segments Configuration
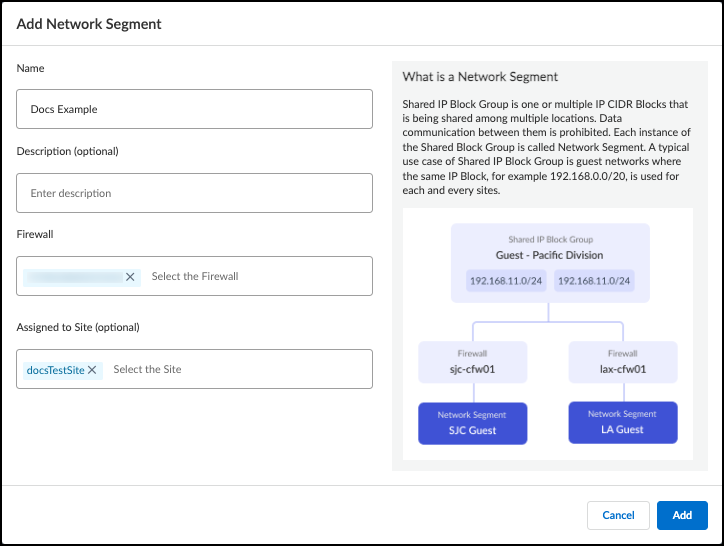
Network segments are crucial for accurately identifying devices when IP addresses overlap across different parts of your network (e.g., multiple sites using the same guest network subnet 192.168.100.0/24). Important: This feature requires using IP Address-based site assignment.
Navigate to Networks > Networks and Sites > Network Segments Configuration to manage segments. Remark: Only users with owner or administrator privileges can perform these actions.
Understanding Network Segments:
- A Network Segment logically groups one or more firewalls, typically those monitoring a specific network area where IP overlap occurs.
- Each firewall can belong to only ONE network segment.
- Each network segment can be assigned to only ONE site.
- When IoT Security receives logs, it uses the combination of the *Shared IP Block* the device belongs to AND the *Network Segment* (identified by the reporting firewall) to uniquely identify the device, even if another device elsewhere uses the same IP address.
Creating and Managing Network Segments:
- Go to Networks > Networks and Sites > Network Segments Configuration .
- Click Add .
- Enter a Name and optional Description .
- Assign one or more Firewalls to this segment. If a selected firewall is already in another segment, it will be moved.
- (Optional) Assign the segment to a specific Site . If left blank, it defaults to the "Default" site.
- Click Add to save.
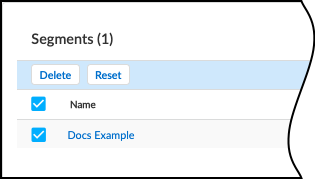
Resetting or Deleting Network Segments:
- Resetting: Important: If you change the firewalls or site assignment of a segment, you *must* reset it. Select the segment(s) and click Reset . This clears associated device data, forcing IoT Security to relearn devices within the updated segment context.
- Deleting: If a segment is no longer needed, select it and click Delete . This also removes associated device data from the inventory.
Discover IoT Devices and Take Inventory
IoT devices are typically purpose-built, exhibiting predictable network behaviors. IoT Security leverages this by analyzing traffic patterns to identify and profile these devices.
Device Discovery and Profiling Process:
- Palo Alto Networks Firewalls log network traffic (session logs, enhanced application logs).
- Logs are sent to the logging service.
- IoT Security accesses log data.
- Advanced machine learning algorithms analyze network behaviors.
- A baseline behavior profile is established for each device.
- The baseline is compared with known device behaviors.
- IoT Security determines the device's unique "personality" (type, category, vendor, model, OS, etc.).
- A detailed profile and acceptable communication patterns are built and continuously updated .
The time required for initial profiling depends on:
- Device Activity: More traffic leads to faster profiling.
- Number of Similar Devices: More devices of the same type allow for aggregated learning.
- Behavioral Complexity: Simpler devices (like thermostats) are profiled faster than complex ones (like surgical robots).
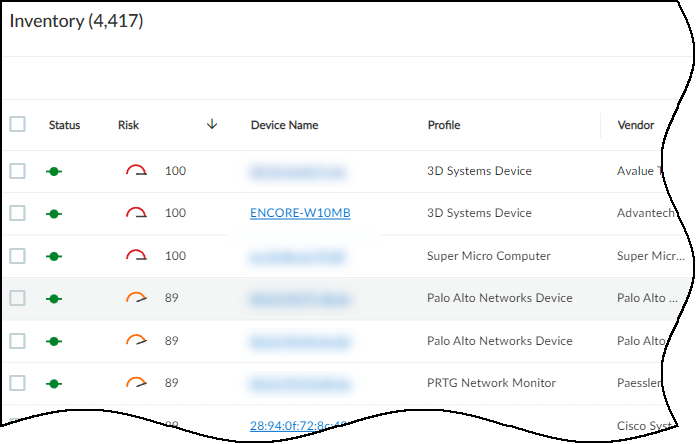
Discovered and identified devices appear on the Assets > Devices page.
IoT Security Devices Page
The Assets > Devices page serves as the central inventory for all discovered and monitored devices and their associated profiles.
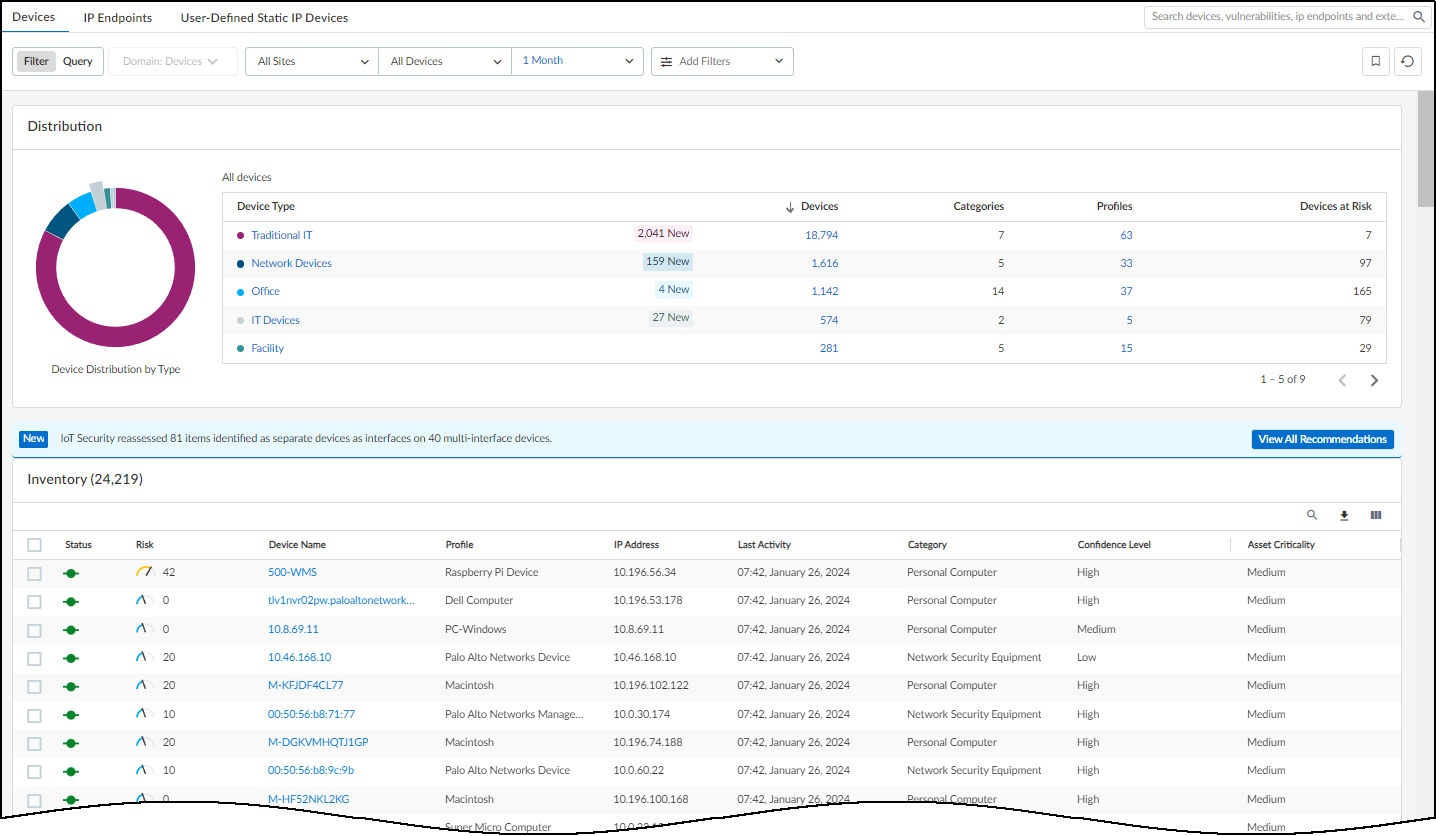
Key features include:
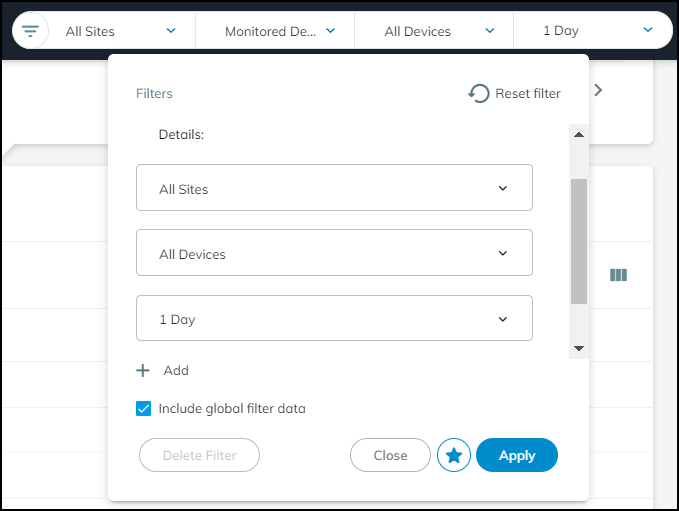
- Global Filters: Filter by Site, Monitoring Status (Monitored/Discovered), Device Type, and Time Period. These filters persist across the Dashboard and Devices pages.
-
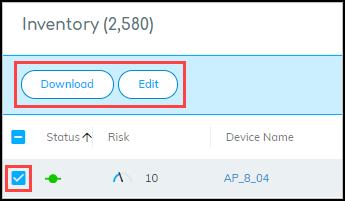
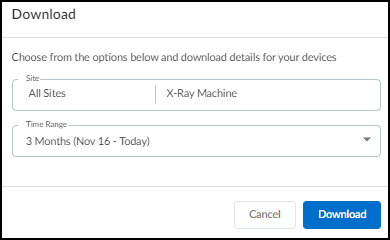
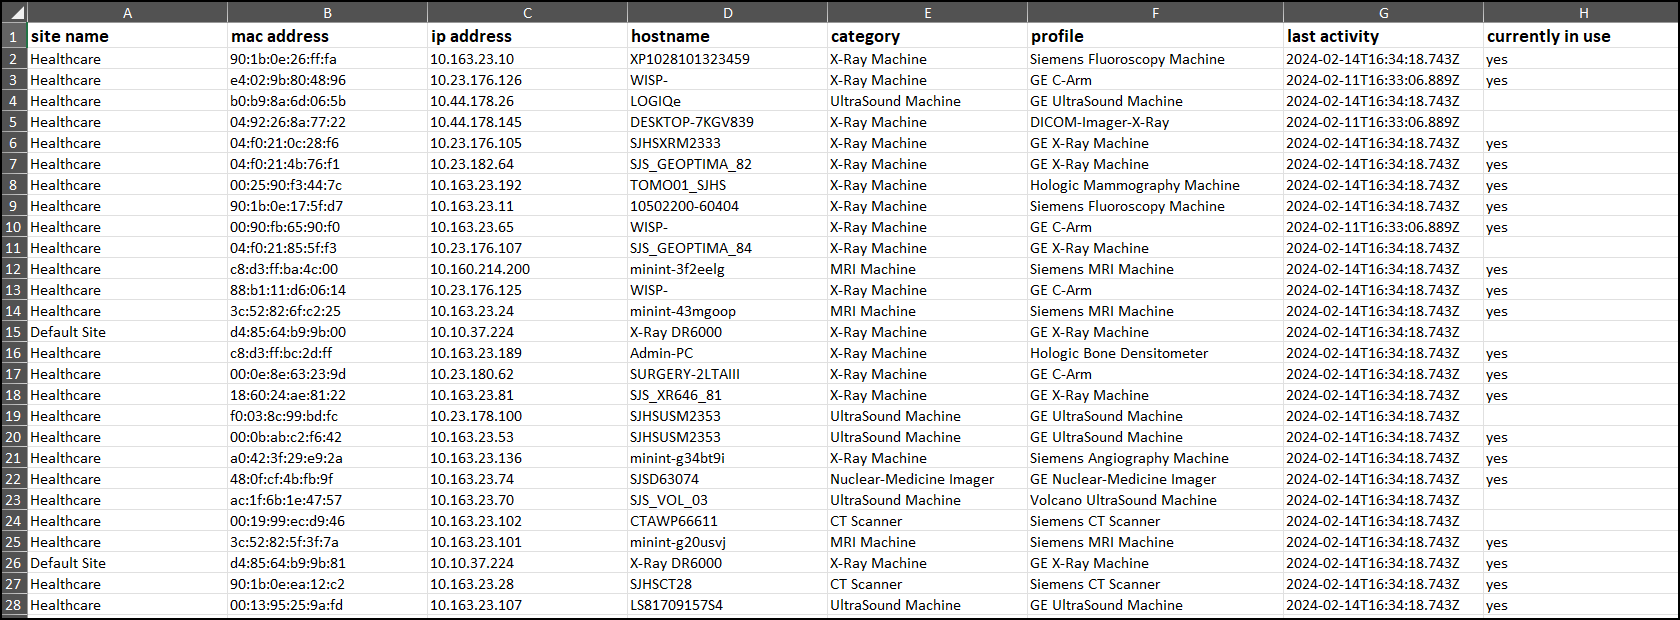
Download Options:
- Download: Exports the currently filtered inventory view as a CSV, including all available data columns (visible or hidden).
- Create report: Configure scheduled reports (Summary, Risk, New Device, Filtered Inventory).
- Download change log: Generates a CSV comparing inventory changes between two selected dates.
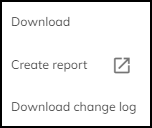
Download options available on the Devices page. - Search: Find devices by full or partial name match.
-
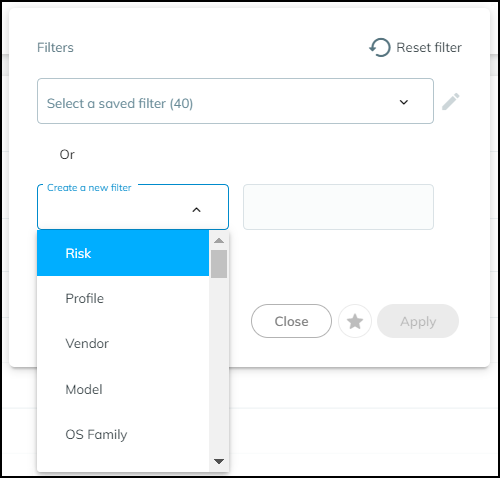
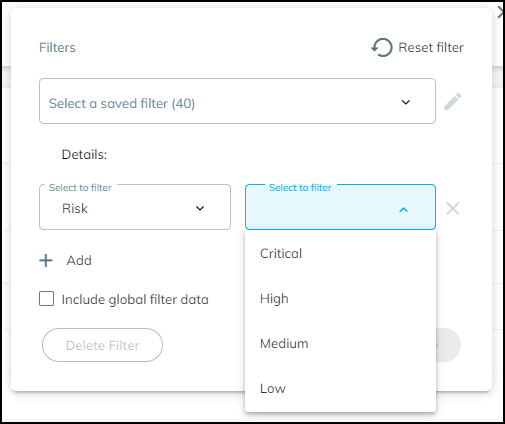
Custom Filters:
Create and save complex filters based on various device characteristics using the Filter icon (
 ). You can include or exclude global filters within custom filters.
-
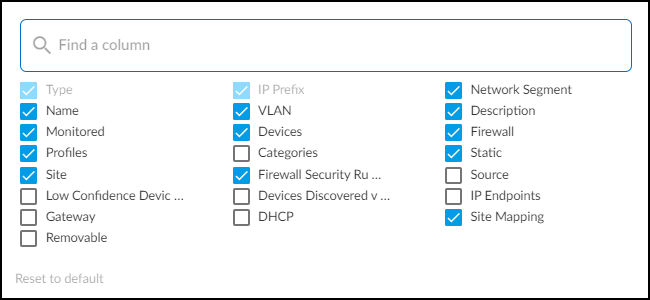
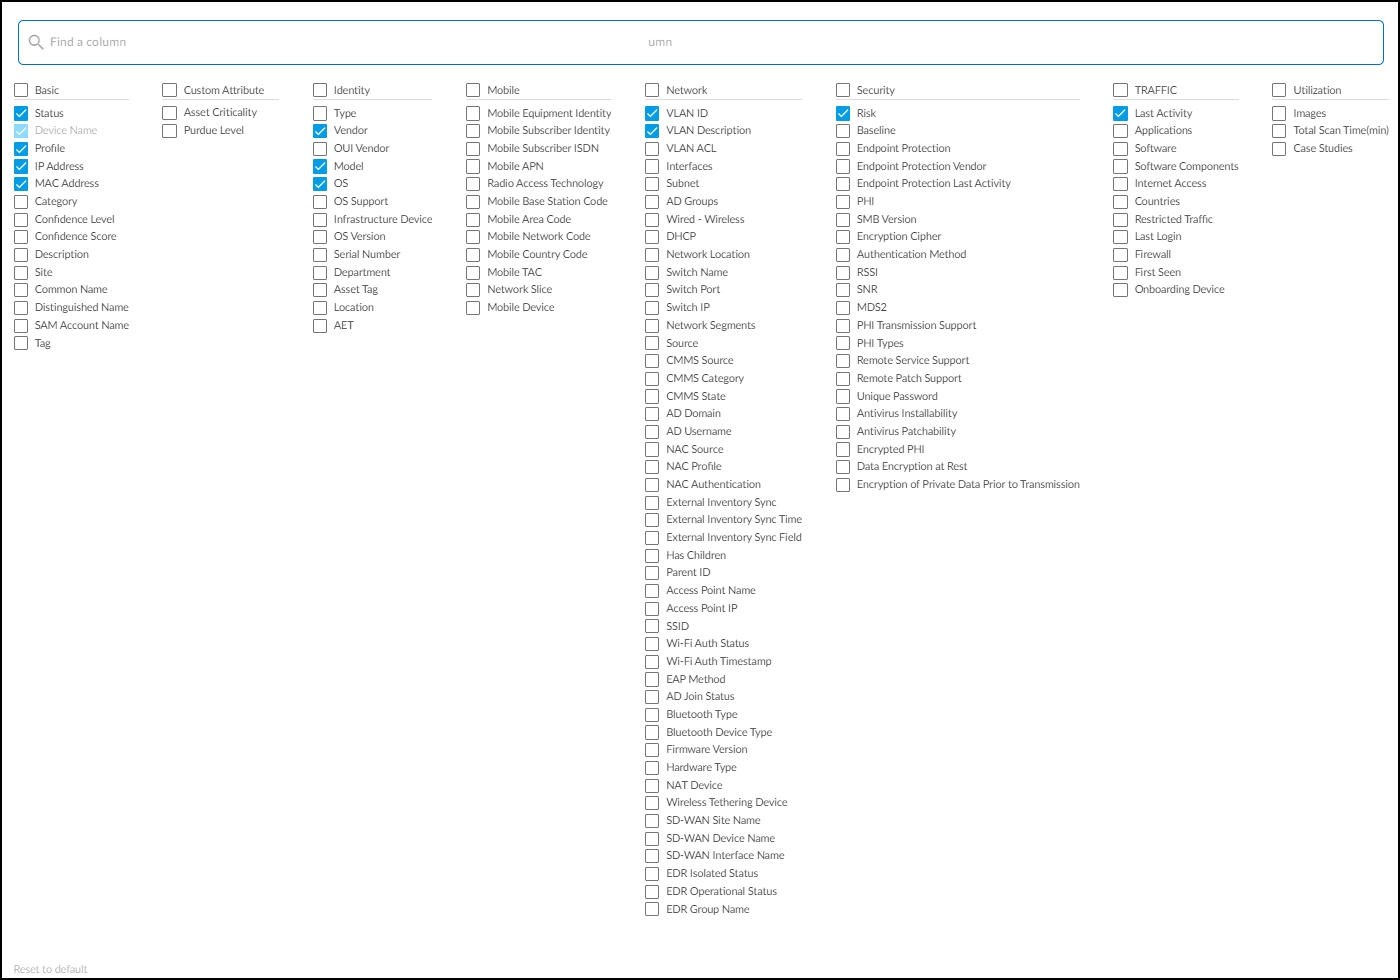
Column Customization:
Rearrange columns by dragging headers. Show/hide columns using the Columns icon (
 ). Reset to default view if needed.
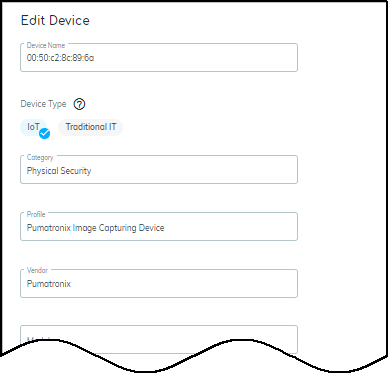
- Bulk Edit: Select multiple devices, click Edit , and modify common attributes like Type (IoT/IT), Category, Profile, Vendor, Model, OS, Tags, Description, etc.
- Manual Edits & Learning: Watch Out! Manually edited attributes are considered definitive and won't be overwritten by automatic profiling for that field. These manual inputs are fed back into the machine learning models, potentially improving future identifications for all users if validated.
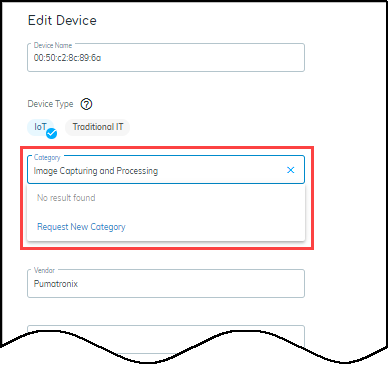
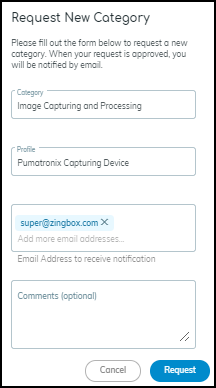
- Request New Category: If an entered category doesn't exist, you can request its creation. If validated, it becomes available globally.
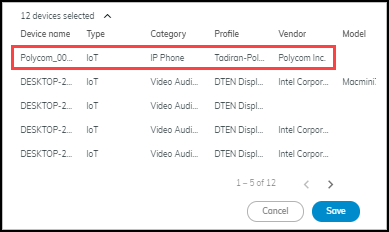
- Multi-Device Edit View: When editing multiple devices, a table at the bottom shows current values for selected devices for easy verification.
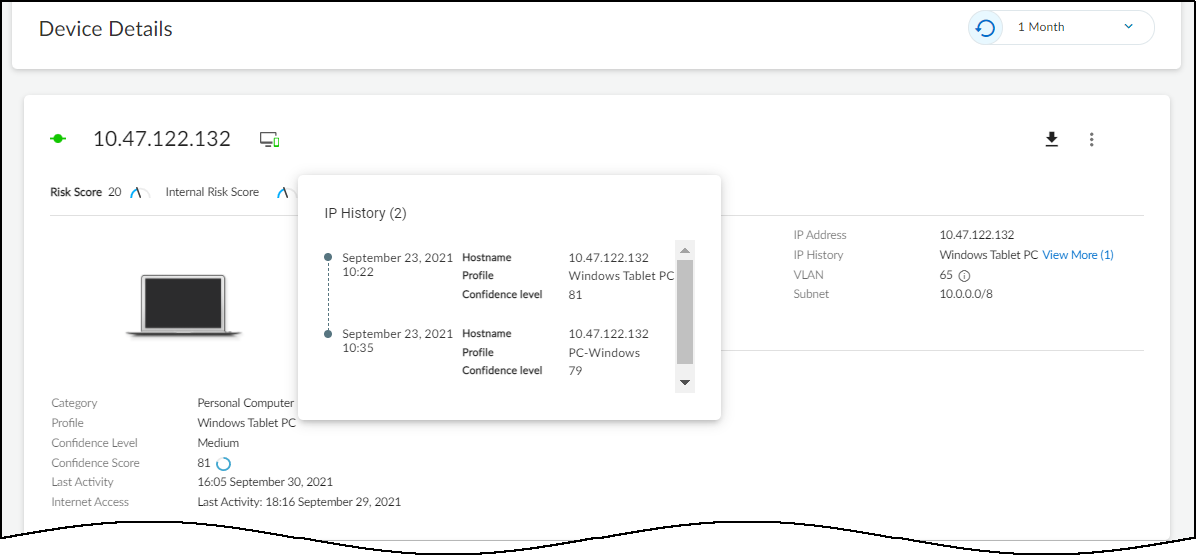
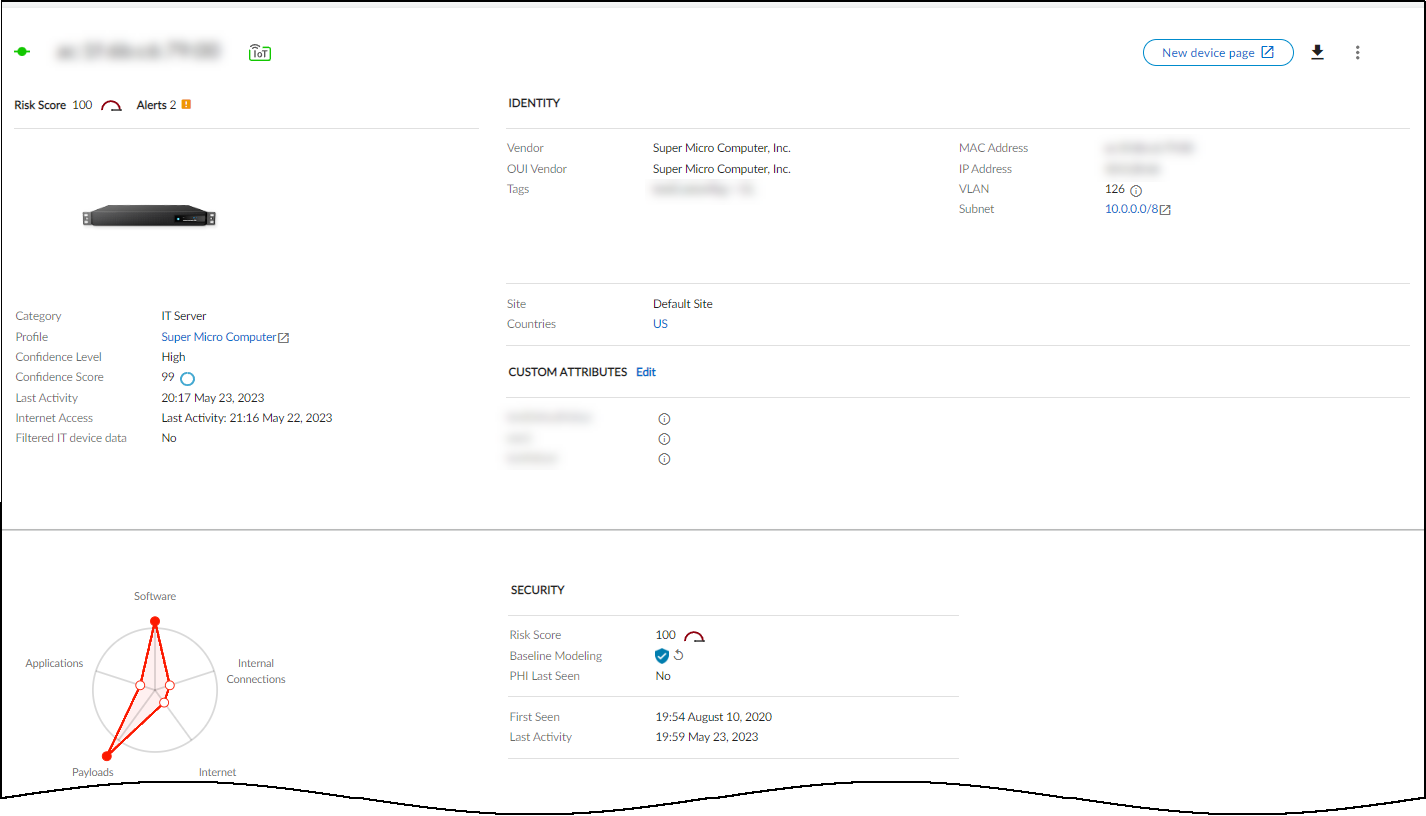
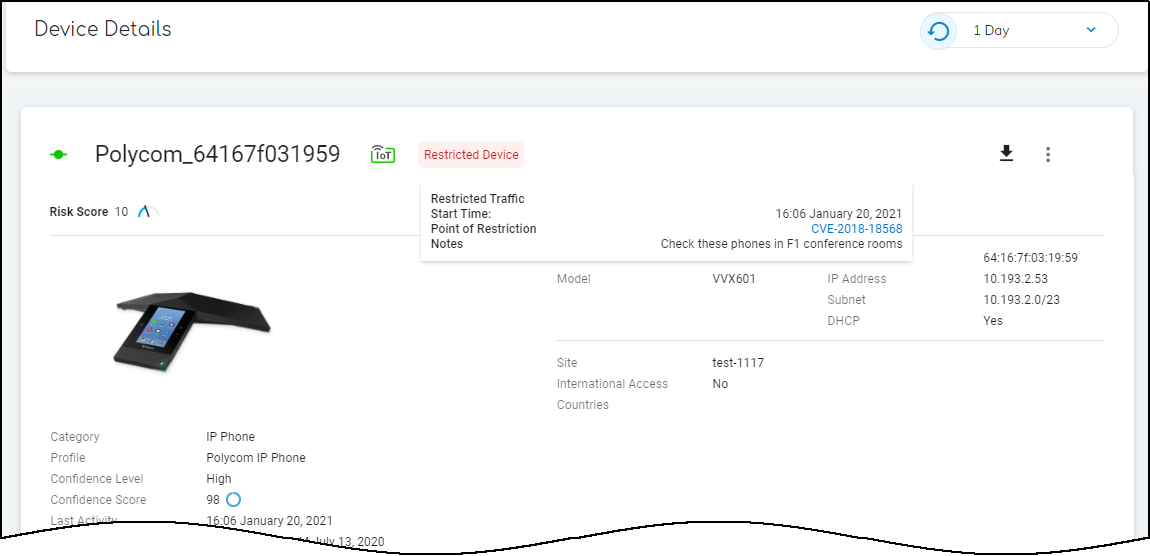
IoT Security Device Details Page
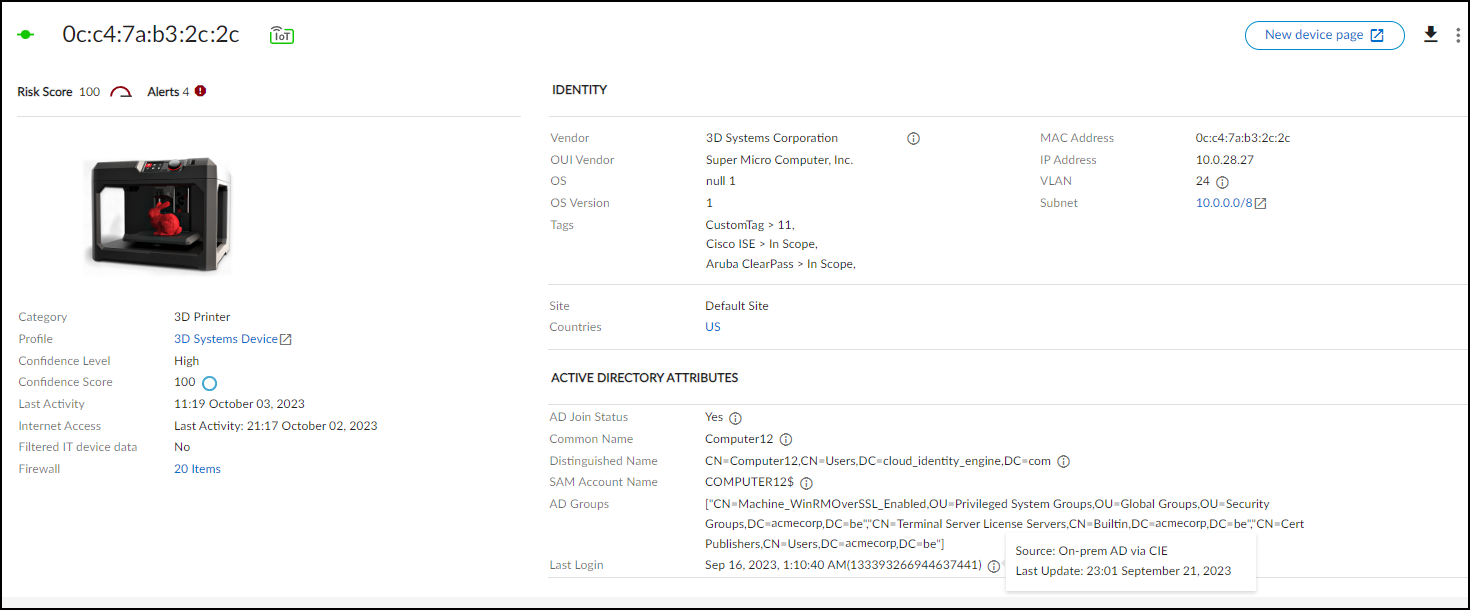
Clicking a device name in the inventory table opens its dedicated Device Details page, providing in-depth information grouped into several sections.
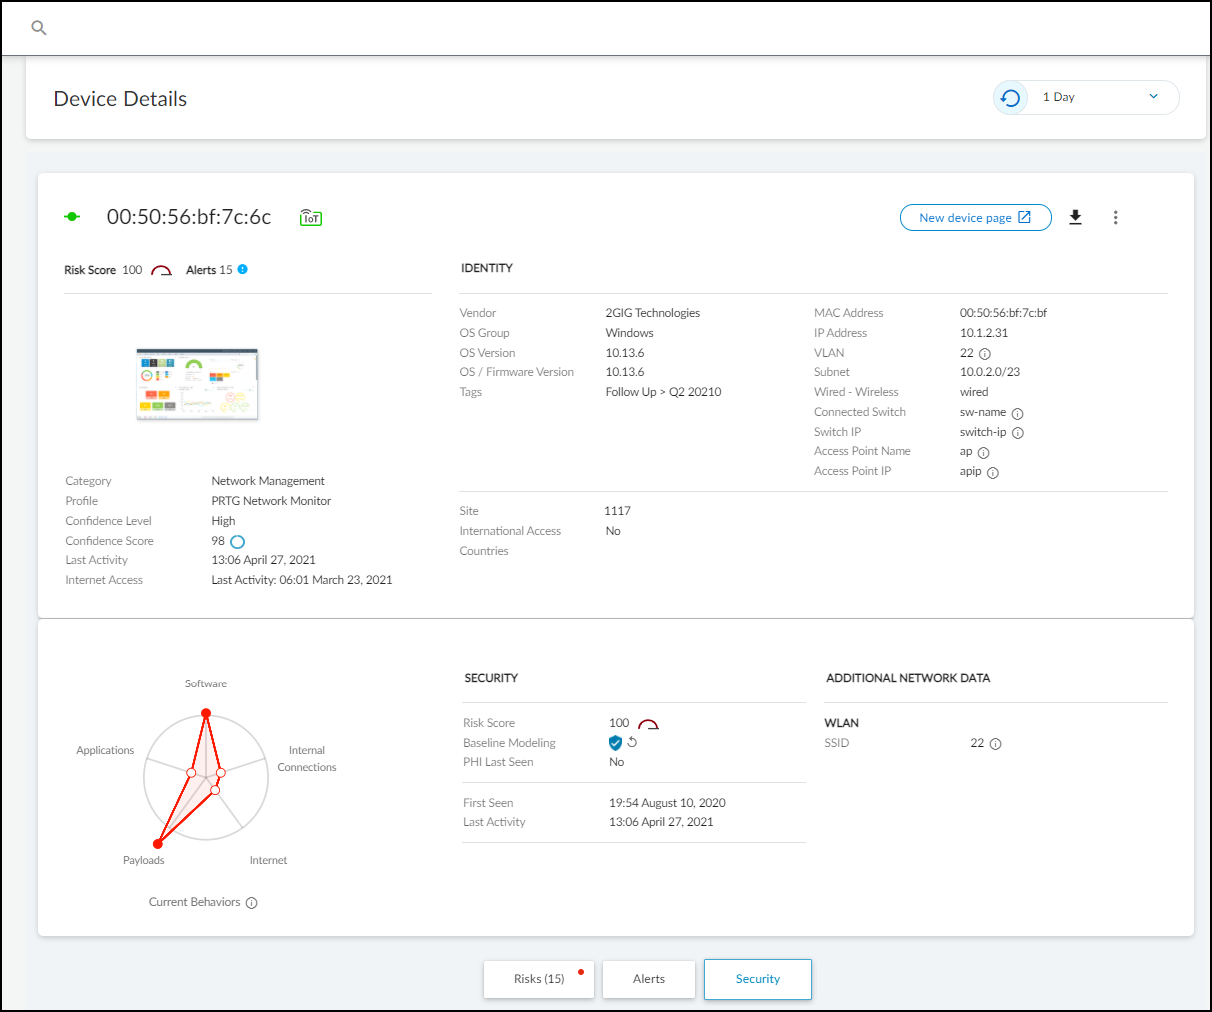
Key Sections:
- Identity: Basic identifying data (Category, Profile, Vendor, Model, OS, IP/MAC address, VLAN, Site, etc.). Only fields with known values are displayed.
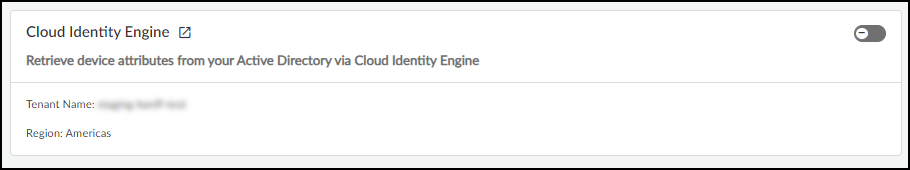
- Active Directory Attributes (Conditional): Appears if Cloud Identity Engine (CIE) integration is enabled and the device is found in AD. Shows attributes like AD Domain, Common Name, OS details, Groups, Last Logon, etc. Requires owner privileges to enable integration under Integrations > Cloud Identity Engine Integration . Source is marked as "On-prem AD via CIE". Remark: For certain core attributes (Model, Vendor, OS, Firmware, Serial Number, etc.), values learned via network traffic take precedence over values learned via integration.
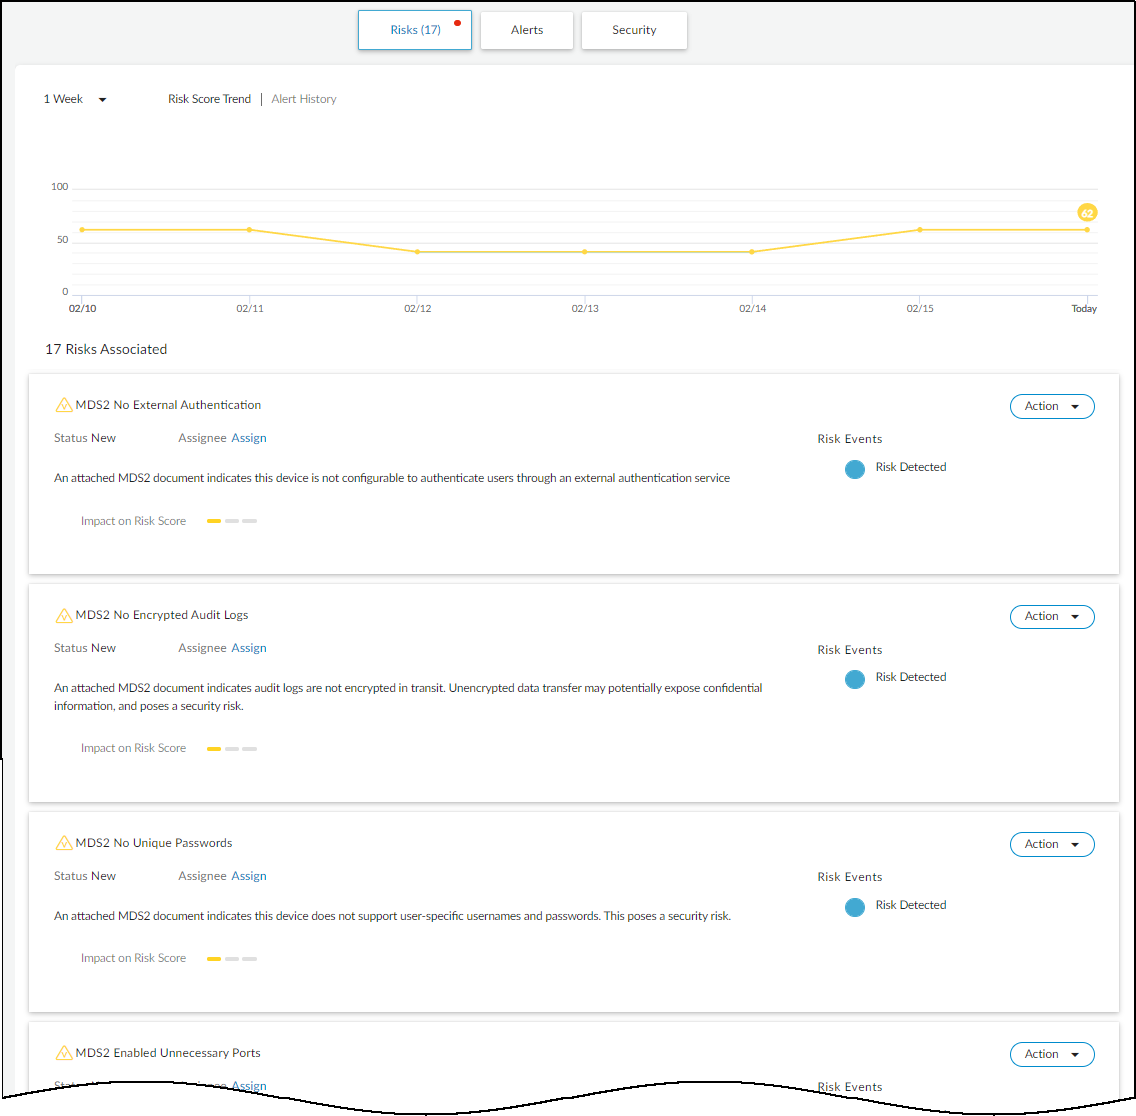
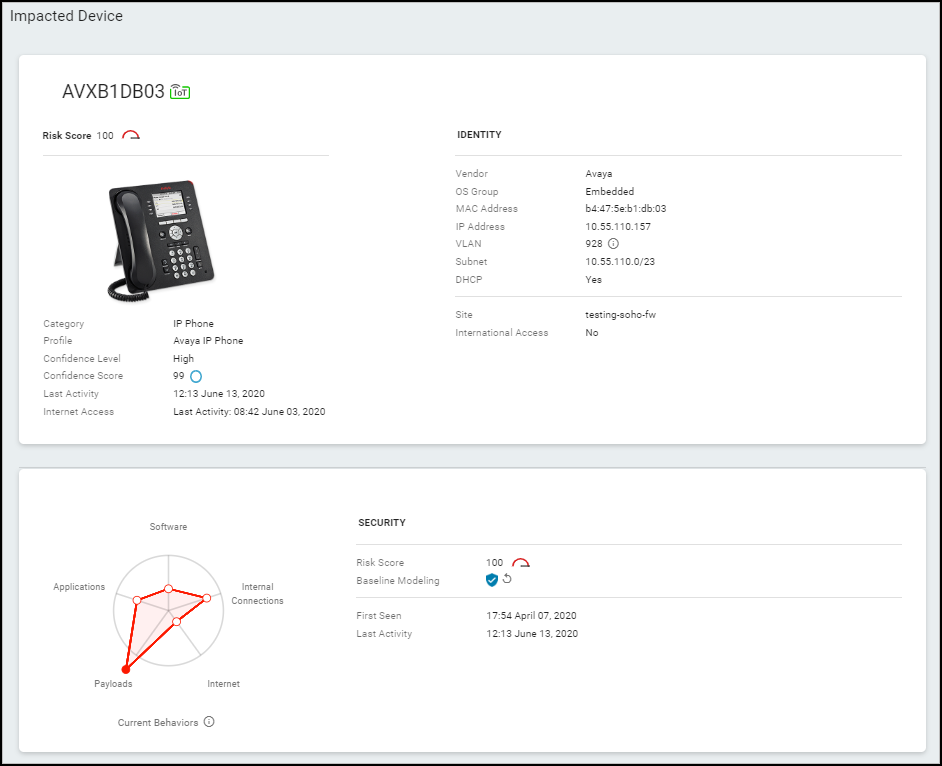
- Security (Summary): Device risk score, baseline modeling status (complete/in progress), and a behavior diagram showing deviation from normal behavior. For medical devices with an uploaded MDS2 file, it also shows security capabilities learned from the file (PHI handling, patching support, antivirus, etc.).
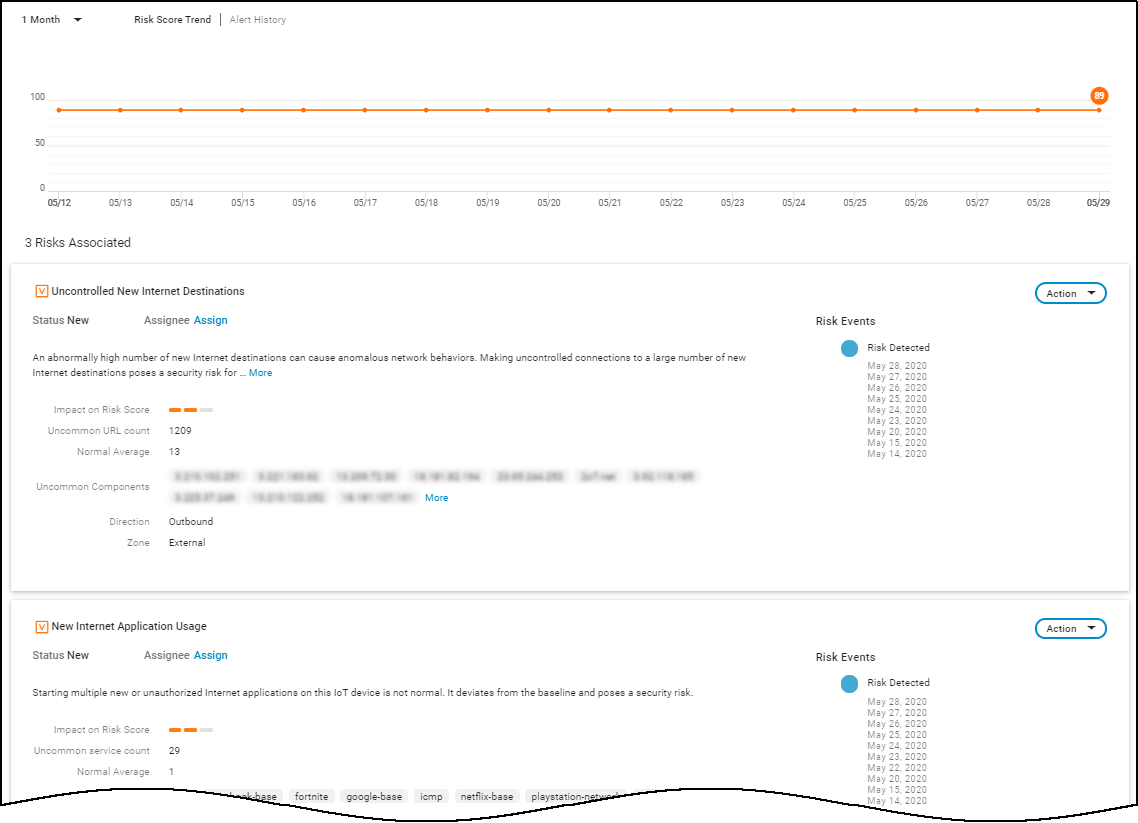
- Risks: Timeline and list of alerts, vulnerabilities, and anomalies detected for the device within the selected time frame. Provides "More Insights" with remediation recommendations where available. MDS2-derived risks are also listed here for medical devices.
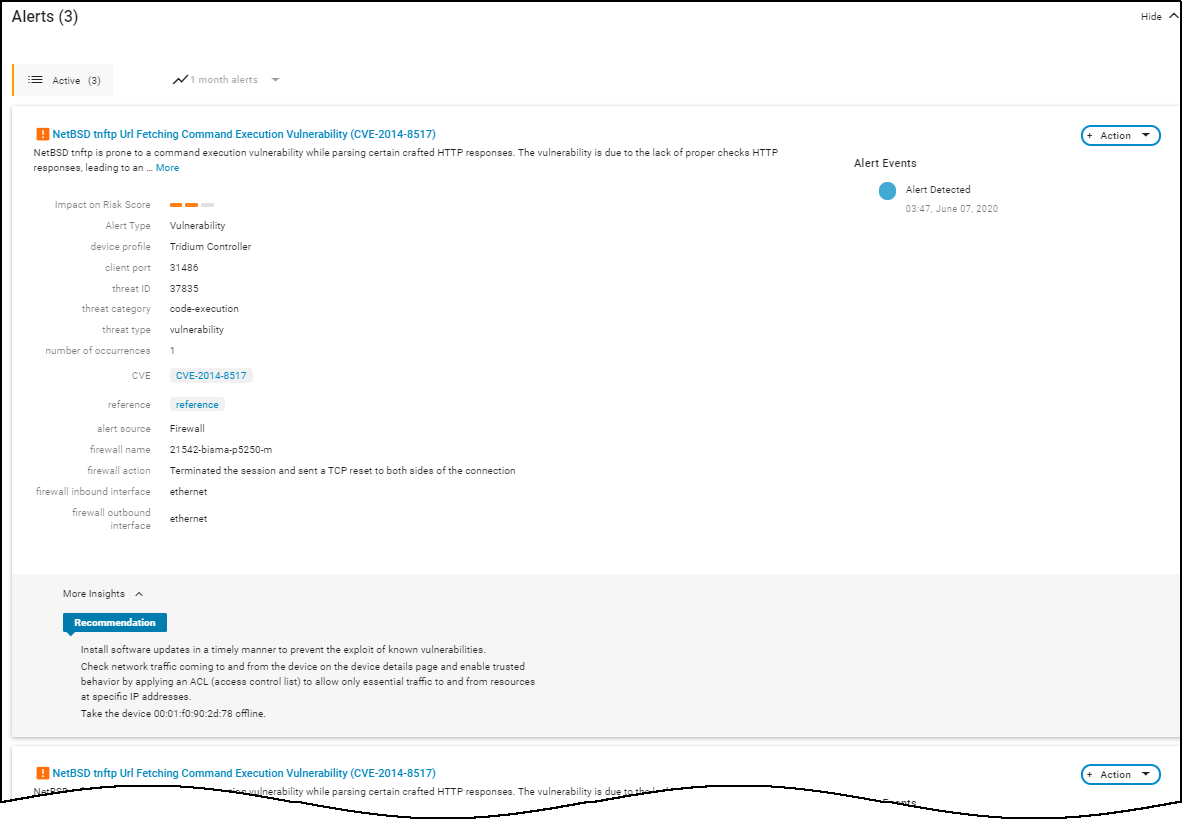
- Alerts: A filtered view showing only the alerts raised by this device.
-
Security (Details):
- Network Traffic: A topology map showing connections between this device and others. Filters allow viewing by direction, alert level, location (VLAN, intranet, internet). Clicking "Explore Topology" opens an interactive viewer.
- Applications: Lists applications used by the device, their risk level (1-5), and usage count by other devices/profiles.
- Software Components: Details software components (libraries, modules) identified on the device, often derived from Software Bills of Materials (SBOMs) information extracted from network traffic (e.g., HTTP headers). Lists component name, version, and related CVEs. Allows downloading SBOM data in SPDX format.
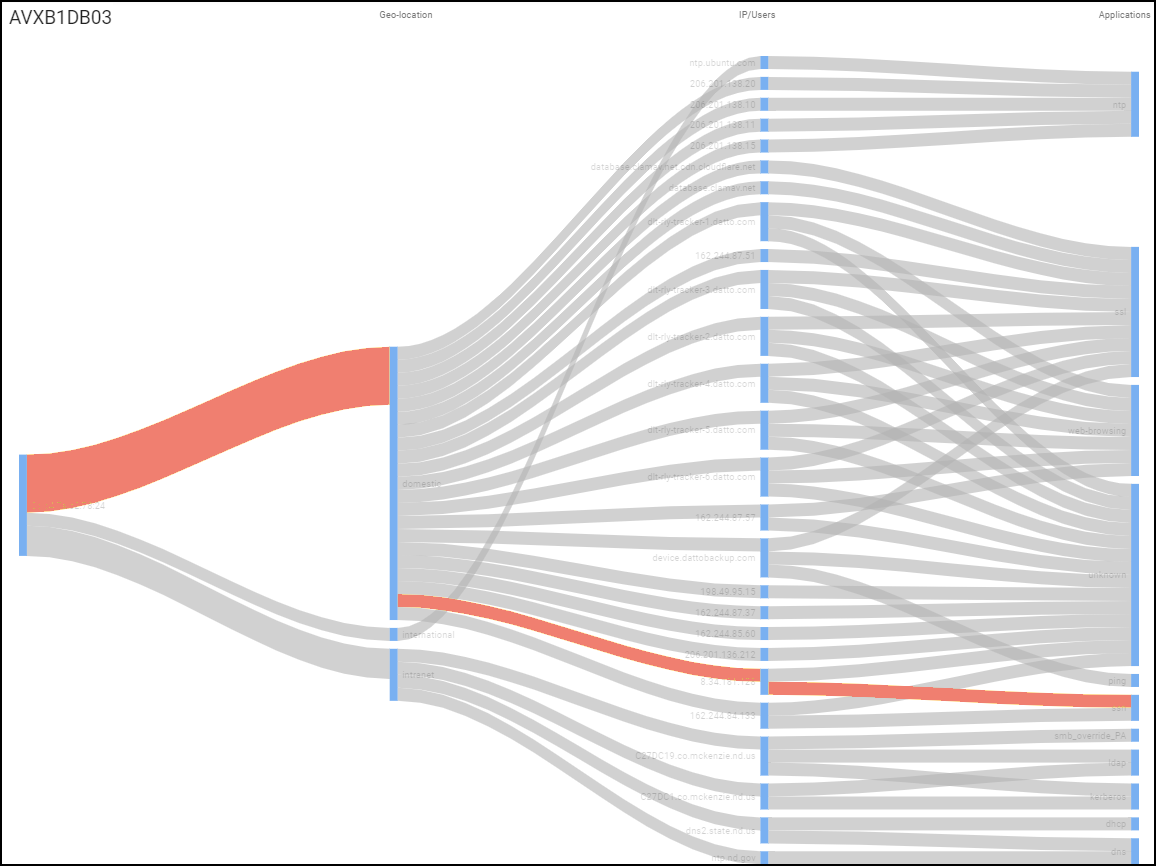
- Network Usage: A Sankey diagram visualizing connections, applications, and destinations. Red lines indicate connections involved in high-severity alerts. Allows initiating policy creation based on observed flows.
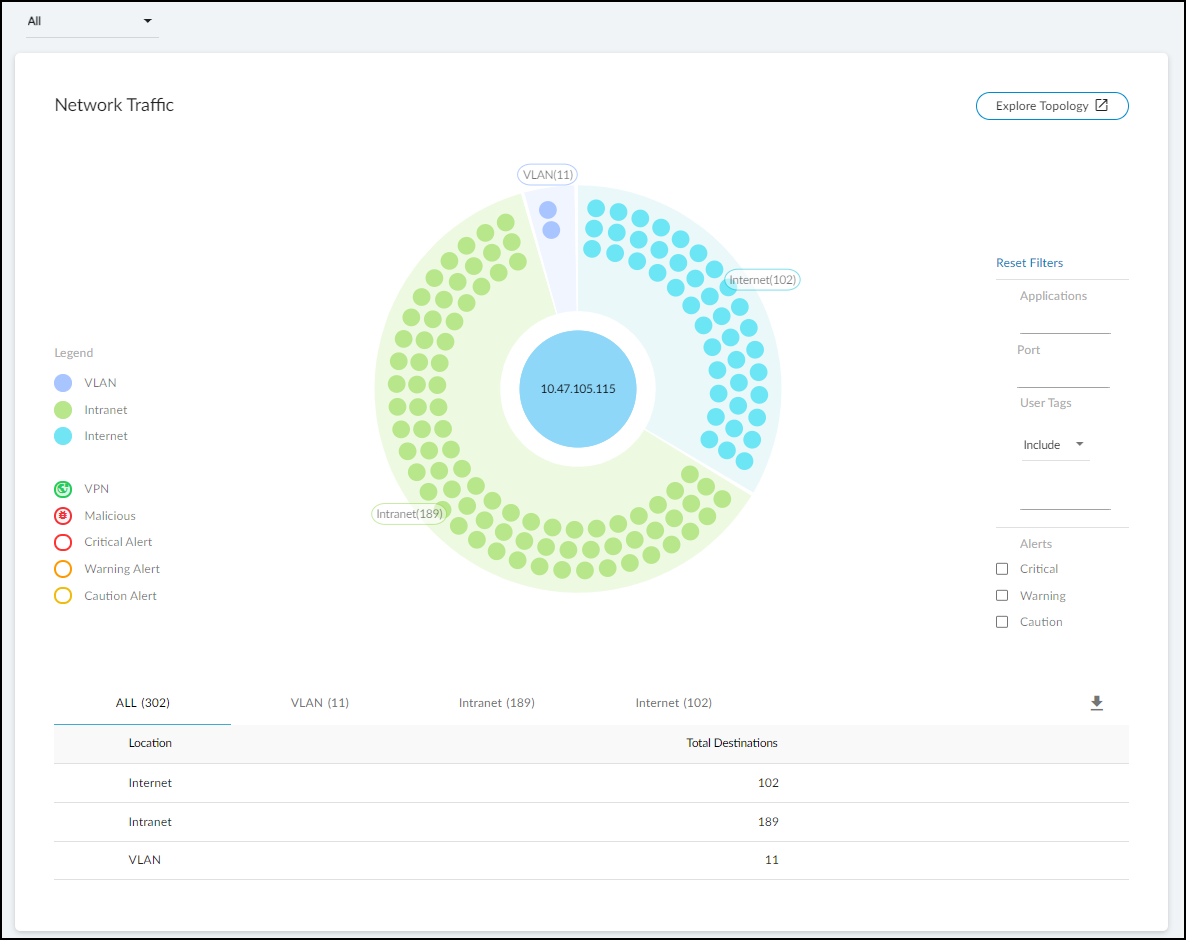
Network Traffic visualization. 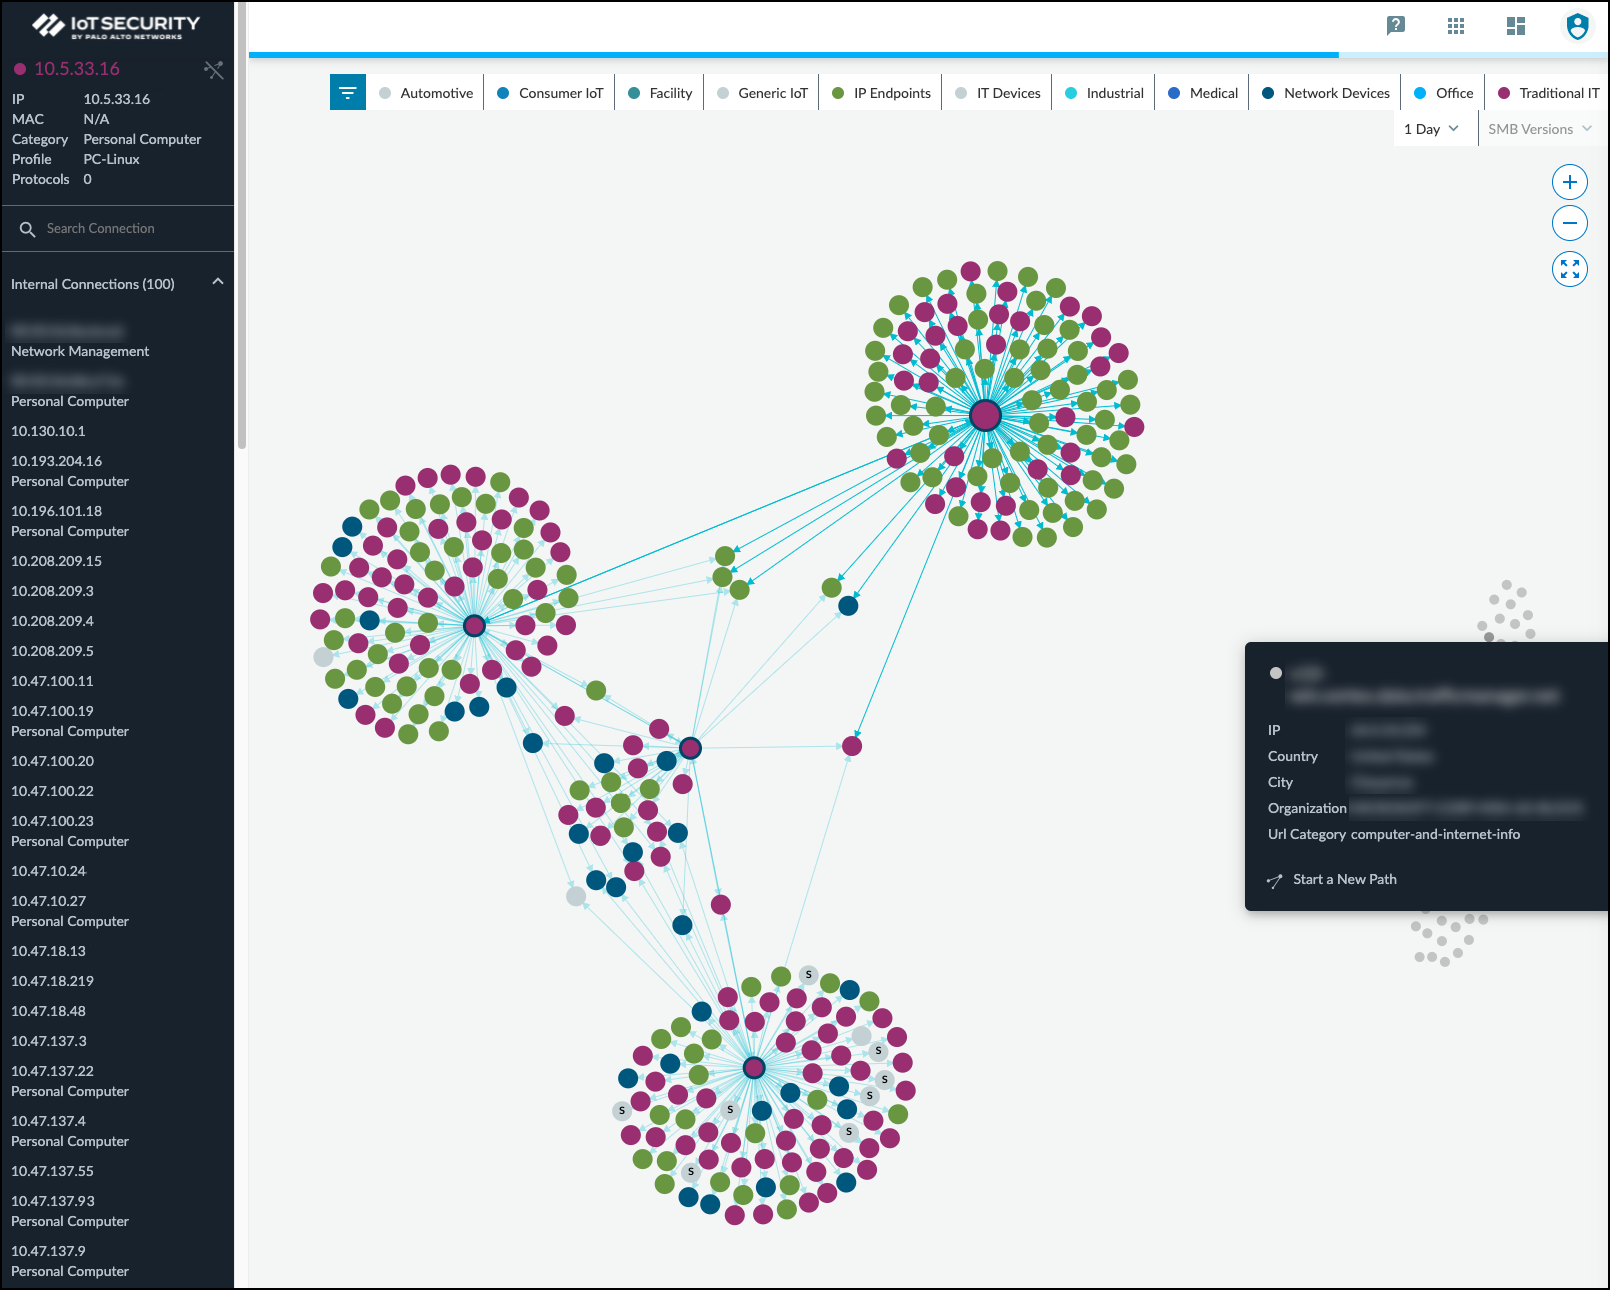
Interactive Topology Explorer view. 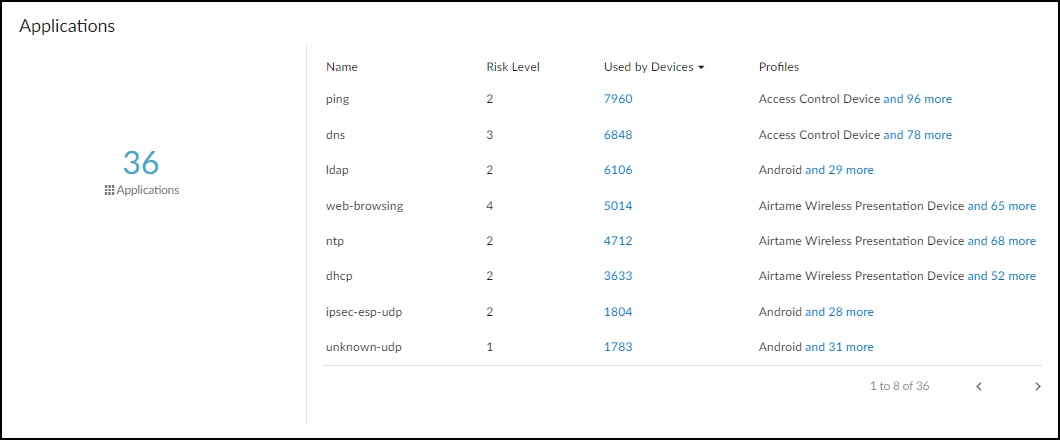
Applications used by the device. 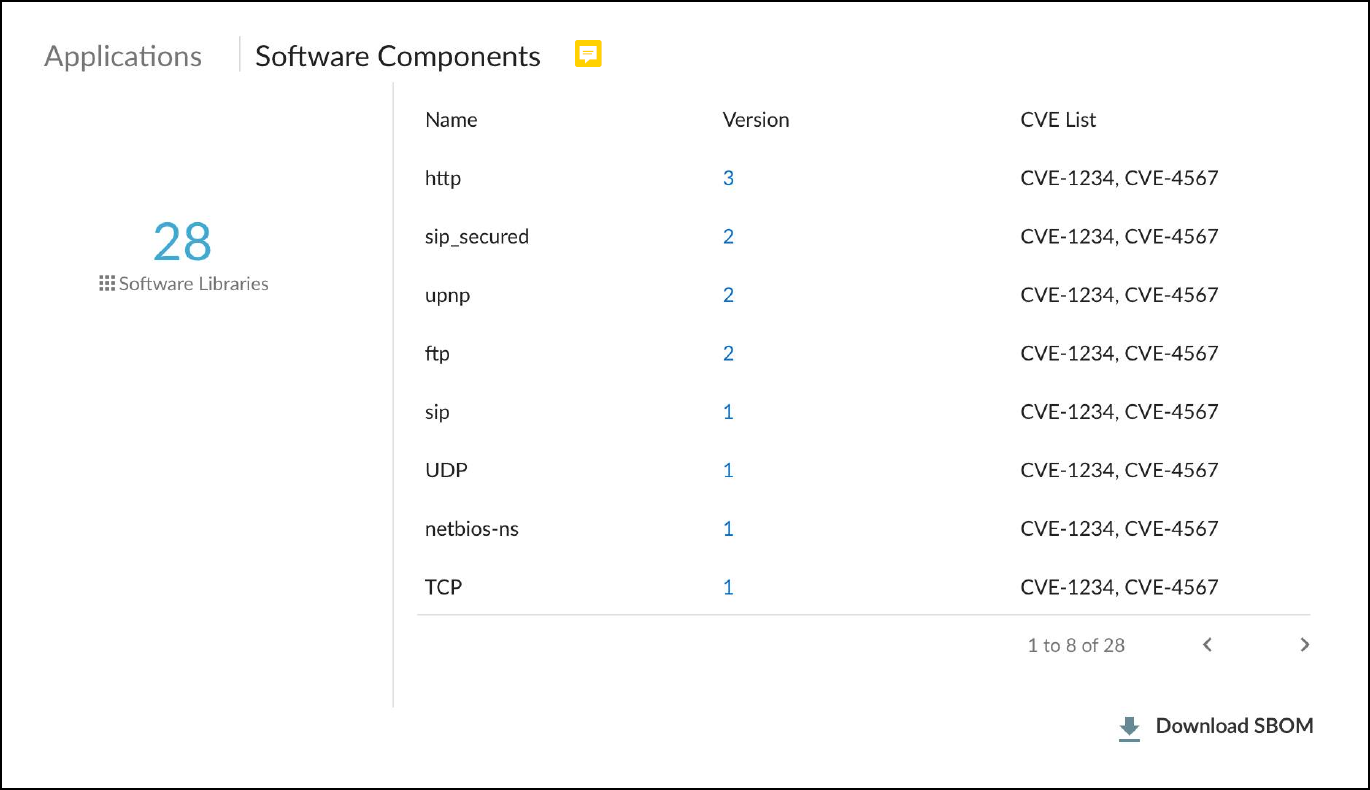
Software Components (SBOM) details. 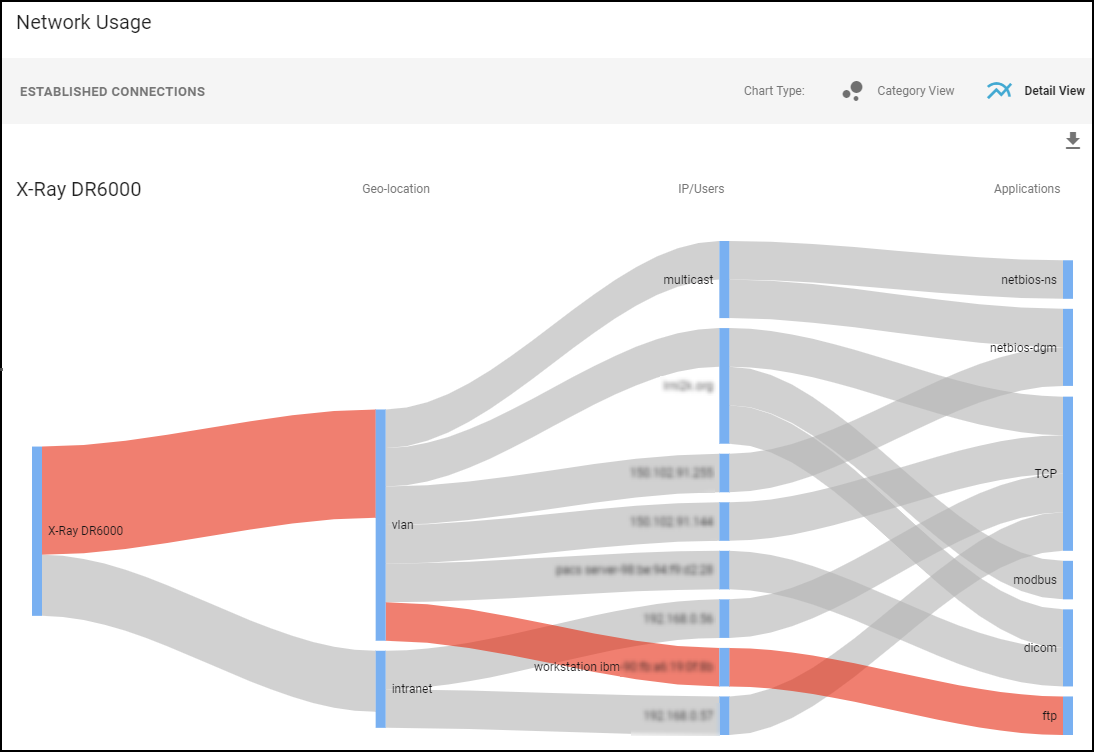
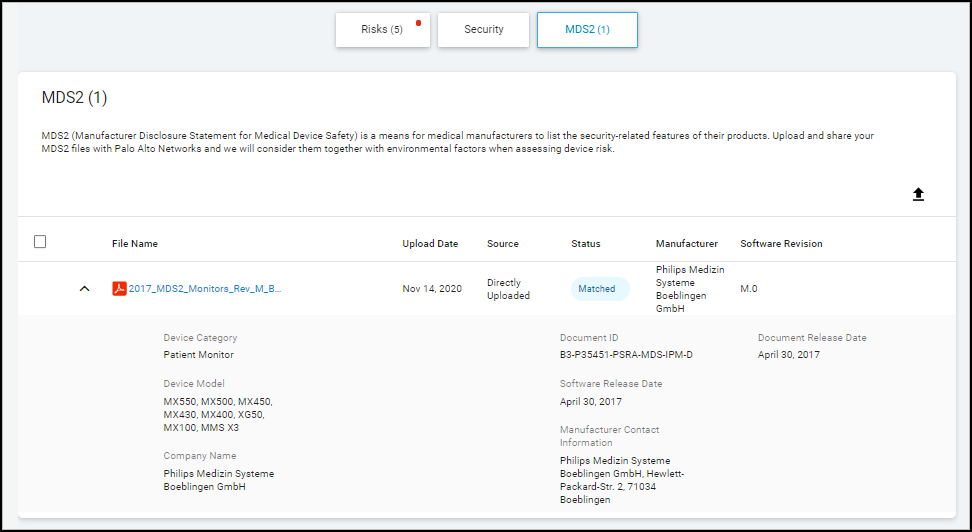
Network Usage visualization (Sankey diagram). - MDS2 (Medical IoT Only): Displays information extracted from uploaded Manufacturer Disclosure Statement for Medical Device Safety (MDS2) PDF files. Includes device capabilities, security features (PHI handling, encryption, patching), and allows uploading/managing MDS2 files for the device or profile. IoT Security uses MDS2 data to refine risk assessments.
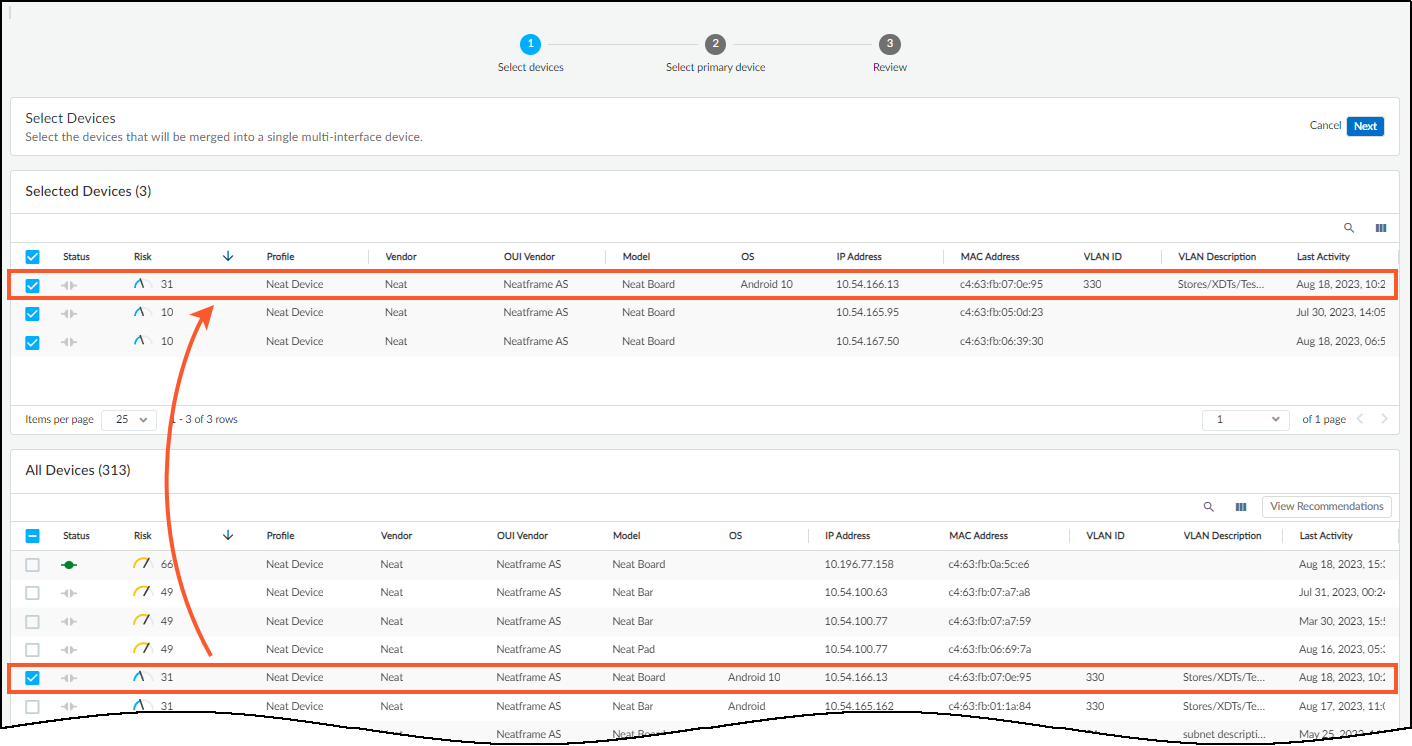
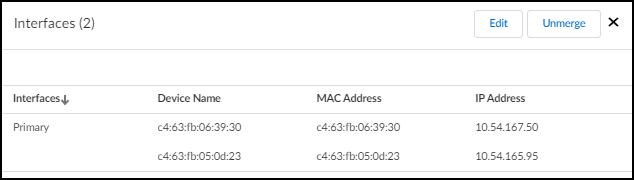
Create Multi-interface Devices
Some devices, like L3 switches, firewalls, or printers with both wired and wireless connections, have multiple network interfaces, each with its own MAC and IP address. Initially, IoT Security might detect each interface as a separate device.
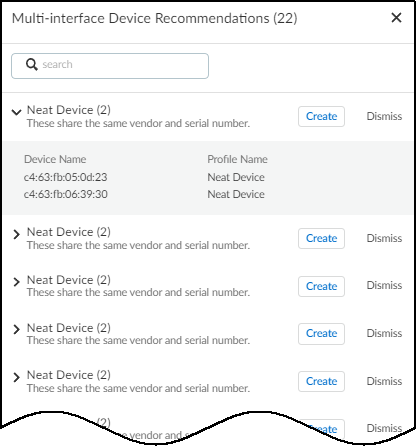
When IoT Security detects potential duplicates based on shared attributes (like hostname or serial number), it recommends merging these "devices" into a single multi-interface device representation. This process involves:
- Identifying one interface as the primary .
- Assigning the others as secondary interfaces.
The merged multi-interface device inherits device-level attributes (like Profile, OS, Vendor, Model, Risk Score) from the chosen primary interface, while each interface retains its unique network-level attributes (IP, MAC, Subnet, VLAN).
Merging Process:
- View Recommendations: On the Assets > Devices page, click "View All Recommendations" if a notification appears.
- Initiate Merge: Click "Create" on a recommendation or manually select devices from the inventory and initiate a merge (if available).
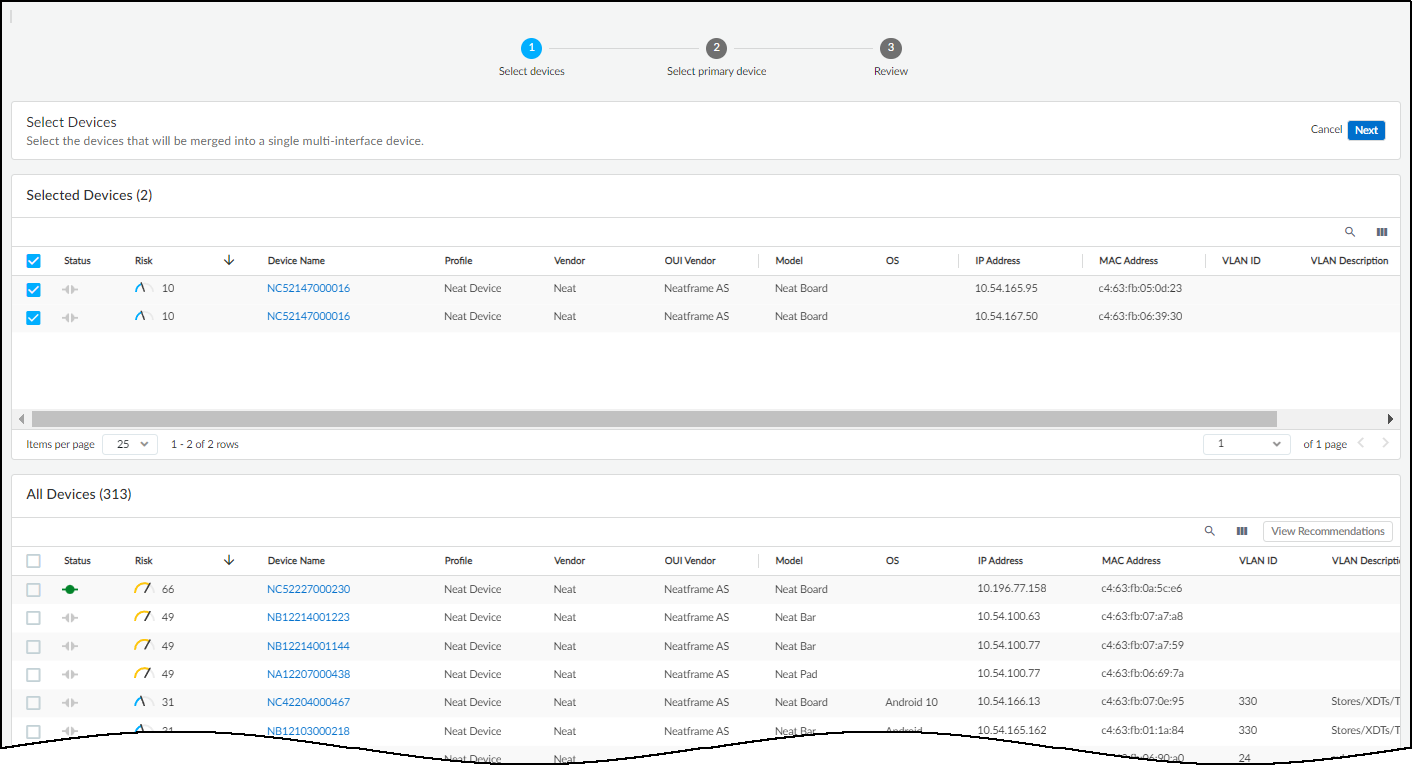
- Select Devices: Confirm or adjust the devices/interfaces to be merged.
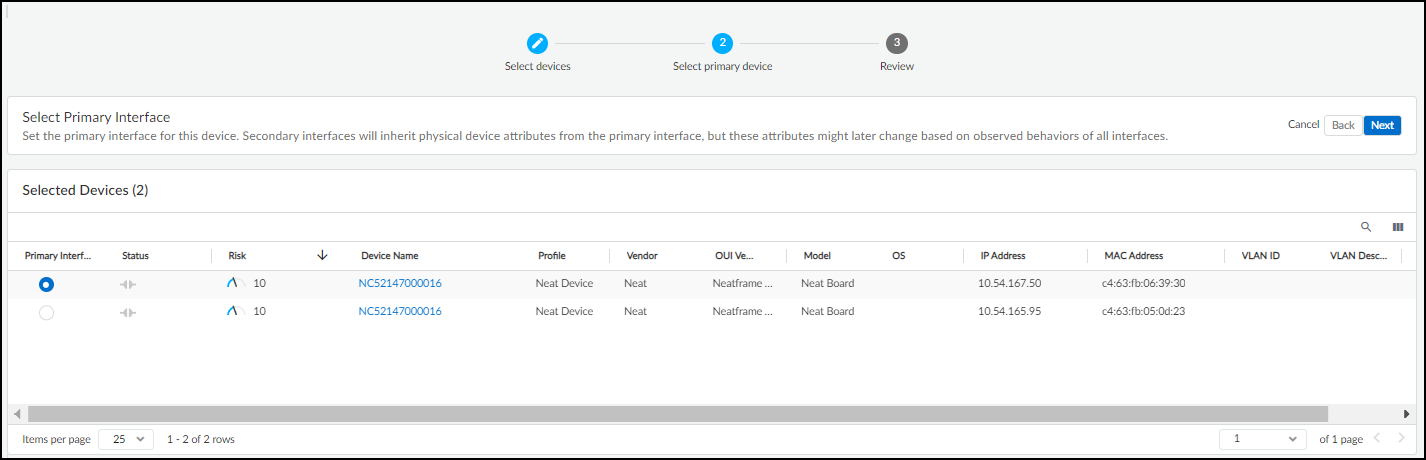
- Select Primary Interface: Choose the interface whose device-level attributes will represent the merged device. Consider the interface with the most traffic or the one on a management VLAN.
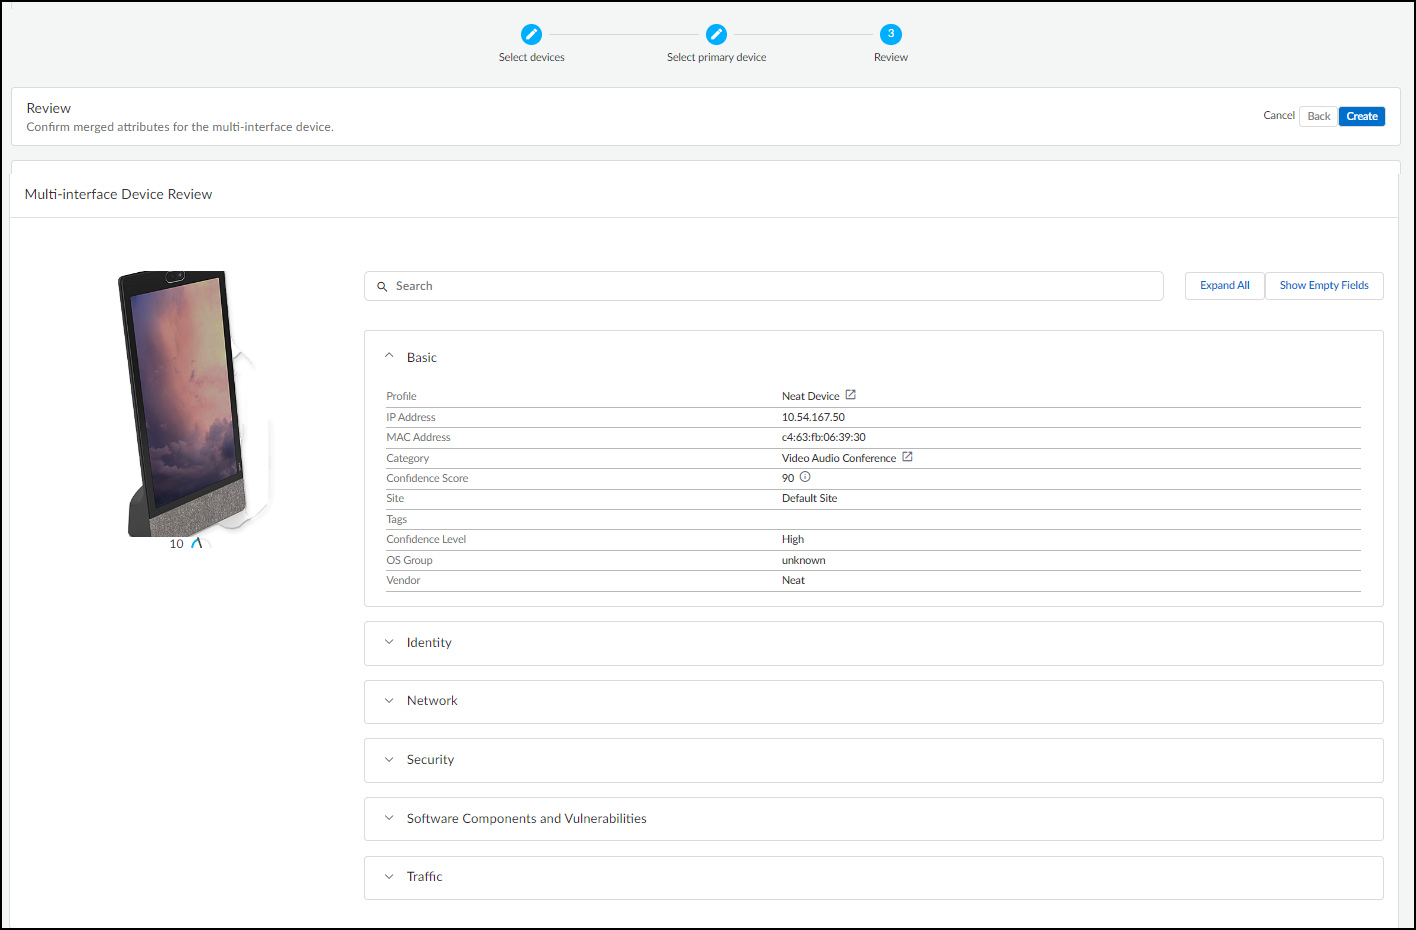
- Review Attributes: Check the resulting merged attributes (device-level from primary, network-level retained per interface).
- Create: Finalize the merge.
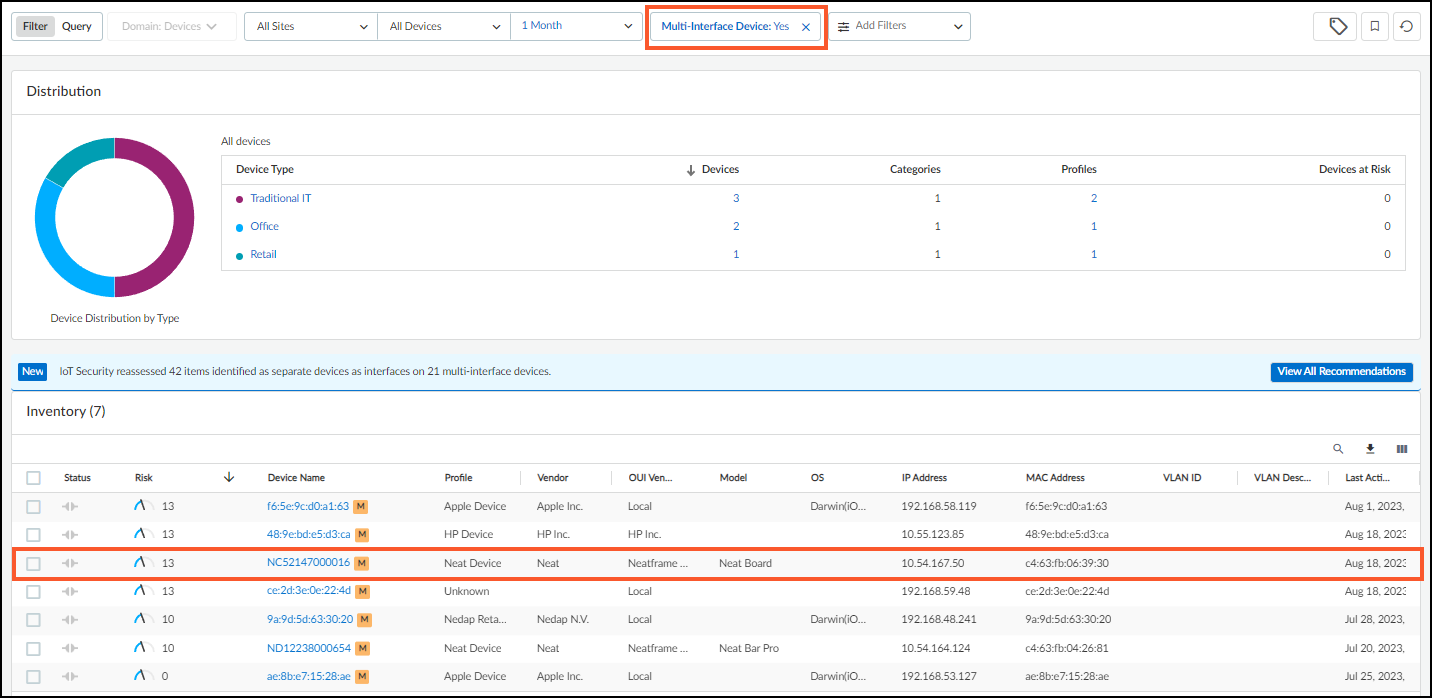
-
View Merged Device:
Use the "Multi-interface Devices" filter on the Devices page. The device will have a multi-interface icon (
 ).
).
- Manage Interfaces: Click the icon to view interfaces and access Edit/Unmerge options.

Editing/Unmerging:
- Use the Edit option (accessed via the multi-interface icon) to change the primary interface, add more interfaces, or remove specific interfaces (returning them to individual devices).
- Use the Unmerge option to dissolve the multi-interface device back into individual devices.
Devices with Static IP Addresses
While DHCP is common, many environments (especially industrial/OT) rely heavily on static IP addressing for devices like controllers, servers, and printers. IoT Security can handle purely static, purely dynamic (DHCP), and mixed environments.
Static IP Discovery Methods:
- ARP Analysis: IoT Security learns IP-to-MAC mappings from ARP logs, effective within the same Layer 2 broadcast domain as the reporting firewall.
- Machine Learning: For devices beyond L2 boundaries, ML algorithms analyze traffic patterns to infer the likely presence of static IPs.
- Manual Configuration: You can explicitly tell IoT Security about static IP devices or entire subnets designated for static IPs.
Important: Manually configuring a static IP is not enough to add it to the inventory. IoT Security must also detect network traffic associated with that IP address.
Configuring Static IPs in IoT Security:
You can inform IoT Security about static IPs using these methods:
1. Upload a List of Static IP Devices (CSV)
- Navigate to Assets > Devices > User-Defined Static IP Devices .
- Click Add > Upload Static IP Devices .
- Download the CSV template.
- Fill the template with IP Address (mandatory) and optionally MAC Address, Vendor, Model. (Limit 10,000 devices per file).
- Upload the completed CSV file.
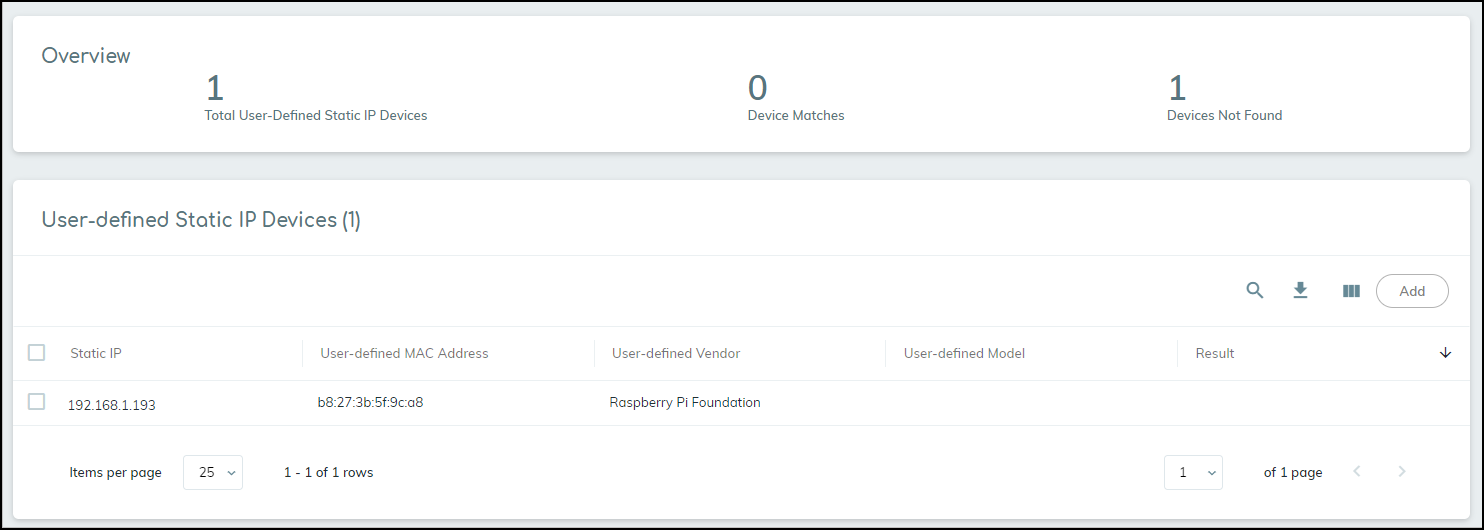
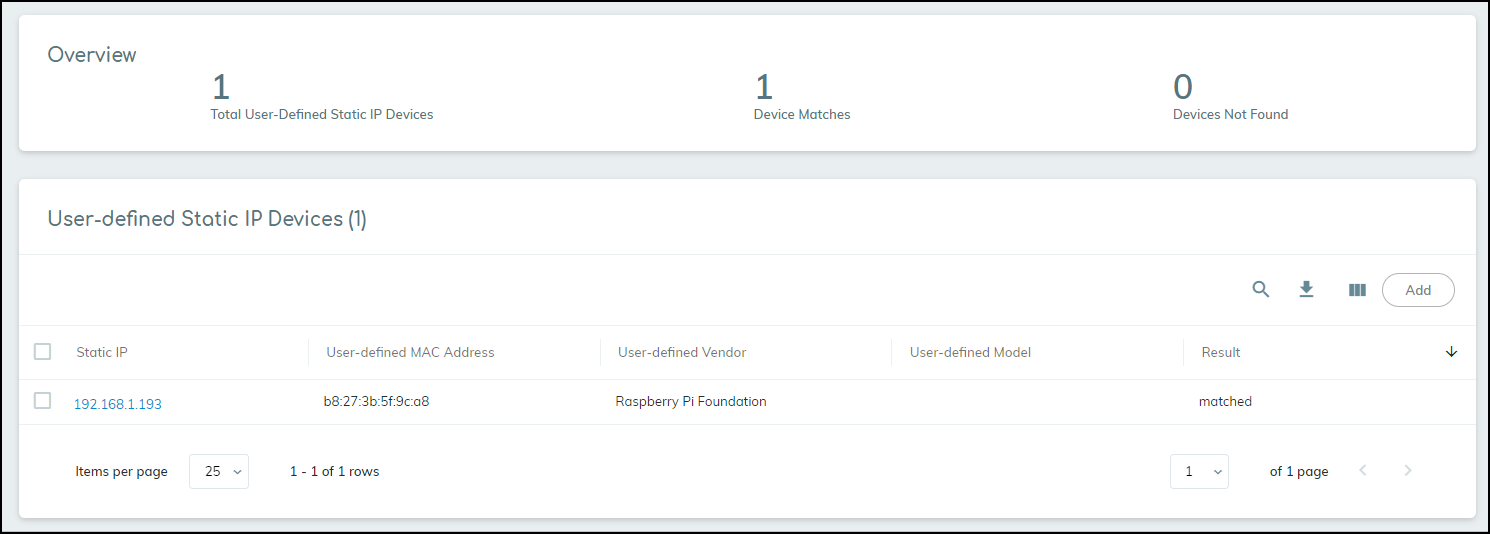
-
IoT Security attempts to match uploaded IPs with detected network activity.
- Matched: If activity is detected (or was previously detected) for the IP, the device is added/updated in the main inventory. The result shows "matched".
- Not Found: If no activity is detected, the entry is listed, but the device isn't added to the main inventory until traffic is seen. The result column is empty or shows a dash.
- Remark: If a MAC address is provided in the upload but IoT Security detects a *different* MAC for that IP via network traffic, the detected MAC address takes precedence.
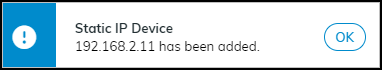
2. Add a Single Static IP Device Configuration
- Go to Assets > Devices > User-Defined Static IP Devices .
- Click Add > Manually Add a Static IP Device .
- Enter the IP Address (mandatory) and optionally MAC Address, Vendor, Model.
- Click Add .
- The device initially appears as "not found" until network traffic is matched to the IP address.
3. Upload a List of Subnets Containing Only Static IPs (CSV)
- Useful when an entire subnet range is reserved for static assignments.
- Navigate to Networks > Networks and Sites > Networks .
- Click Add > Upload Subnets .
- Download the template.
-
Fill in:
- prefix: Subnet address in CIDR notation (e.g., 10.1.1.0/24).
- vlan: (Optional) VLAN ID.
- description: (Optional) Subnet description.
- static: Enter yes .
- monitored: Enter yes to enable full monitoring (profiling, risk analysis) or leave blank/enter no for basic detection only.
- Upload the CSV file.
- When IoT Security detects traffic from an IP within a subnet marked as static (and the device wasn't discovered via other means like ARP), it adds the device to the inventory using the IP as the primary identifier. The source will be listed as "User-Configured".
- Gotcha! Removing a static subnet configuration will also remove associated devices added via this method from the inventory.
4. Add a Single Subnet Containing Only Static IPs
- Go to Networks > Networks and Sites > Networks .
- Click Add > Add a Subnet .
- Set Type to Subnet.
- Enter Prefix (CIDR notation).
- (Optional) Enter Name, VLAN ID, Description.
- Check the box Mark this subnet as static .
- Click Save .
- Devices subsequently detected in this subnet (and not via other means) will be treated as static IP devices.
Devices with Overlapping IP Addresses (via Network Segments)
As previously mentioned under Network Segments Configuration, overlapping IP addresses occur when the same IP range is used in different network locations or segments (e.g., guest networks at multiple sites). IoT Security uses Network Segments in conjunction with IP Address-based Site Assignment to correctly identify and differentiate devices in these scenarios.
The key principle is that the combination of (Shared IP Block + Network Segment identified by Firewall) uniquely identifies a device .
Configuration Steps:
- Ensure IP Address-based Site Assignment is active.
- Create Network Segments: For each distinct area/site using the overlapping IP range, create a Network Segment and assign the relevant firewall(s) monitoring that area to it. Assign the segment to its corresponding site. (See Network Segments Configuration section).
-
Define the Shared IP Block:
- Navigate to Networks > Networks and Sites > Networks .
- Locate the subnet or IP block that is being reused. If it doesn't exist, add it first.
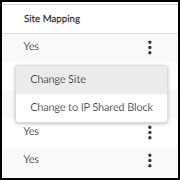
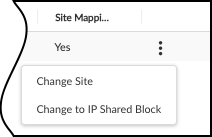
- Click the '...' menu for that row and select Change to IP Shared Block .
- Verify the 'Type' column now shows "Shared Block".
Changing a standard block/subnet to a Shared IP Block. 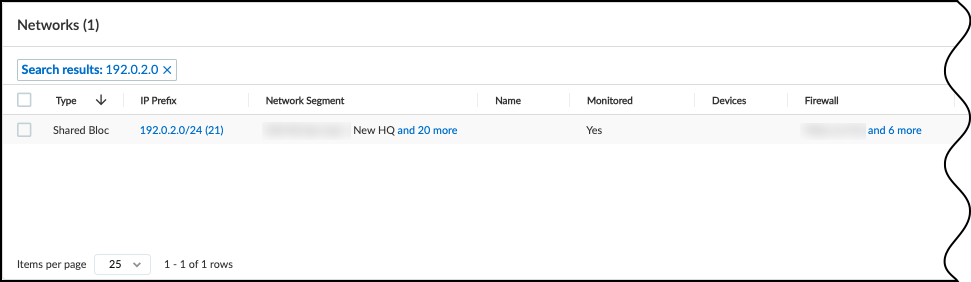
Shared IP Block type confirmed in the table. -
Verify Segments within the Shared Block:
- Click the Prefix of the newly defined Shared Block.
- The table should now list entries of 'Type' = Segment.
- Verify that there is a Segment entry corresponding to each Network Segment you created that uses this shared IP range. The 'Network Segment' and 'Site' columns in this view should match your configuration from the Network Segments Configuration page.

Viewing Segments within a Shared IP Block. -
Verify Device Inventory:
- Go to Assets > Devices .
- Add the "Network Segments" and "Firewall" columns to the view.
- Confirm that devices within the overlapping IP range are correctly assigned to their respective Network Segments and associated with the correct reporting Firewall. Devices with the same IP should appear as distinct entries if they belong to different Network Segments.
IP Endpoints
IP Endpoints represent network entities for which IoT Security knows the IP address but lacks a stable, unique identifier like a MAC address, or whose behavior is too inconsistent to classify as a static IP device. This often occurs for devices behind routers, NAT devices, or in different L3 domains from the reporting firewall.
IoT Security also learns about IP endpoints through third-party integrations (network/asset management systems, SNMP queries).
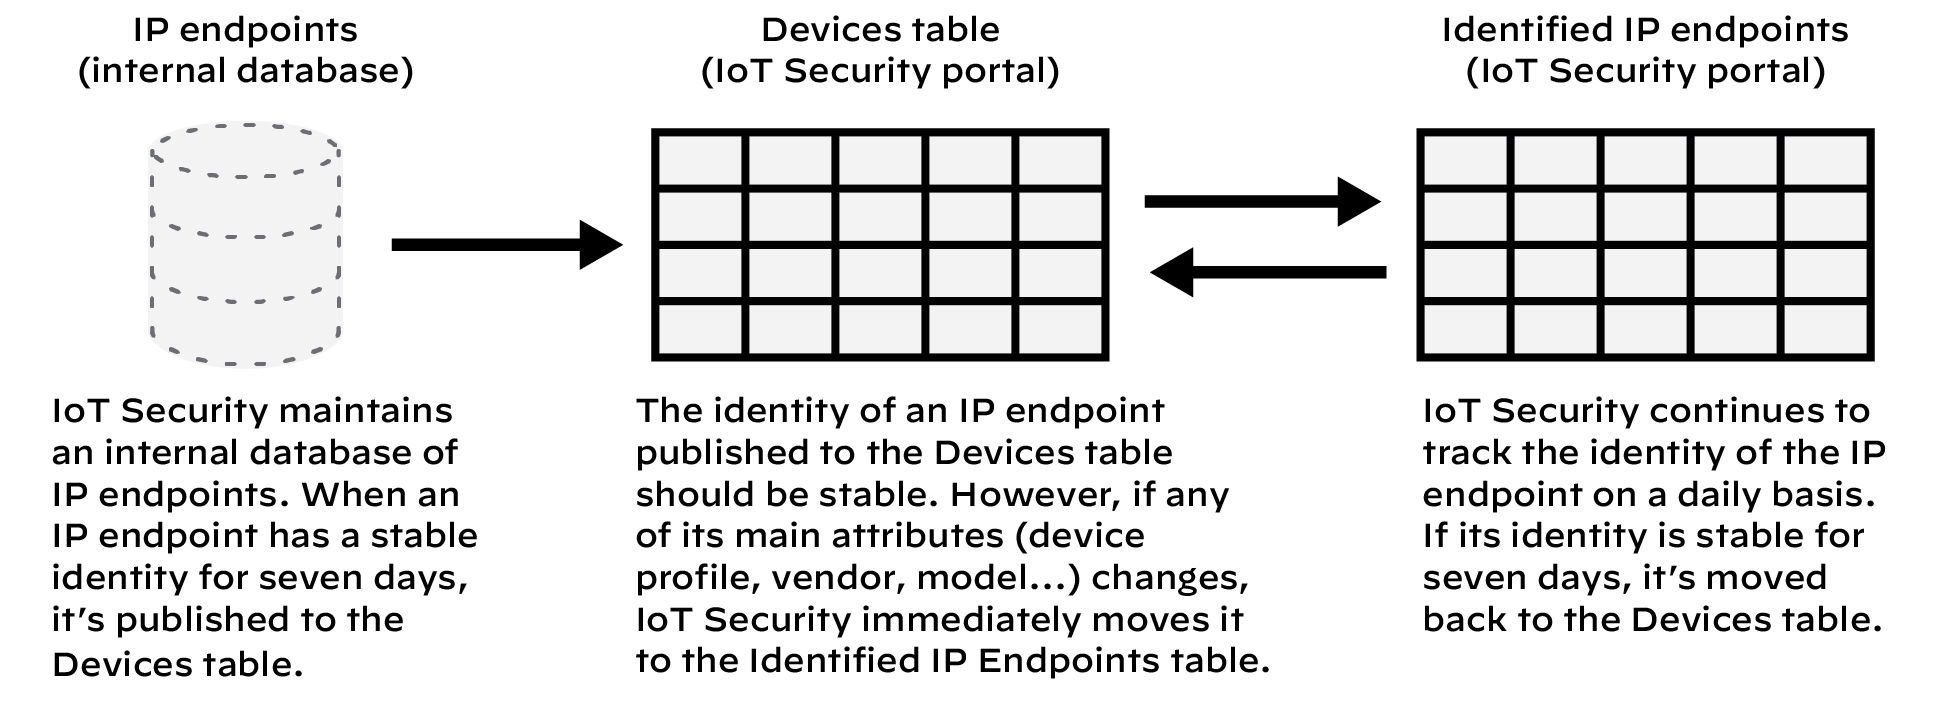
Lifecycle of an IP Endpoint:
- IP address activity detected, but no MAC address learned OR behavior is unstable.
- Classified as an "IP Endpoint". Not yet in the main device inventory.
- If traffic patterns stabilize and major attributes (profile, category, vendor, model, OS, hostname, serial, site ID) remain unchanged for 7 consecutive days , IoT Security promotes the IP Endpoint to a full device entry on the Assets > Devices page.
- If, after promotion, any of these major attributes change later, the device is moved back to the "Identified IP Endpoints" list on the Assets > Devices > IP Endpoints page.
- If behavior stabilizes again for 7 days, it can be promoted back to the main Devices page.
Viewing IP Endpoints:
Navigate to Assets > Devices > IP Endpoints .
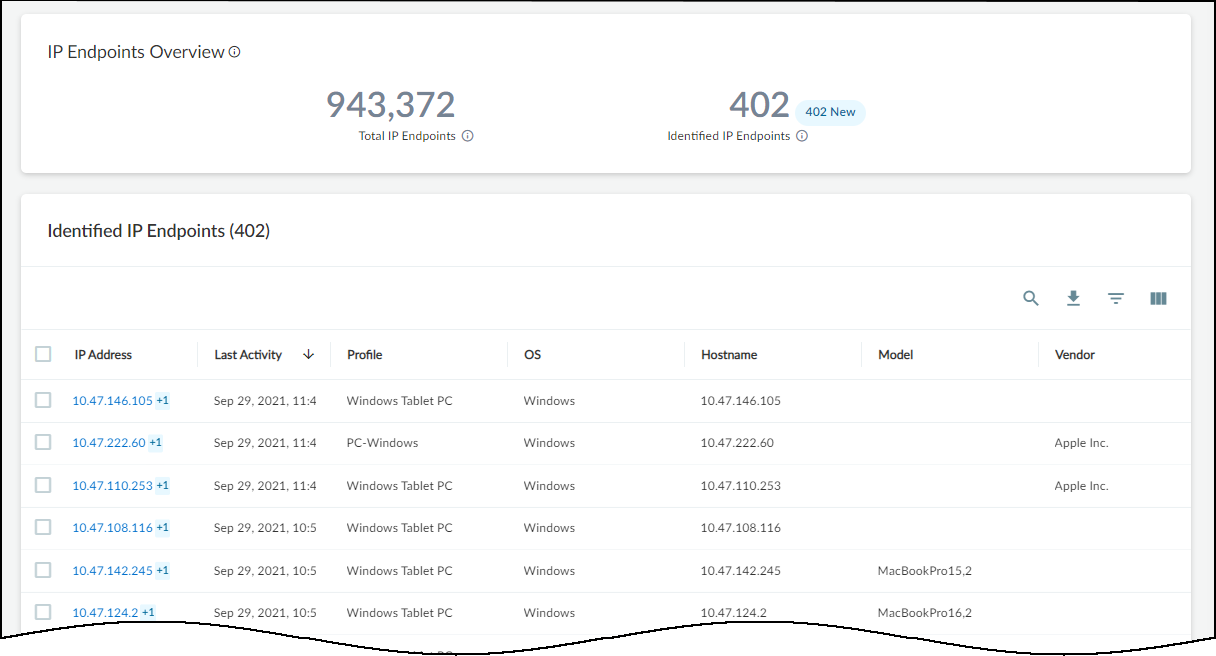
- Total IP Endpoints: Overall count of IPs without stable identifiers. Filterable by site, *approximate* device type (IoT vs IT), and time range.
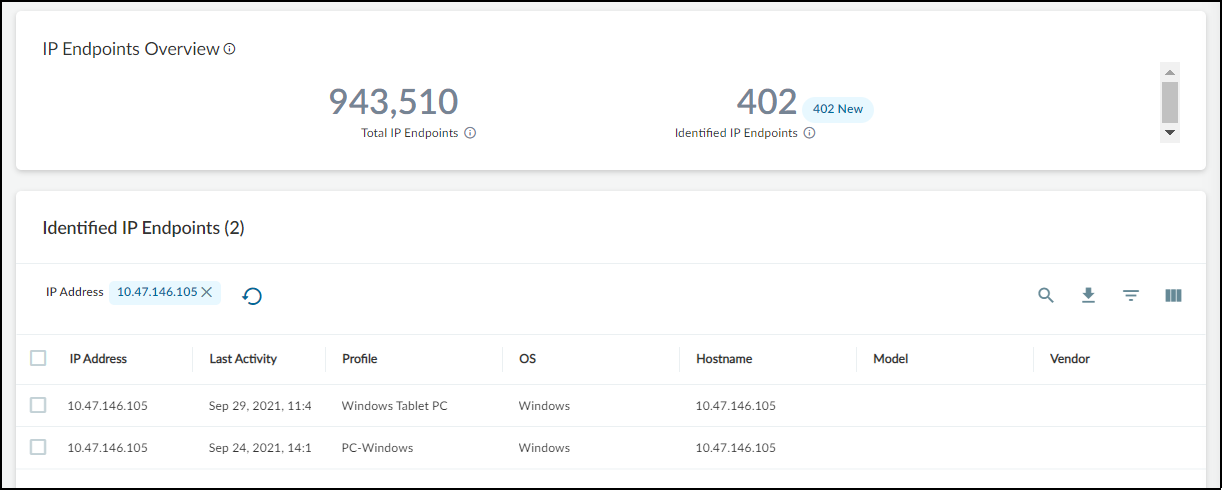
- Identified IP Endpoints: List of IP Endpoints that were previously promoted to Devices but have since shown attribute changes. Clicking an IP address shows its attribute change history (last 10 changes within 30 days).
Remark: A high number of IP Endpoints can indicate gaps in network visibility (e.g., lack of ARP/DHCP logs from certain segments). Refer to the Data Quality Diagnostics page for recommendations.
Parse Industrial OT Device Files
Important: Requires IoT Security Industrial OT subscription.
In Operational Technology (OT) environments, Programmable Logic Controller (PLC) configuration, program, and inventory files (collectively "device files") contain rich asset information, including names, models, vendors, firmware, hardware components, and relationships between devices. This data is especially valuable for assets in isolated network segments where passive traffic monitoring might be limited.
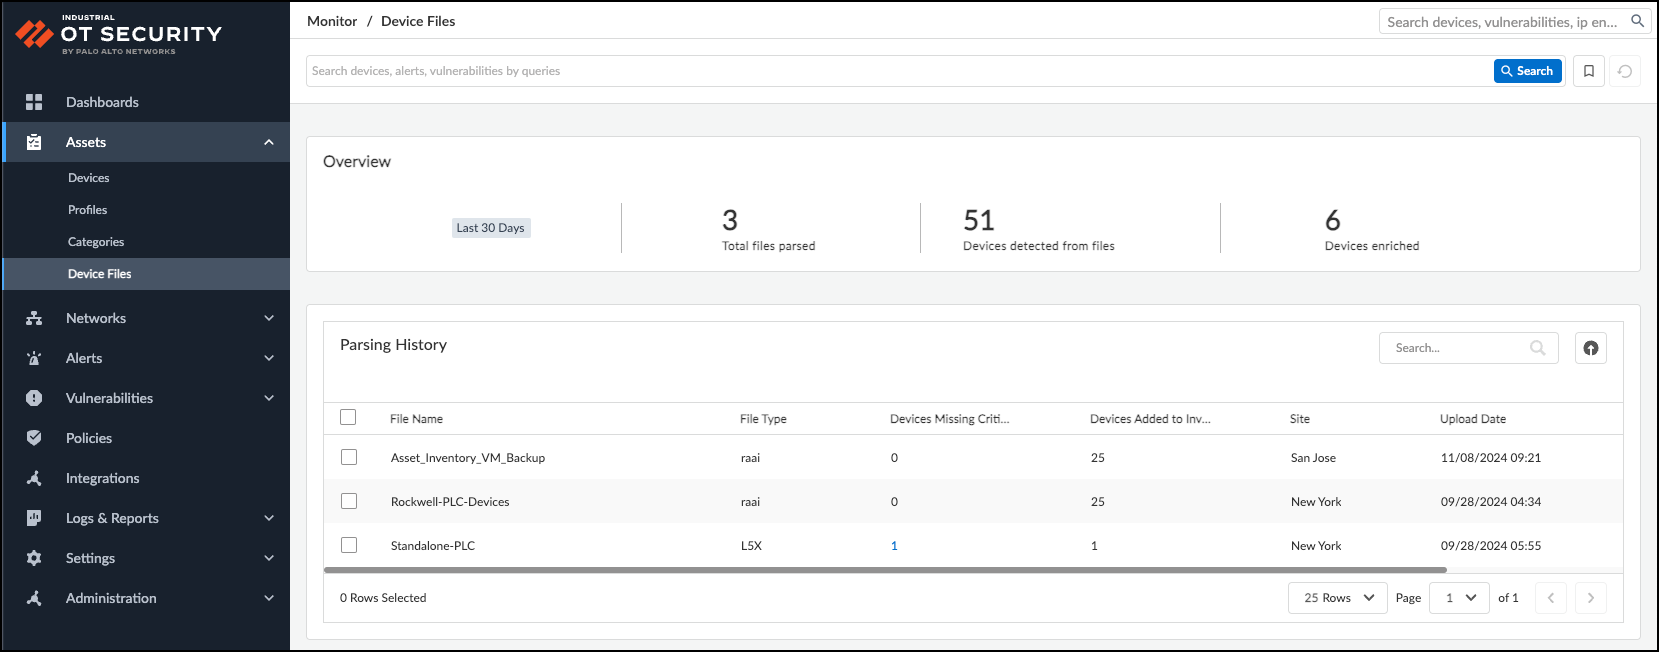
Uploading these device files to IoT Security (at Assets > Device Files ) supplements the inventory gathered through traffic monitoring and other integrations.
Supported File Types:
- Rockwell AssetCentre (.raai)
- Studio 5000 Logix Designer (.l5x)
- Unity Application Exchange File (.xef)
- Siemens TIA Portal v17 (.zip containing .plf and .idx)
- Beckhoff TwinCAT (.tnzip containing .sln and .tsproj)
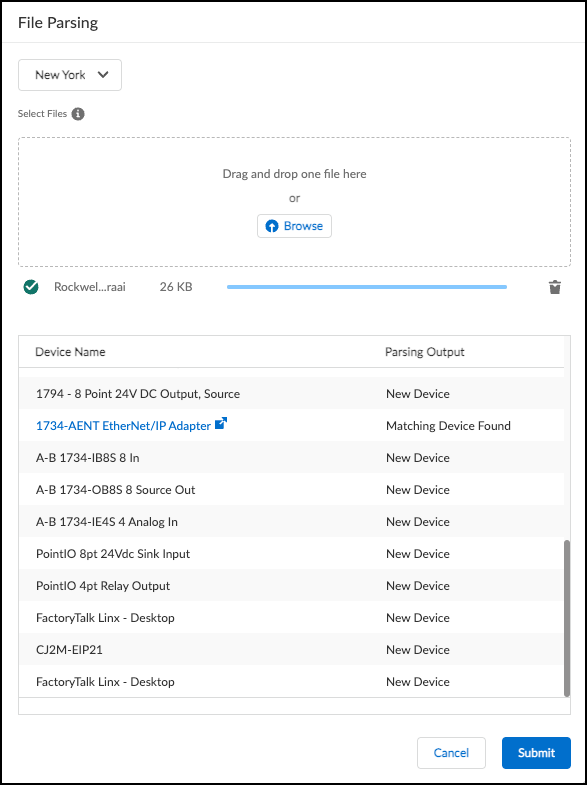
Uploading Device Files:
- Navigate to Assets > Device Files .
- Click the Upload icon.
- Select the Site to associate the file with (important for resolving potential IP overlaps and assigning sites to new devices).
- Upload the device file (one at a time, max 100 MB).
- Review Parsed Output: IoT Security displays discovered devices, indicating if they are new or matched to existing inventory entries.
- Provide Missing Info: If prompted ("Additional Info Required"), provide the missing IP and optionally MAC address to help IoT Security match or create the device entry accurately. Devices without a MAC will be created as static IPs/IP Endpoints.
- Click Submit to add the discovered/enriched information to the IoT Security inventory.
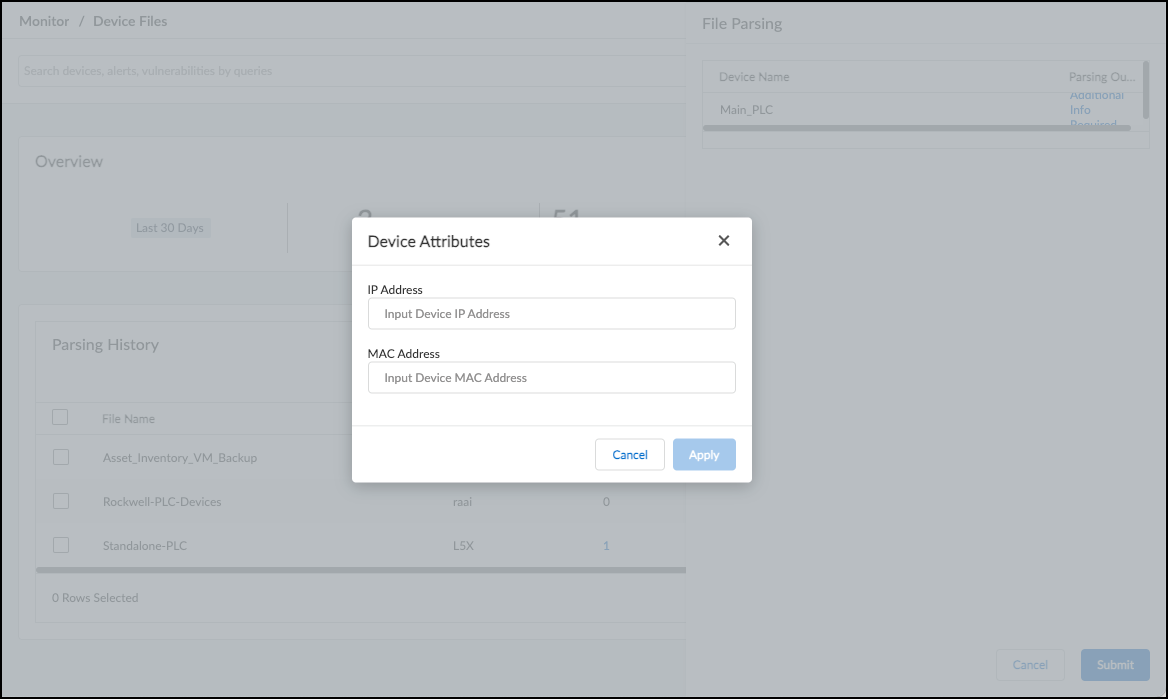
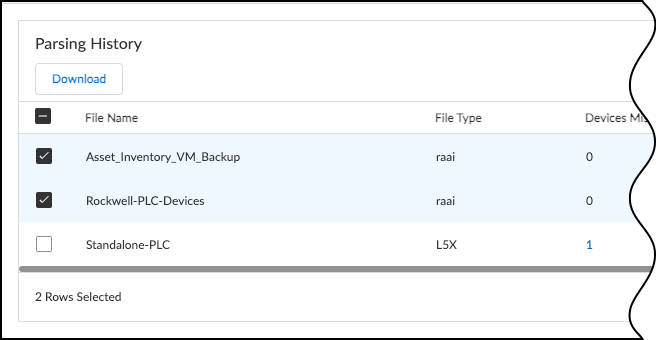
Managing Uploaded Files:
- The Parsing History table lists uploaded files, status, and counts of devices needing more info.
- Click the number under "Devices Missing Critical Information" to add missing IPs/MACs later.
- Select file(s) and click Download to retrieve previously uploaded files.
Discover Mobile Device Attributes
IoT Security can ingest mobile (cellular) network attributes via GTP logs forwarded from Palo Alto Networks firewalls . This allows tracking of mobile devices by IMEI and viewing attributes like IMSI/SUPI, MSISDN, APN/DNN, Radio Access Technology (RAT), location codes (MCC, MNC, LAC), etc.
Important: Mobile devices are classified as "Traditional IT". IoT Security provides inventory visibility but does not generate policy recommendations or behavior-based alerts for them.
Firewall Configuration (PAN-OS):
Remark: Requires specific PAN-OS configuration.- Enable GTP Security: Go to Device > Setup > Management > General Settings (Edit) > GTP Security (Enable). Commit and Reboot.
- Create Log Forwarding Profile: Objects > Log Forwarding > Add. Name it, enable "Enhanced application logging to Strata Logging Service".
- Create Mobile Network Protection Profile: Configure based on device generation (5G w/ RADIUS, 5G w/ PFCP, 3G/4G w/ GTP-C) as per PAN-OS documentation recommendations for correlating User-ID/Equipment-ID.
- Create Security Policy Rules: Create rules matching relevant mobile traffic (e.g., GTP-U, RADIUS, PFCP). Assign the Mobile Network Protection profile and the Log Forwarding profile created earlier. Ensure "Log at Session End" is enabled.
- Commit the configuration.
Viewing Mobile Attributes in IoT Security:
- Check log status under Administration > Firewalls (look for GTP logs).
- Go to Assets > Devices .
-
Use the Column selector (
) and enable columns under the "Mobile" section (e.g., Mobile Equipment Identity (IMEI), Mobile Subscriber Identity (IMSI/SUPI), Mobile APN, RAT, etc.).
- These attributes are also visible on the Device Details page for mobile devices and can be used in custom alert rule conditions.
Network Visualizations
Important: Requires IoT Security Industrial OT subscription.
Network visualization maps provide graphical representations of communication patterns between groups of devices, helping to identify trends, anomalies, and relationships, particularly in OT environments.
Grouping Methods:
Maps organize devices based on attributes. You can create single-layer or two-layer maps:
- Layer 1 Grouping: Category, Profile, Vendor, Subnet, VLAN ID, Purdue Level.
-
Layer 2 Grouping (Optional, depends on Layer 1):
- If Layer 1 = Vendor: Layer 2 can be Risk Level.
- If Layer 1 = Subnet, VLAN ID, or Purdue Level: Layer 2 can be Category or Profile.
Remark: To group by Purdue Level, you must first assign levels to devices , typically using custom attribute rules based on filters (e.g., assigning profiles common in Level 2 to the "Level 2" attribute).
Creating a Visualization Map:
- Navigate to Networks > Network Visualizations .
- Click + Create Map .
- Select the Site(s) for the map scope and click Add to Scope , then Next .
- Click Device Grouping and choose the Layer 1 (and optional Layer 2) grouping attribute(s).
- Refine the scope further using filters (time range, device attributes, alerts, vulnerabilities) to limit the map to relevant devices and stay under the 500-node display limit . Click Update to apply scope changes.
- Review the generated visualization. Adjust scope/grouping as needed.
- Click Build Map .
- Enter a Name and optional Description . Review the final Scope and Device Grouping.
- Click Confirm .
Viewing Data in a Visualization Map:
Interact with saved maps under Networks > Network Visualizations by clicking View Map .
- Nodes: Circles represent groups (subnets, profiles, etc.) or individual devices. Number inside a group circle = device count. Colored edge segments indicate risk proportion (Red=Critical, Orange=High, Yellow=Medium). Circle size is proportional to device count relative to other groups on the map.
- Highlight Tool: Enter filter criteria at the top to highlight matching groups/devices with a blue ring (ring length proportional to match percentage within the group).
-
Interactions:
- Hover: Shows pop-up info for groups or devices.
- Single-Click: Focuses on the node, showing details in a right-side panel.
- Double-Click: Drills into a group or shows a device's connections.
- Drag: Reposition nodes on the main map view.
- Table/Breadcrumbs: Navigate layers using the table below the map and the breadcrumbs above it.
- Back Button: Moves up one layer or returns to the visualizations landing page.
- Legend & Map Management (Left Side): Zoom controls (+/-) and an info icon reveal a legend explaining colors/icons (risk levels, highlights, connection types like Internet, Off-map, IP Endpoint). The Map Management section lets you toggle the visibility of certain connection types (Inner connections within groups, IP Endpoints, Off-map devices, Internet connections).
IoT Device Vulnerability Detection
IoT Security identifies vulnerabilities associated with discovered IoT devices. A vulnerability is an intrinsic flaw in software or hardware, while risk considers the vulnerability plus environmental factors , configuration, behavior, and policy.
Key Concepts:
- Confirmed Vulnerability: Applies when a device's specific type, model, and version (or serial number range) definitively match a known vulnerability description.
- Potential Vulnerability: Applies when the device type matches, but the model, version, or serial number is unknown or doesn't precisely match, yet cannot be ruled out.
- Important: Vulnerability detection applies only to devices classified as IoT , not Traditional IT.
Vulnerability Management Pages:
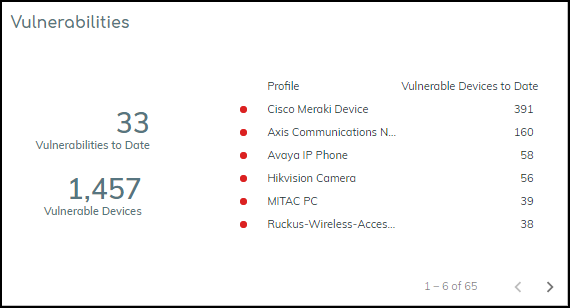
- Vulnerability Overview Dashboard: Provides customizable views, key statistics, top vulnerabilities, distribution charts, and trend analysis.
- All Vulnerabilities Page: A detailed table listing all detected vulnerabilities with various metrics.
- Vulnerability Details Page: In-depth information about a specific CVE, including affected devices and remediation steps.
Vulnerability Overview Dashboard
Navigate to Vulnerabilities > Vulnerability Overview .
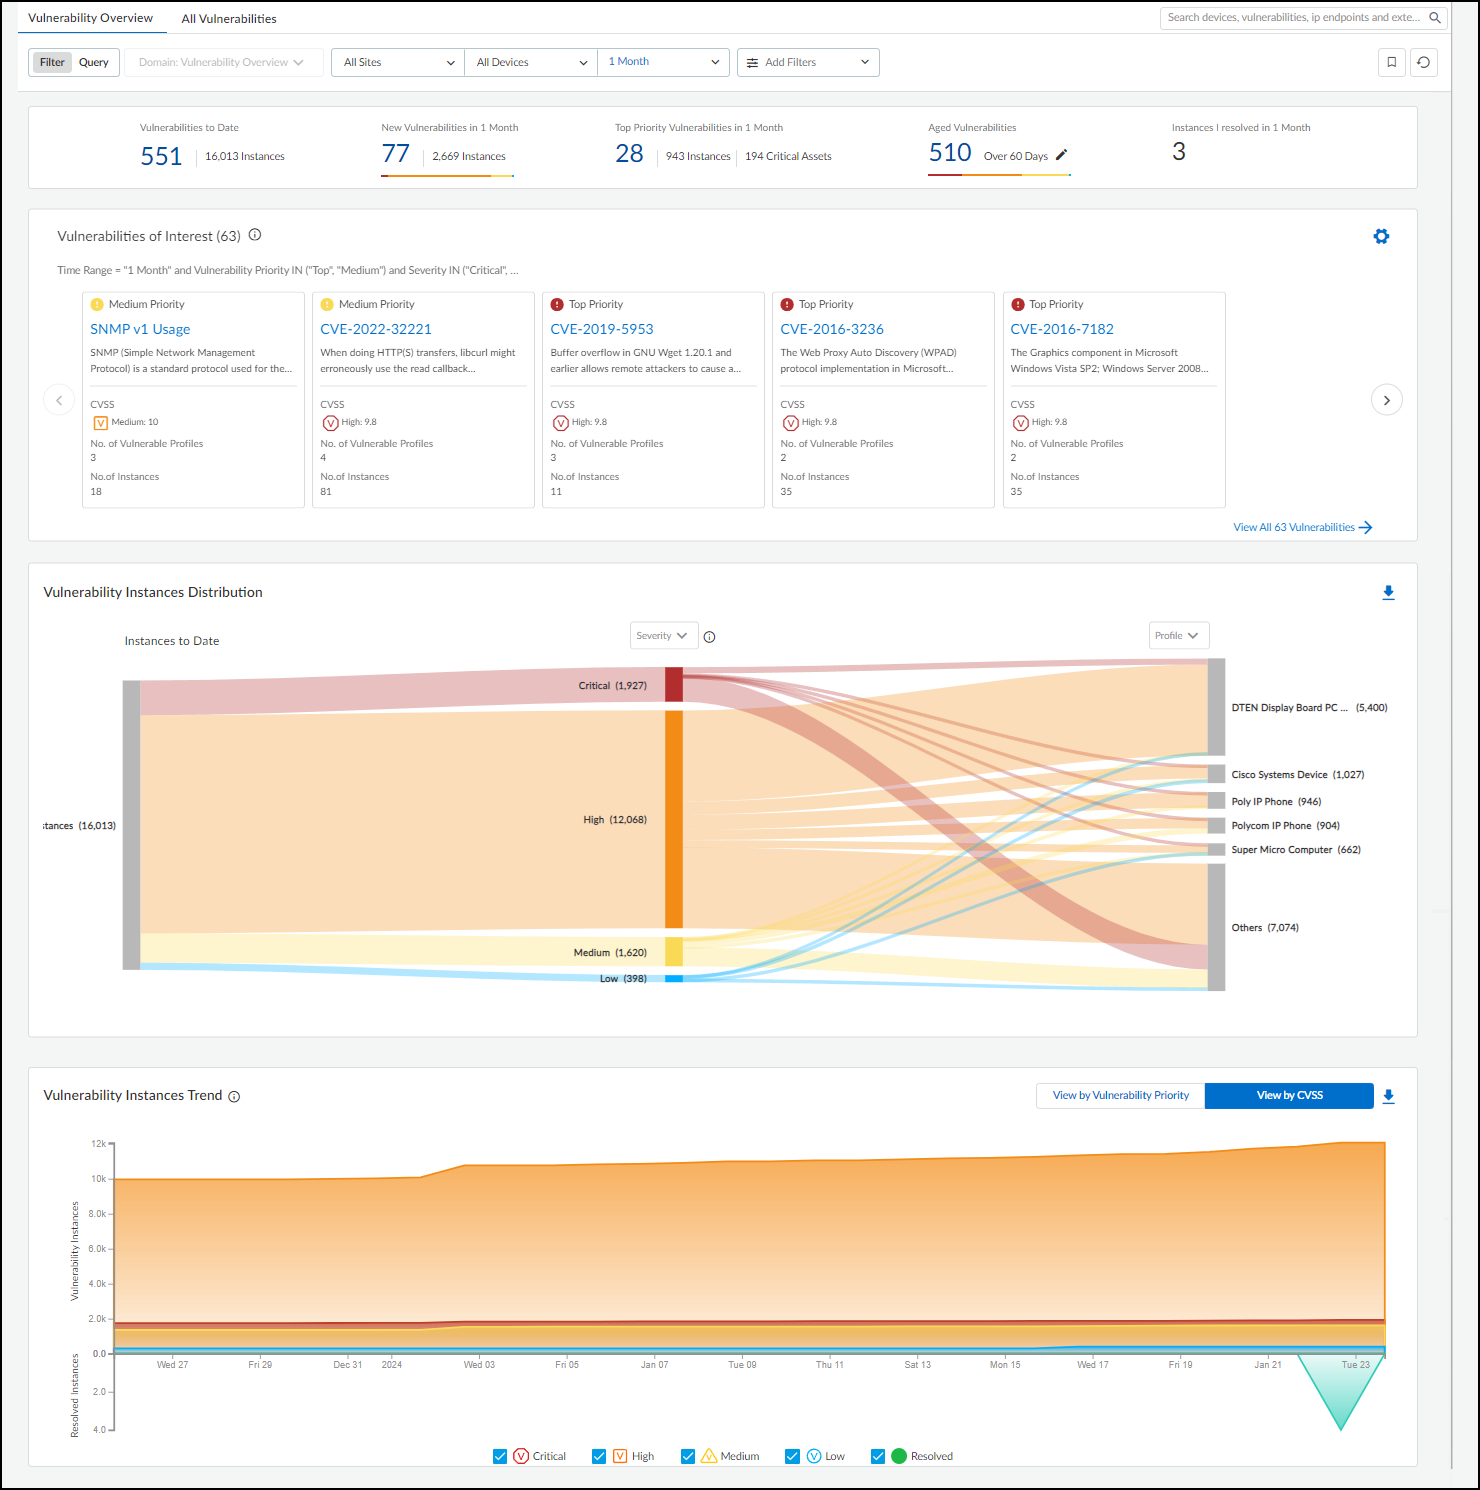
This dashboard provides:
- Summary Statistics (Top): Filtered by Site, Device Category, Time Range. Shows totals for Vulnerabilities to Date, New Vulnerabilities, Top Priority Vulnerabilities (and affected instances/assets), Aged Vulnerabilities (unresolved beyond 30/60/90/180 days), and Instances Resolved by the current user.
-
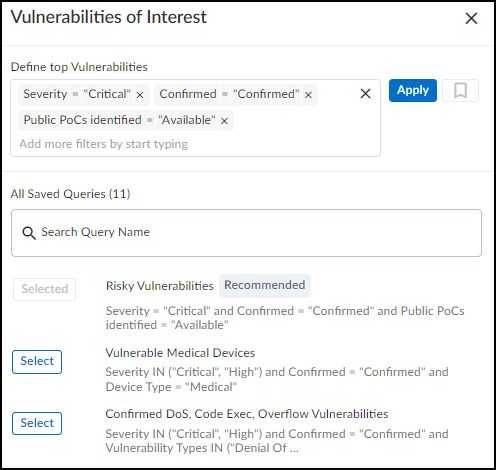
Vulnerabilities of Interest:
Customizable query (default: "Risky Vulnerabilities" - Critical CVEs with PoC) showing the top 10 matching vulnerabilities based on severity and impact. Use the gear icon (
 ) to configure.
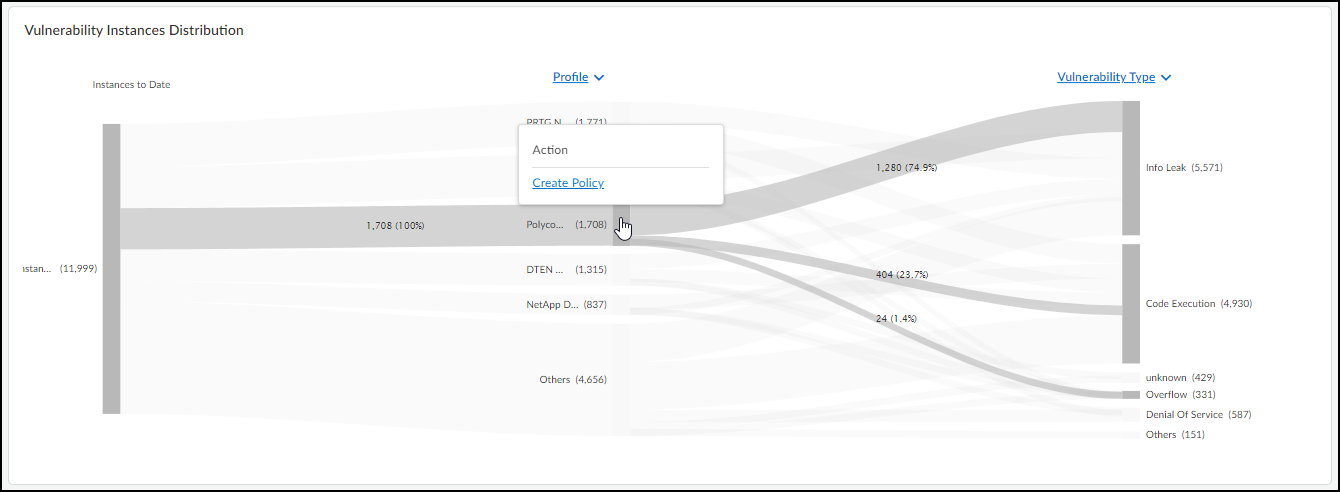
- Vulnerability Instances Distribution (Sankey Chart): Visualizes how vulnerability instances (all active instances to date, regardless of time filter) relate across different groupings (Severity, Type, Status, Device Type/Category/Profile/Vendor, Exploit Status, Attack Vector, Priority). Hover/click for details. Downloadable as XLSX.
- Vulnerability Instances Trend: Line chart showing cumulative active vulnerability instances and daily resolved instances over the selected time period. View by Priority or CVSS score. Downloadable as XLSX.
Vulnerabilities Page
Navigate to Vulnerabilities > Vulnerability Overview > All Vulnerabilities .
This page provides a detailed table listing all detected vulnerabilities.


Features:
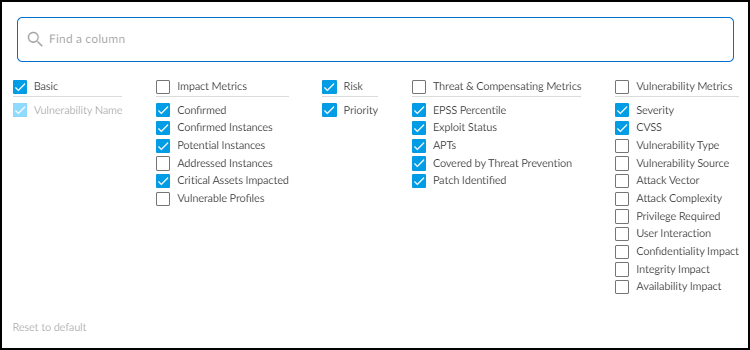
- Search, filter, download, column customization (show/hide/rearrange), pagination.
- Columns grouped by: Risk, Basic, Vulnerability Metrics, Threat Metrics, Impact Metrics. Ungroup via '...' menu for free column rearrangement.
-
Key Columns:
- Priority (Risk): Top/Medium/Low ranking based on likelihood and impact. Hover for contributing factors. Considers Asset Criticality (configurable via Custom Attributes).
- Vulnerability Name (Basic): CVE ID or name. Links to Vulnerability Details page.
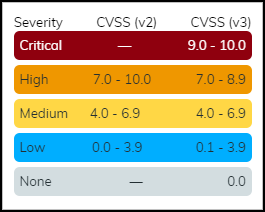
- Severity (Vulnerability Metrics): Critical, High, Medium, Low ( Remark: based partially on CVSS but adjusted by IoT Security context, so may not map directly to CVSS ranges ).
- CVSS (Vulnerability Metrics): Base score (0-10).
- Other Vulnerability Metrics: Type, Source, Attack Vector (Physical, Local, Adjacent, Network), Attack Complexity, Privileges Required, User Interaction, Confidentiality/Integrity/Availability Impact.
- EPSS (Threat Metrics): Exploit Prediction Scoring System percentile (probability of exploit in next 30 days).
- Other Threat Metrics: Exploit Status (Unknown, POC, Weaponized, Exploited in the Wild), APTs involved, Covered by Threat Prevention.
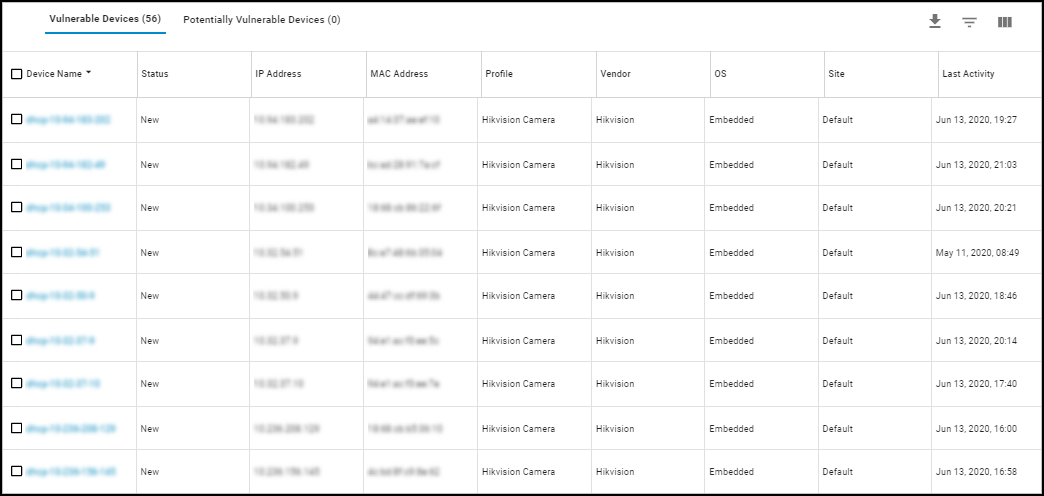
- Confirmed (Impact Metrics): Checkmark if confirmed on at least one device.
- Confirmed/Potential Instances (Impact Metrics): Count of devices where the vulnerability is confirmed/potential. Links to Vulnerability Details page.
- Other Impact Metrics: Addressed Instances, Critical Assets Impacted, Vulnerable Profiles count.
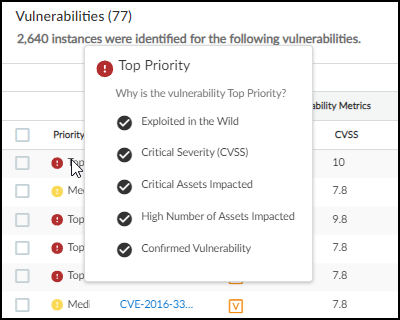
Vulnerability Priority details. 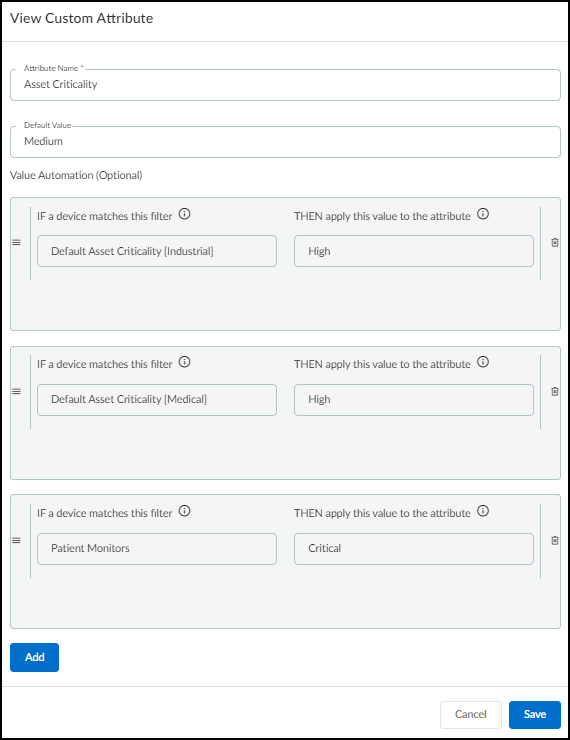
Configuring Asset Criticality levels. 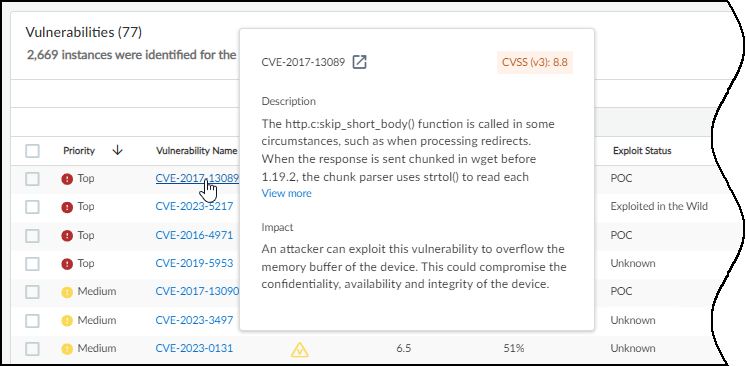
Hovering over Vulnerability Name shows details. 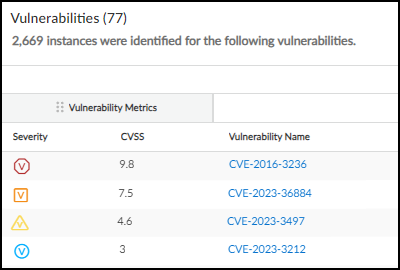
Severity level icons.
Vulnerability Details Page
Accessed by clicking a vulnerability name (CVE) or instance count from the Vulnerabilities page.
Key Sections:
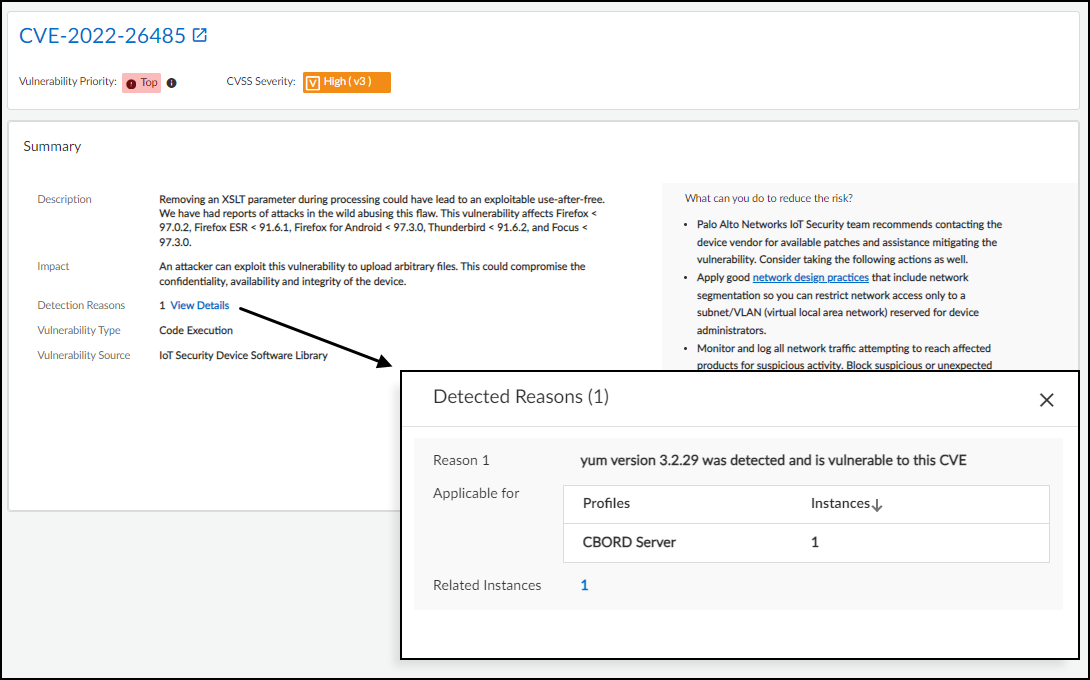
- Header: CVE ID (links to NIST NVD), CVSS score, IoT Security Severity level.
- Summary: Description, Impact, Detection Reasons, Type, Source, Patches, Recommendations.
- Vulnerability Metrics: Detailed CVSS submetrics (Attack Vector, Complexity, Privileges, User Interaction, Confidentiality/Integrity/Availability Impact, Scope).
- Threat & Compensating Metrics: EPSS percentile, Exploit Status (Unknown, POC, Weaponized, Exploited in the Wild), Known Exploits (View Details), APT involvement (View Details), Threat Prevention Coverage (View Details).
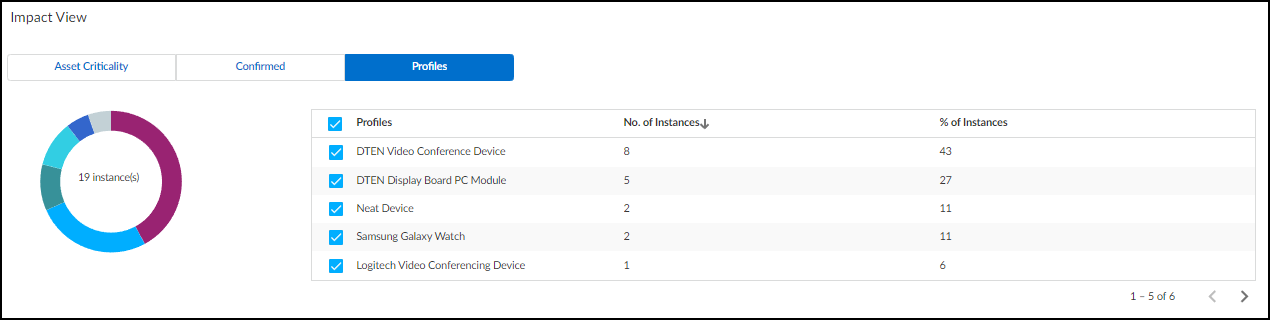
- Impact View: Charts/tables showing affected assets by Criticality Level, Confirmation Status (Confirmed vs Potential), and Profile distribution.
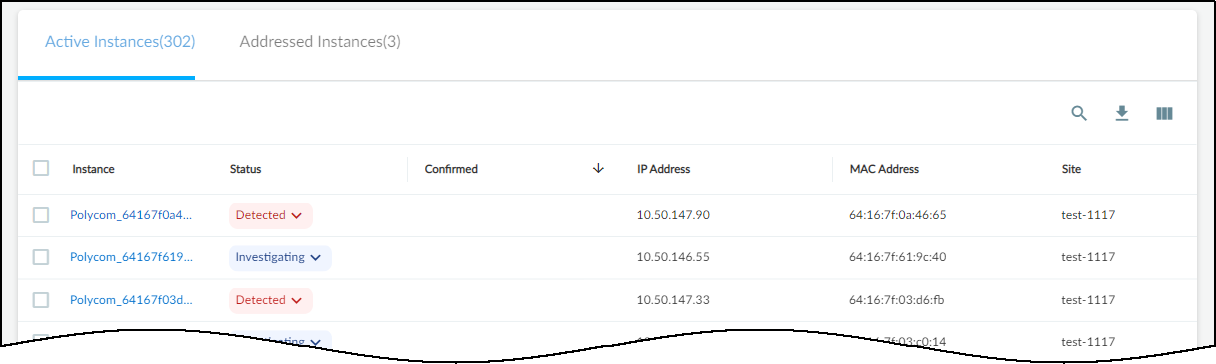
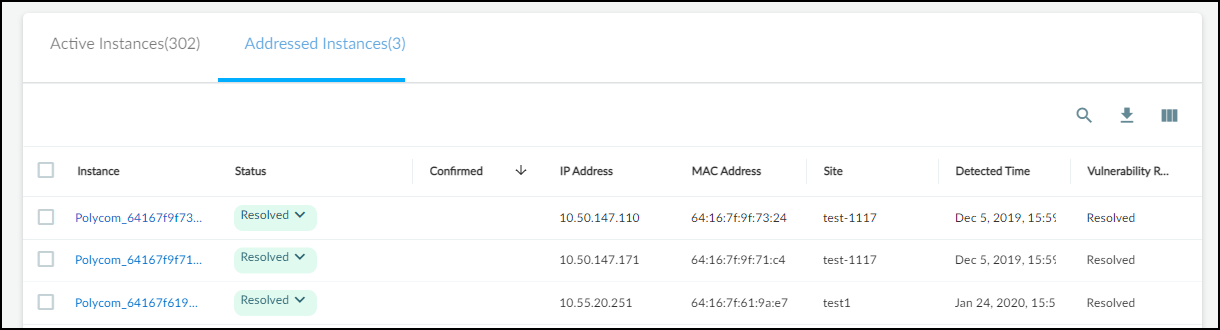
-
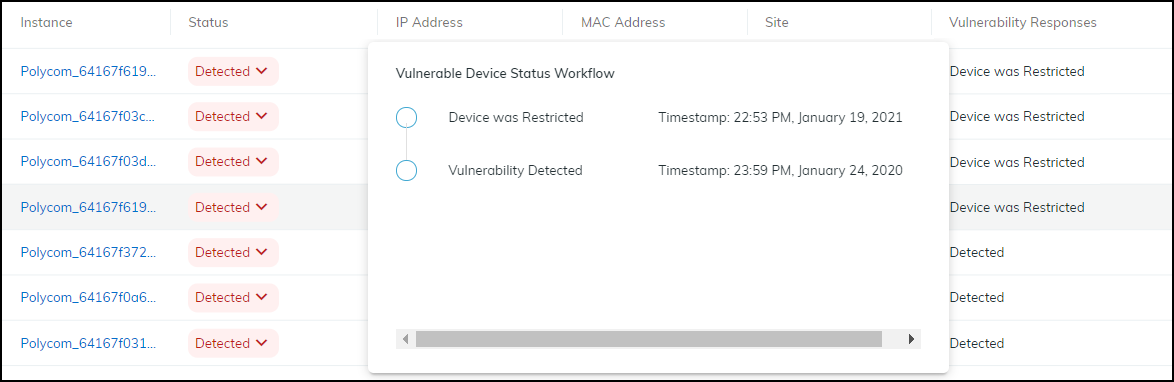
Instances Tabs (Active/Addressed):
Tables listing affected devices (instances).
- Columns: Instance (Device Name - links to Device Details), Status (Detected, Investigating, Remediating, Resolved), Assigned To, Confidence Level, Site, etc.
- Changing Status: Click status dropdown. Resolving prompts for a reason. Resolved instances move to the "Addressed" tab. Changing back to Detected moves it back to "Active".
- Assigning: Select instance(s), click More > Assign. Enter username/email. Important: Assignee must have an IoT Security account.
- Adding Notes: Select instance(s), click More > Add notes. Notes appear in "Vulnerability Responses" column history.
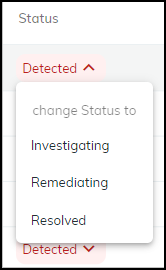
Changing instance status. 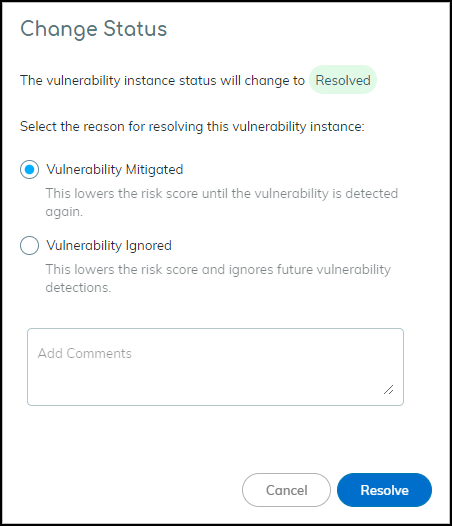
Resolving a vulnerability instance. 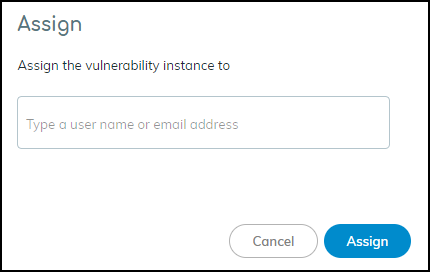
Assigning an instance for investigation. 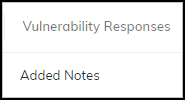
Indicator for added notes. 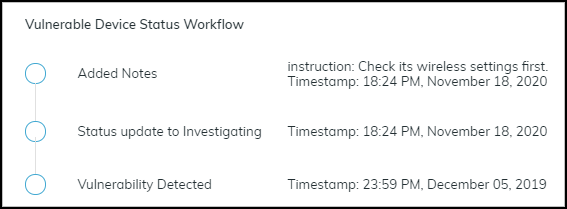
Viewing response history (status changes, notes).
IoT Risk Assessment
IoT Security calculates risk scores at four levels: individual Device, Device Profile, Site, and overall Organization . Scores range from 0-100, indicating increasing risk severity.
Risk Factors Considered:
- Static (Baseline): MDS2 risks (medical), intrinsic profile factors (OS, apps, role), trending threats, typical usage behavior.
- Dynamic (Added): Real-time threats/alerts, behavioral anomalies, detected vulnerabilities (passive analysis + scanner integrations).
Remark: Risk scores are recalculated daily.
Viewing Risk Scores:
- Device Risk: Assets > Devices (Risk column) and Device Details page (top section, Security summary, Risks timeline graph).
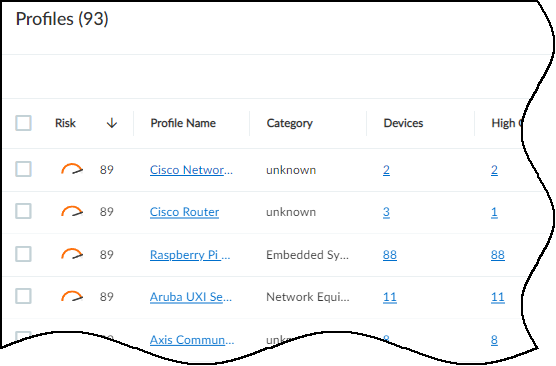
- Device Profile Risk: Assets > Profiles (Risk column). Calculated based on individual device risks within the profile, weighted by the number and risk level of devices.
- Site Risk: Networks > Networks and Sites > Sites (Risk Score column). Calculated based on a weighted average of device profile risk scores within the site.
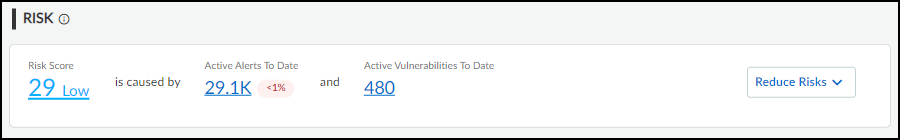
- Organization Risk: Dashboards > Security Dashboard (Risk panel). Calculated similarly to Site Risk, encompassing all sites.
Risk Score Severity Levels:
| Risk Score | Severity | Notes |
|---|---|---|
| < 40 | Low | Normal risk level. |
| 40-69 | Medium | Some anomalies, medium alerts, or CVSS 4.0-6.9 vulnerabilities likely present. |
| 70-89 | High | Multiple significant anomalies, high alerts, or CVSS 7.0-8.9 vulnerabilities likely present. |
| 90-100 | Critical | Multiple extreme anomalies, critical alerts (e.g., malware), or CVSS 9.0+ vulnerabilities likely present. |
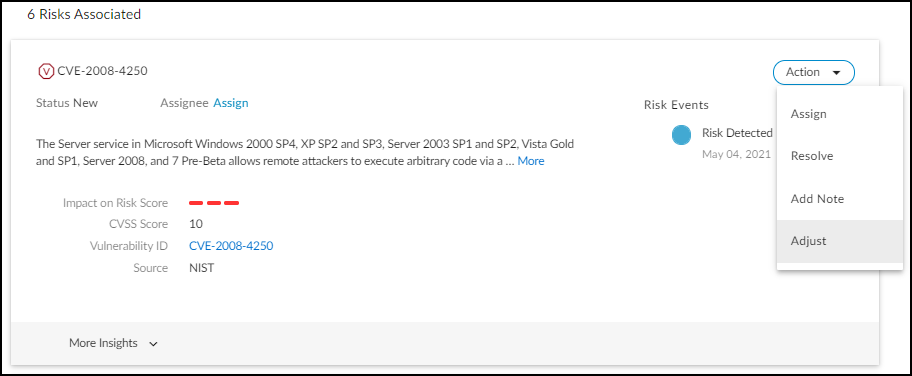
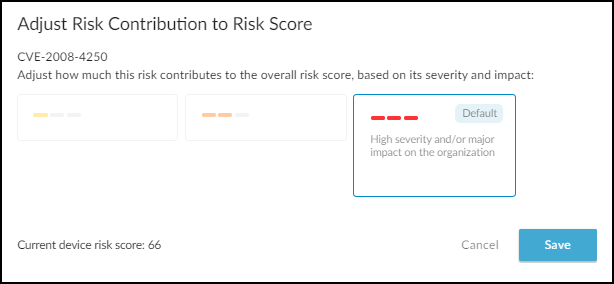
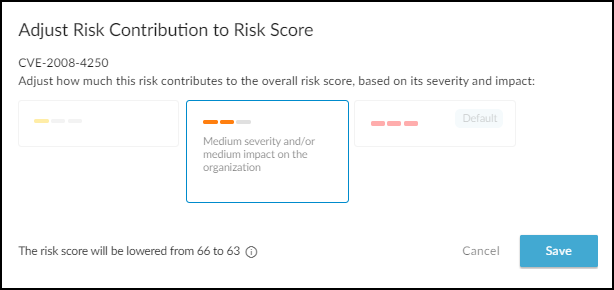
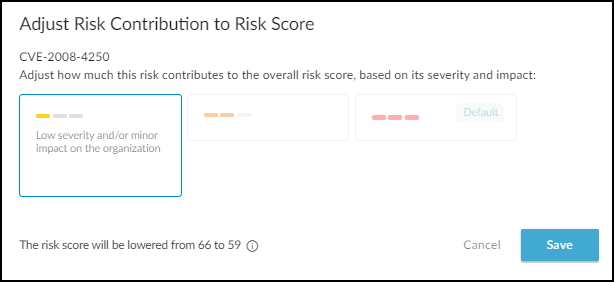
Adjusting Device Risk Scores:
You can manually adjust the *contribution* of a specific vulnerability (not alerts triggered by firewalls) to a device's overall risk score.
- Go to the device's Device Details page.
- In the Vulnerabilities section, find the vulnerability to adjust.
- Expand its Actions menu ('...') and click Adjust .
- Select Low, Medium, or High contribution based on its perceived impact in your environment.
- Save the adjustment. Remark: The impact on the overall score depends on other existing risk factors.
Alerts for Risk Score Changes:
IoT Security generates alerts when a risk score *increases* across severity thresholds:
- Warning: High (70-89) to Critical (90+).
- Caution: Medium (40-69) to High (70-89).
- (No alert for Low to Medium increases).
Risk scores can also change due to daily refreshes finding new/resolved vulnerabilities or changed CVSS scores, or user actions resolving risks.
Resolving Risks:
Resolving vulnerabilities or security alerts (by mitigating or accepting the risk) can lower device, profile, site, and organization risk scores. See Vulnerability Details and Act on Security Alerts sections for workflows.
Customize Risk Scores
IoT Security allows tailoring the risk assessment framework to better match your organization's specific security posture and risk tolerance. This involves adjusting the weights and values of various factors contributing to device risk scores.
Navigate to Settings > Risk Score Configuration to manage these customizations.
Customizable Factors:
- Vulnerabilities: Define rules to assign specific risk scores to vulnerabilities based on criteria like CVE ID, severity, exploit status, etc.
- Security Alerts: Adjust the base risk score associated with each alert severity level (Critical, High, Medium, Low).
- Other Risk Factors: Modify the risk score contribution of system-defined factors like OS status or MDS2 findings (for medical).
- Impact Factor (Asset Criticality): Change how much each asset criticality level (Critical, High, Medium, Low) amplifies the overall device risk score.
- Compensating Controls: Define controls (like endpoint protection status) that reduce the assessed risk of specific vulnerabilities or factors when present on a device.
Customizing Vulnerability Rules:
- Go to Settings > Risk Score Configuration > Vulnerabilities table.
- Click Add Vulnerability Rule .
- Define a Rule Name and optional Description .
- Set the Vulnerability Criteria (e.g., CVSS > 9.0 AND Exploit Status = Weaponized). Multiple criteria use AND logic.
- Assign the desired Risk Score (0-100) to apply if a vulnerability matches ALL criteria.
- Click Apply .
- Remark: If a vulnerability matches multiple rules, the highest assigned risk score is used. Edit existing rules using the pencil icon.
Customizing Security Alert Scores ( Owner Role Required ):
- Go to Settings > Risk Score Configuration > Security Alerts section.
- Click the pencil icon next to the severity level (Critical, High, Medium, Low) you want to adjust.
- Enter the new Risk Score (0-100). Gotcha! Score cannot be higher than the level above it or lower than the level below it.
- Click Confirm . Click Reset to Default to revert all severities.
Customizing Other Risk Factor Scores:
- Go to Settings > Risk Score Configuration > Other Risk Factors section.
- Click the pencil icon next to the risk factor you want to adjust.
- Enter the new Risk Score (0-100).
- Click Confirm . Click Reset to Default to revert all factors.
Customizing Asset Criticality Impact Factors ( Owner Role Required ):
- Go to Settings > Risk Score Configuration > Impact Factor section.
- Click the pencil icon next to the Asset Criticality level (Critical, High, Medium, Low) you want to adjust.
- Enter the new Impact Factor (%) (0-100). Gotcha! Factor cannot be higher than the level above it or lower than the level below it.
- Click Confirm . Click Reset to Default to revert all levels.
Create Compensating Controls
Compensating controls represent security measures you've implemented (like endpoint protection, network segmentation, specific configurations) that mitigate the risk posed by certain vulnerabilities or inherent device risk factors . Defining these in IoT Security allows for a reduction in the calculated risk score for affected devices, providing a more accurate picture of residual risk.
Managing Compensating Controls:
Controls can be managed globally via Settings > Risk Score Configuration (Compensating Controls section) or viewed/applied individually on a device's Device Details page (via the "See Details" link on the risk score).
The Risk Score Configuration page has two tabs for controls:
- Compensating Control Type: Defines broad categories of controls (e.g., "Endpoint Security", "Network Segmentation"). Each type has a "Matching Rule" based on device attributes determining if a device *qualifies* for this type.
- Compensating Control Matching: Links a control type to specific assets (scope) and risks, defining the actual risk reduction percentage (factor).
Creating a New Compensating Control Type (Global Setting):
Define a new category if existing system types aren't sufficient.
- Navigate to Settings > Risk Score Configuration > Compensating Control Type tab.
- Click Add Compensating Control Type .
- Enter a Type name.
- Define the Matching Rule using device attributes determining qualification.
- Click Apply .
Applying a Compensating Control (Global Setting):
This links a Control Type to specific assets and risks, defining the actual risk reduction.
- Navigate to Settings > Risk Score Configuration > Compensating Control Matching tab.
- Click Apply Compensating Control .
- Select the control Type .
- Enter a Name and optional Description .
- Define the Asset Scope using filters.
- Define the Risk this control mitigates (Vulnerability criteria or Other Risk Factor).
- (Optional) Click View Matching Devices to verify scope.
- Enter the Compensating Control Factor (%) (0-100).
- Click Apply . Remark: Takes up to 24 hours to fully reflect in scores.
Applying/Adjusting Controls from Device Details Page:
- Navigate to the device's Device Details page.
- Click See Details next to the Risk Score.
- In the Exposure Score table, find a Risk row with a pencil icon in the "Compensating Control Name" field.
- Click the pencil icon.
- To Add New: Click + Add New . Define the control (Type, Name, Asset Scope [must include current device], Risk, Factor %). Click Apply .
- To Adjust Existing: Select an existing control. Modify the Compensating Control Factor (%) . Click Apply Changes .
Security Alert Overview
IoT Security generates alerts based on:
- Machine Learning: Detecting anomalous behavior deviating from the learned baseline.
- Pattern Detection: Identifying specific risky traffic patterns (e.g., connections to known malicious sites) without ML.
- Custom Alert Rules: User-defined rules triggering alerts based on specific events or traffic patterns (e.g., new device discovery, specific app usage, device offline).
- Firewall Threat Logs: Alerts forwarded from Palo Alto Networks NGFWs when they detect threats on IoT devices.
Important: Alerts are generated only for devices classified as IoT , not Traditional IT.
Remark: Alerts are retained for up to one year.
Navigate to Alerts > Security Alerts for alert management.
Alert Management Pages:
- Alert Overview (Dashboard): Customizable view of top alerts, risk analysis, and trends.
- All Alerts: Detailed table of all alert instances, filterable and sortable.
- Suppression Rules: Manage rules to prevent specific alerts from being generated in the future.
Alert Overview Dashboard Details:
Located at Alerts > Security Alerts > Alert Overview .
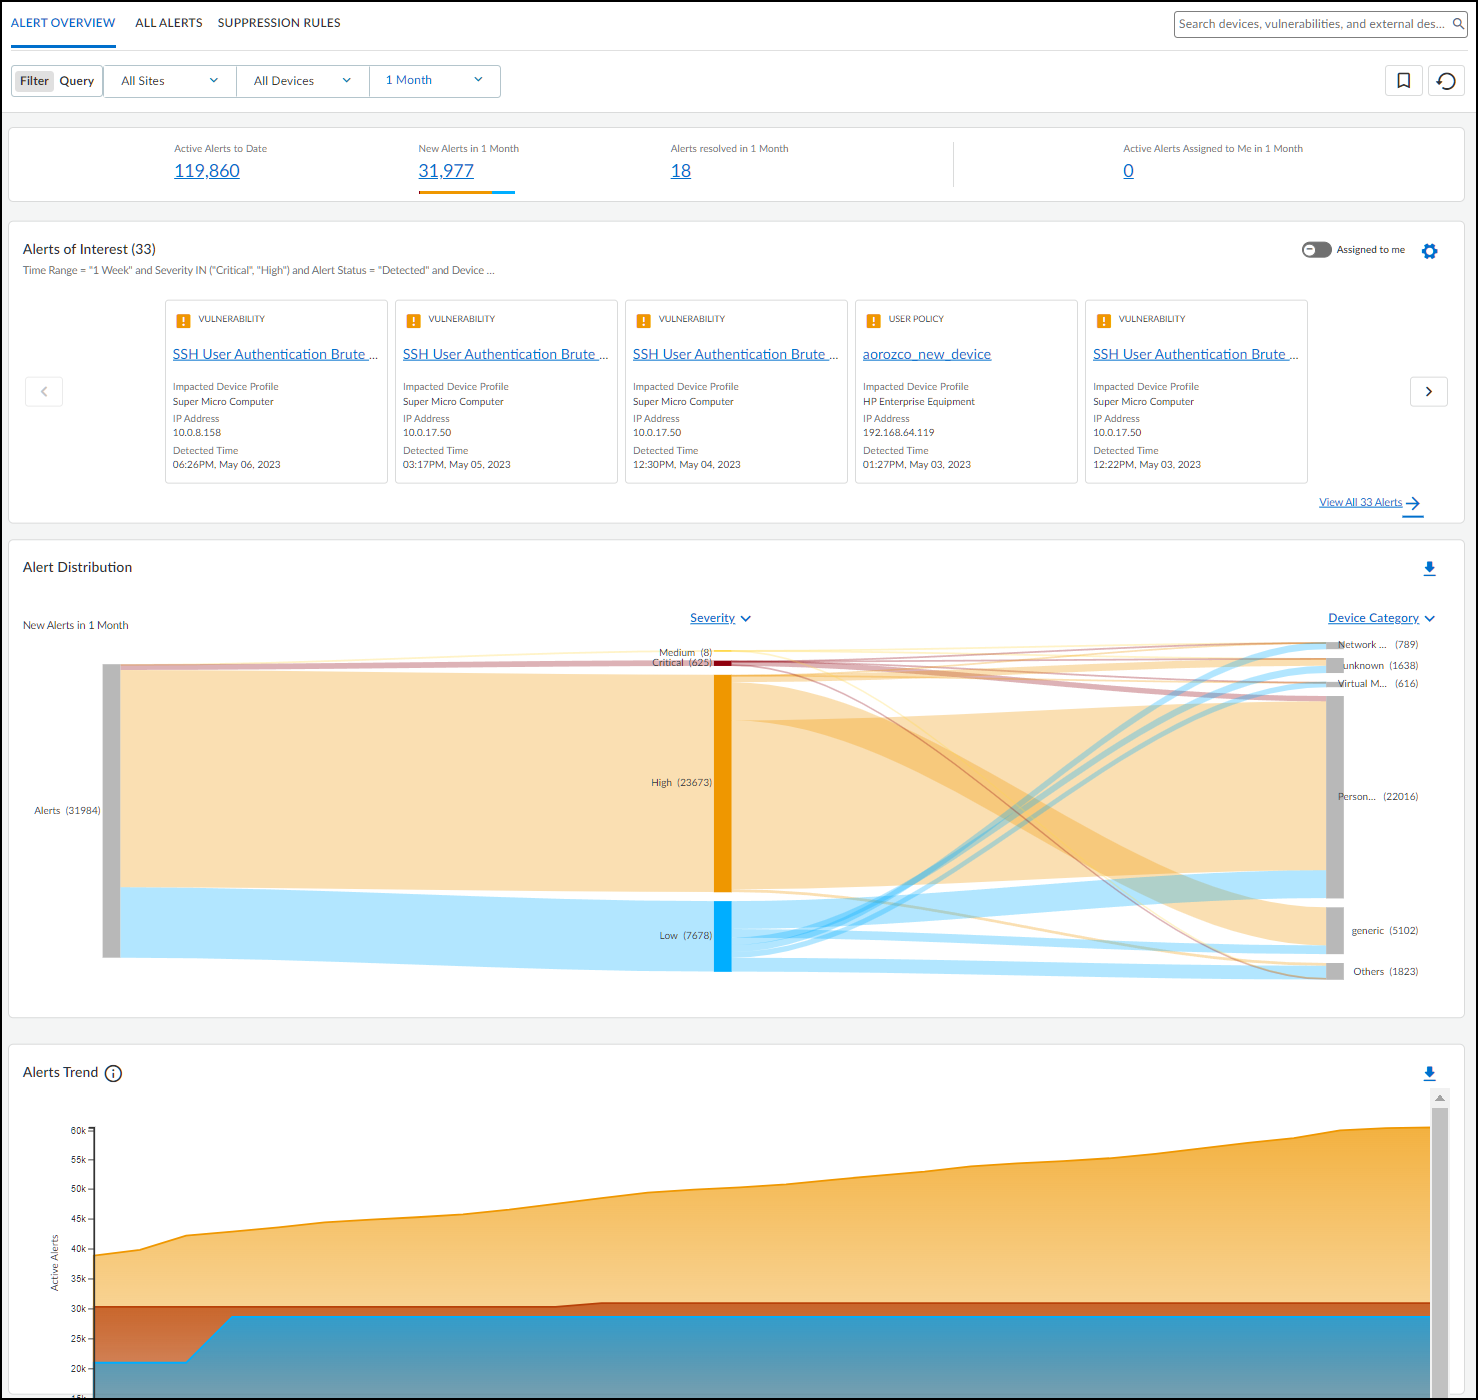
- Summary Statistics (Top): Filtered by Site, Device Category, Time Range. Shows totals for Active Alerts to Date (status != Resolved), New Alerts, Resolved Alerts, and Active Alerts Assigned to Me within the time range.
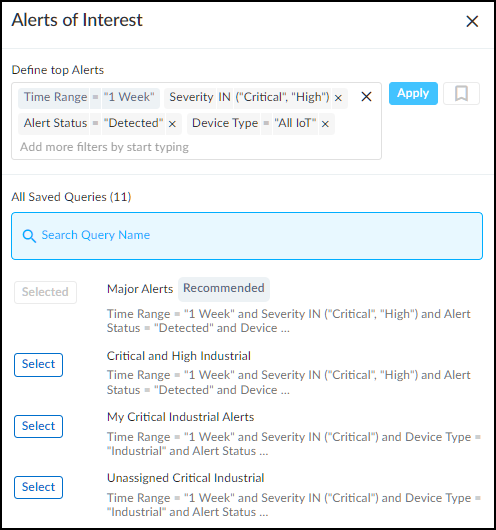
-
Alerts of Interest:
Customizable query (default: "Major Alerts" - Critical/High severity in past week) showing the top 10 matching alerts based on severity and recency. Use gear icon (
) to configure. Toggle "Assigned to me" view.
- Alert Distribution (Sankey Chart): Visualizes active alerts across different groupings (Severity, Profile, Category, Vendor, Status, Type). Hover/click for details. Downloadable as XLSX.
- Alert Trend: Line chart showing cumulative active alerts and daily resolved alerts over the selected time period. View by Severity. Downloadable as XLSX.
All Alerts Page Details:
Located at Alerts > Security Alerts > All Alerts .
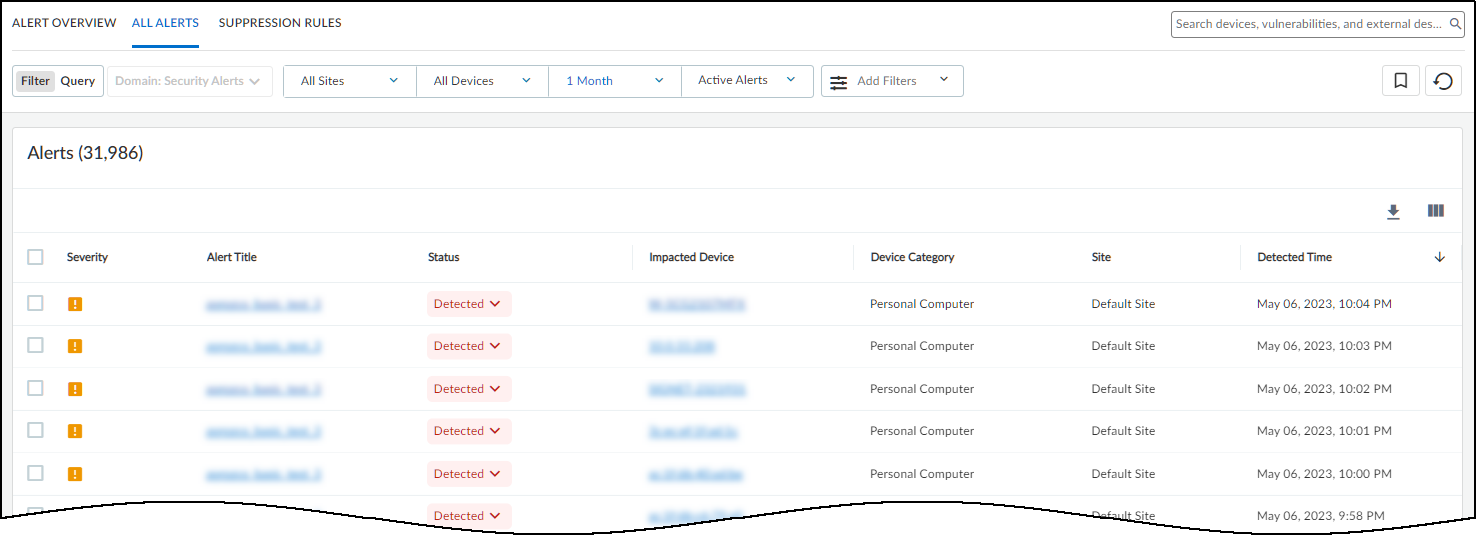
- Displays all alert instances, filterable by site, category, time, status (Detected, Investigating, Remediating, Resolved, Active, Assigned, Unassigned, All).
-
Actions on Selected Alerts:
- Change Status: Click status dropdown (Detected -> Investigating -> Remediating -> Resolved). Resolving prompts for reason.
- Assign: More > Assign. Enter username/email (assignee needs IoT Security account). Sends notification.
- Copy Alert Information: More > Copy Alert Information. Select details, add notes, copy text for manual work order creation in external systems. Optionally paste work order number back.
- Add Notes: More > Add notes. Track investigation progress. View history by hovering over "Last Action" column.
- Resolve/Unresolve: Mark alerts as addressed or reactivate resolved alerts.
- Suppress Alerts: More > Suppress Alerts. Prevent future alerts of this type for specific devices or based on rules (see Suppression Rules).
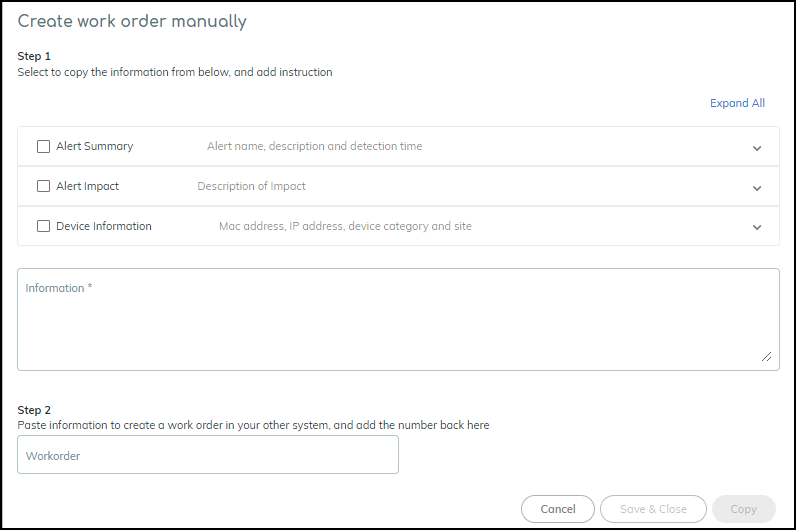
Copying alert details for external systems. - Clicking an alert name opens the Alert Details page.
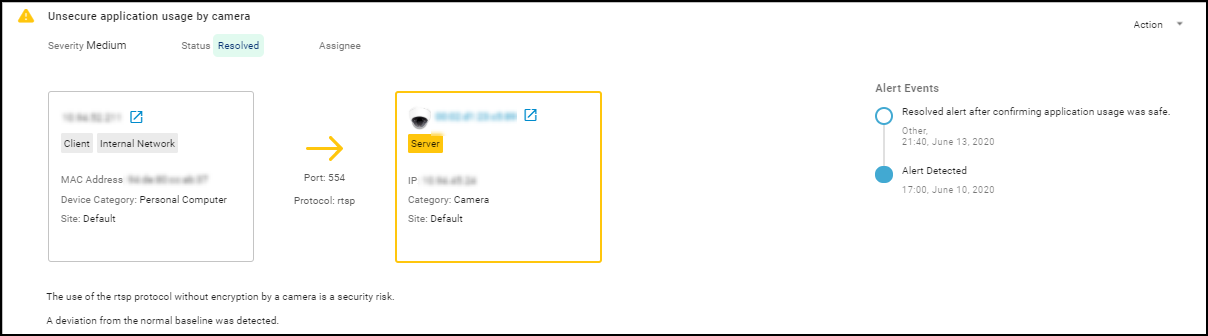
Security Alert Details Page:
Accessed by clicking an alert name.
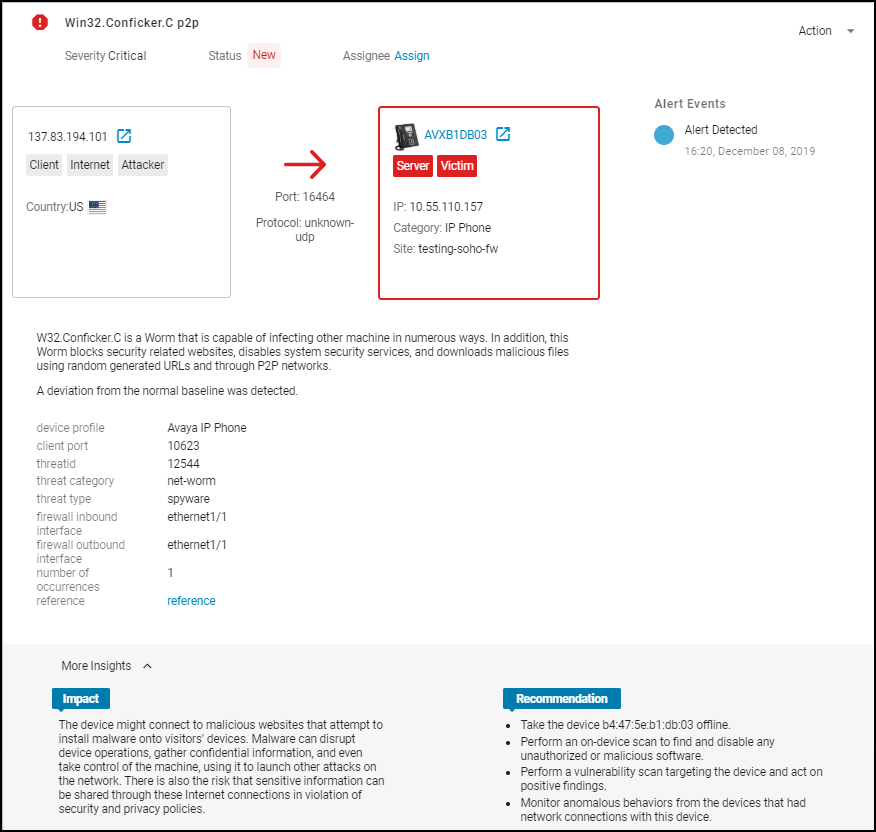
- Top Section: Shows client/server interaction, protocol, identifies the device raising the alert (boxed, color-coded by severity). Includes reference links (e.g., to KB articles).
- Impact & Recommendation: Explains the potential security impact and suggests remediation steps.
- Impacted Device Summary: Shows identity, location, activity, risk score, and behavior diagram for the device that triggered the alert.
- Network Traffic Snapshot (Sankey Diagram): Visualizes the impacted device's connections, applications used, and destinations around the time of the alert. Red lines indicate traffic involved in the alert.
Create Alert Rules
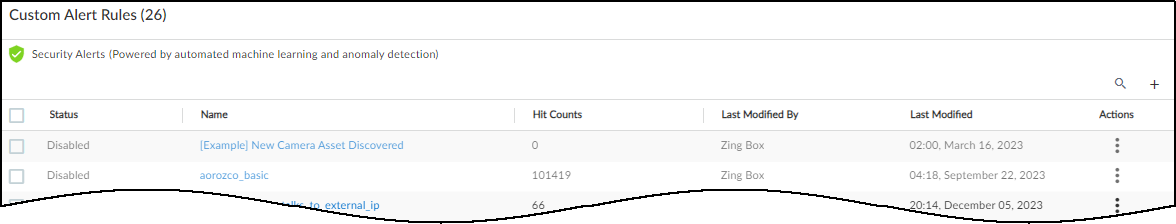
While IoT Security provides extensive automatic alerting based on ML and known threats, you can create custom rules (at Alerts > Custom Alert Rules ) to trigger alerts or actions based on specific network events or traffic patterns relevant to your environment.
Remark: Rules are triggered only once per day per device for a matching condition to avoid excessive noise.
Rule Components:
-
Basic Information:
- Rule Name: Unique identifier.
- Description: (Optional) Purpose of the rule.
- Apply rule during: Time schedule (default: always).
- Status: Active or Disabled.
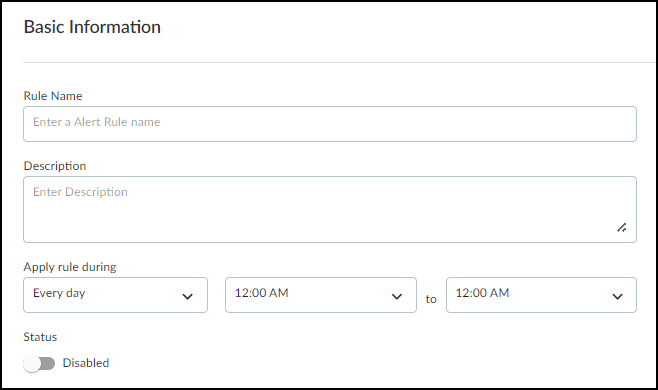
Defining basic rule information. -
Rule Details (Criteria):
Defines the "WHEN" condition.
- Logic: All(AND) / ANY(OR) for multiple conditions.
-
Condition Type:
- Traffic Pattern: Based on communication between devices. Define Source Target Devices (using attributes like IP, name, profile, category, tag, location, etc.) and optionally Destination Target Devices ('Any' if blank). Can add Extra Criteria for Traffic Volume (e.g., > 10MB in 1 hour) or App Usage (specific app, command, parameter, value).
- Change Event: Based on device state changes. Define Target Devices and select the Event (IP Change, New Device Discovery, New Vulnerability Discovery, Offline Device, Purdue Level Change, Risk Level Change, Subnet Change).
- Add Condition Set: Create nested subgroups of conditions with their own AND/OR logic.
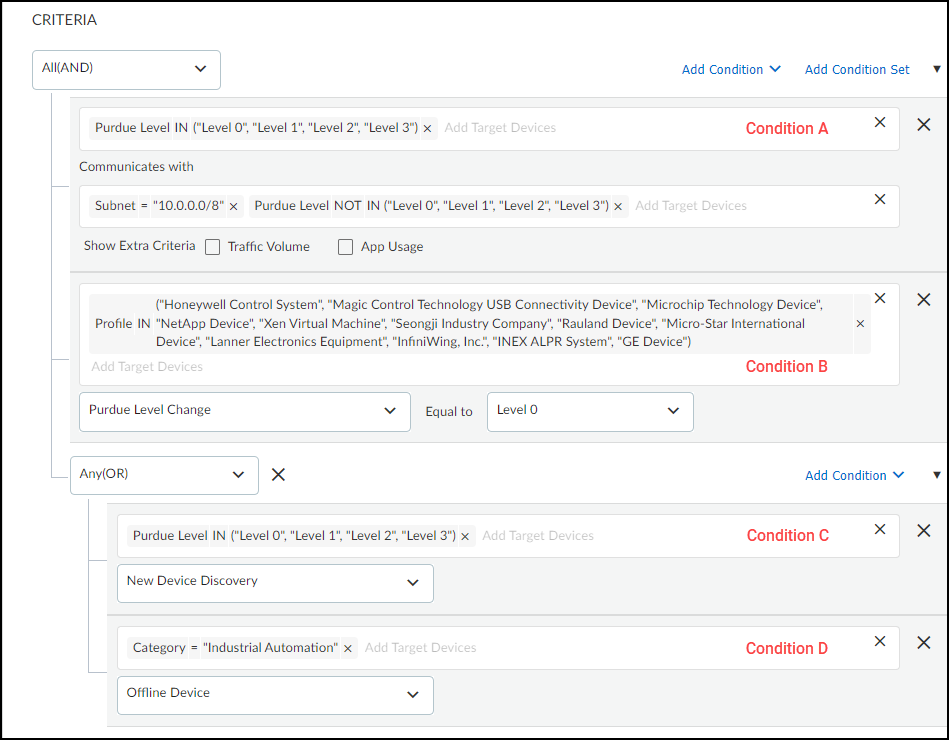
Example of complex rule criteria. -
Rule Action:
Defines the "DO" action(s) taken when criteria are met.
-
Generate alert:
Creates a security alert (specify severity). Can optionally also:
- Send to third-party systems: Trigger external integrations (e.g., NAC quarantine, ticketing).
- Assign to Users: Notify specific users to investigate.
- Notify users: Send email/SMS notifications (users configure preferences).
- Restrict network access: Signal firewall to apply a "Restricted" category via Device-ID, triggering a pre-configured 'Deny' policy rule (see Restrict Network Access section).
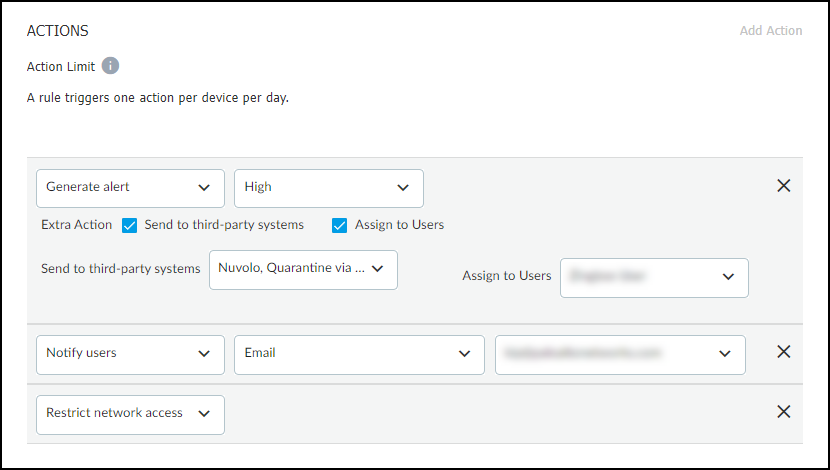
Configuring actions for a custom rule. -
Generate alert:
Creates a security alert (specify severity). Can optionally also:
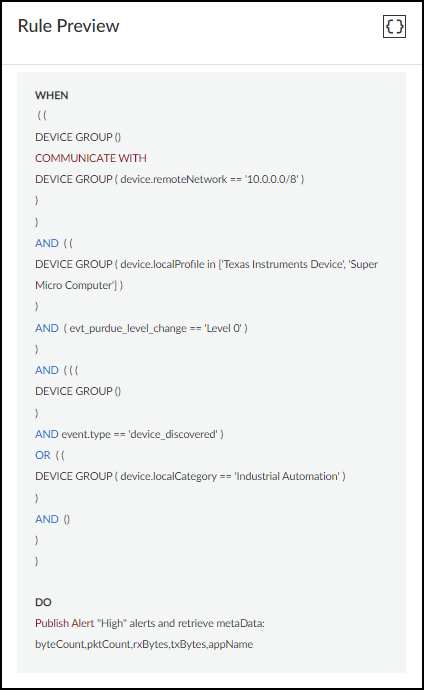
- Rule Preview: Shows a summary of the rule logic.
IoT Security provides pre-configured example templates (disabled by default) for common scenarios across different verticals (Enterprise, Industrial, Medical) which can be enabled, edited, or used as models.
Act on Security Alerts
Responding to security alerts involves confirming the event, assessing importance, identifying the impacted asset, deciding on the response, and engaging the appropriate team (IT security, clinical engineering, vendor, etc.).
Response Actions:
- Immediate Isolation: Unplug infected/compromised devices. If use is critical, quarantine using firewall rules (Zero Trust) allowing only essential traffic.
- Patching: Apply vendor-supplied patches. May require vendor involvement. Maintain quarantine/Zero Trust if patching is delayed.
- Policy Enforcement: Use IoT Security's policy recommendations to create firewall rules allowing only normal behavior.
- Analysis Aids: Download alert logs (.csv, .log) or network traffic data (.xls) for deeper investigation.
Workflow Management within IoT Security:
- Assign/Track: Assign alerts to users for investigation via the All Alerts or Alert Details pages (More > Assign or Action > Assign). Assignee receives email notification (external users get a PDF).
- Add Notes: Track progress and communication using More > Add notes on the All Alerts page or Action > Add Notes on the Alert Details page. Notes appear in the Alert Events history.
- Resolve/Reactivate: Mark alerts as Resolved (mitigated or accepted risk) via the status dropdown or Resolve button. This removes the alert's contribution to risk scores. Reactivate by filtering for Resolved alerts and clicking Unresolve.
-
Suppress Alerts:
Prevent future alerts of the same type for specific devices or groups.
- Go to Alerts > Security Alerts > All Alerts .
- Select alert(s) of the *same type*.
- Click More > Suppress Alerts .
- Option 1: Suppress for selected device(s) only. Add comment, optionally resolve current alert, click Save.
- Option 2: Create/Modify Suppression Rule. Expand "Suppression Rule", define scope (Tag, Category, Profile, Device Type), set duration (or indefinite), add comment, optionally resolve current alert, click Save.
- Manage suppression rules at Alerts > Security Alerts > Suppression Rules . Remark: Rules take ~30 mins to apply system-wide.
- Release suppression by selecting rule(s) and clicking Release Suppression.
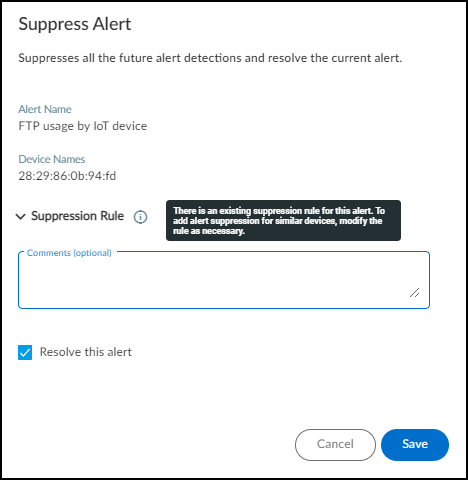
Configuring a suppression rule. -
Suppress Scanner Alerts:
- If integrated with Qualys/Rapid7/Tenable via XSOAR, scanners can be auto-imported ( Settings > Scanners ) and alerts suppressed. Disable auto-sync in XSOAR jobs if needed.
- For non-integrated scanners, upload a CSV of scanner IP addresses (and optional MAC/comment) via Settings > Scanners > Add Scanners . IoT Security will suppress alerts from listed IPs after matching them to inventory devices ( takes ~1 hour ).
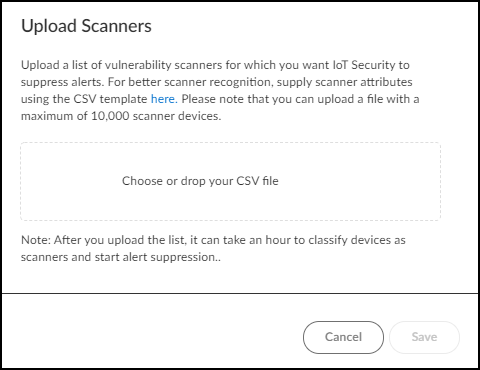
Uploading a list of vulnerability scanners. 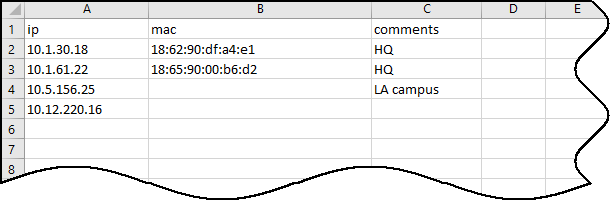
Scanner list CSV template format.
Routine Alert Management:
- Monitor notes/status changes for tracked alerts.
- Review low-severity alerts daily/regularly; resolve acceptable ones.
- Download alert reports weekly/monthly for status tracking.
- Proactively review vulnerabilities ( Dashboards > Security Dashboard > Risk panel > Active Vulnerabilities link or Vulnerabilities > All Vulnerabilities page, sorted by severity) and address them before exploitation.
Policy Rule Recommendations
Important: Workflow described applies to firewalls running PAN-OS versions prior to 11.1. A different process exists for PAN-OS 11.1+ involving direct Device-ID configuration.
IoT Security uses machine learning to analyze the normal network behavior of high-confidence IoT devices within a specific profile (across your environment and globally) and recommends firewall Security policy rules to allow only that trusted behavior.
Process Overview:
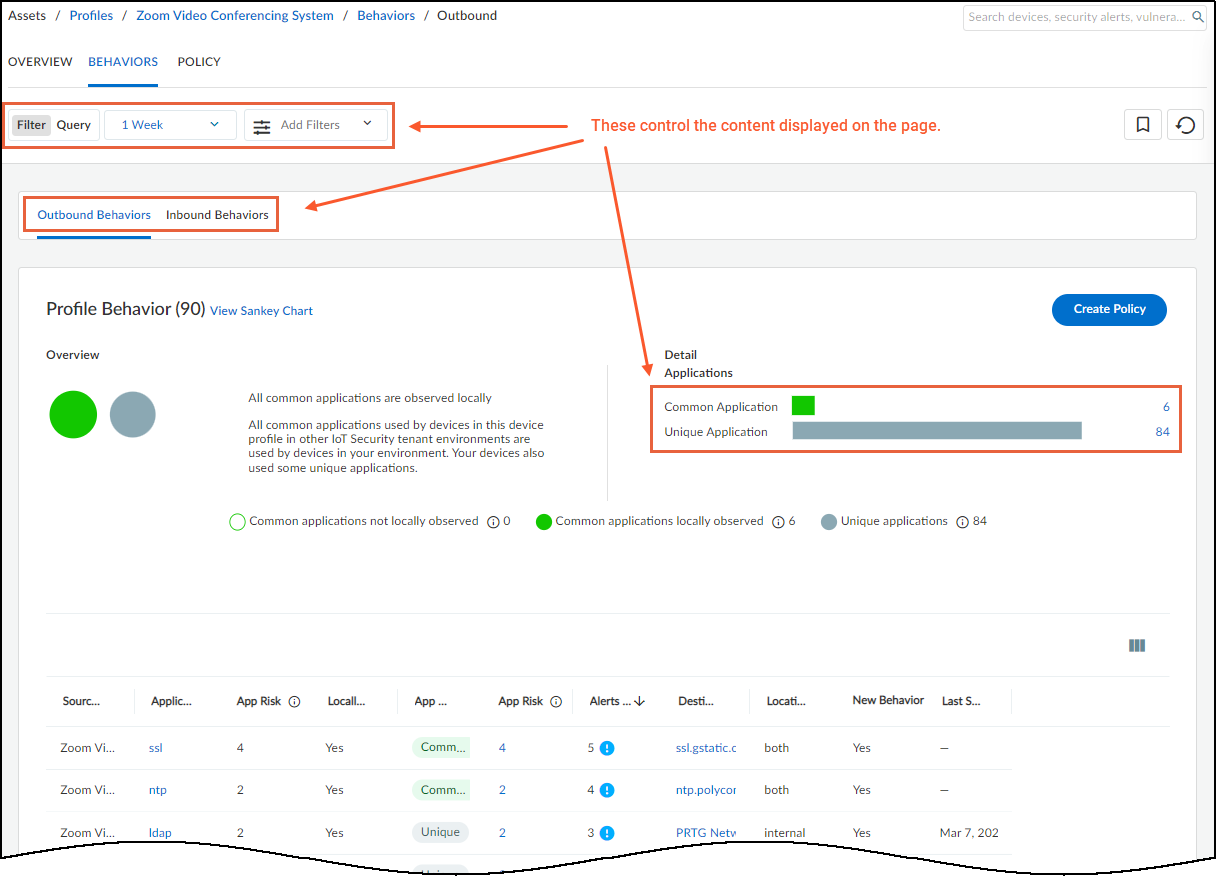
- Observe Behavior: IoT Security learns common and unique applications/destinations for a device profile.
- Generate Recommendations: Based on observed behavior, IoT Security suggests allow rules.
- Customize & Create Set: You review, modify (allow/deny specific apps/destinations, add tags/zones/services), condense, and save the recommendations as a Policy Set within IoT Security.
- Activate Set: Make the policy set available for firewalls/Panorama to import.
- Import to Firewall/Panorama: Administrator imports the active policy set. This automatically creates necessary device objects and policy rules.
- Enforce Policy: Firewall uses Device-ID (IP-to-device mappings provided by IoT Security) to apply the imported rules to the correct devices.
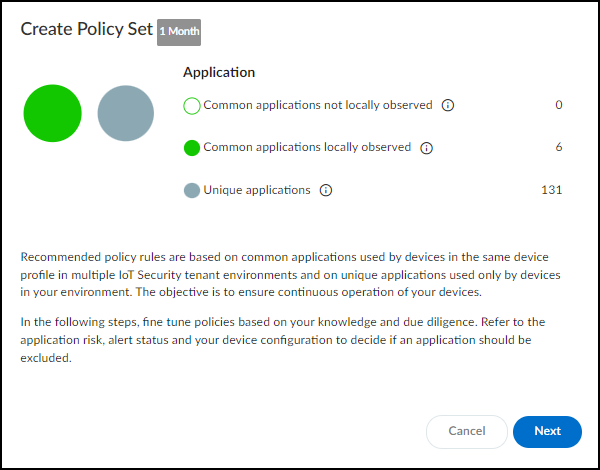
Creating a Policy Set:
- Navigate to Assets > Profiles , click a profile name, then go to the Behaviors tab.
- Ensure Outbound Behaviors is selected.
- Review the behaviors listed. Apply filters (time, app usage, etc.) as needed for review, but note these *do not* limit the rules generated initially (filtering happens during creation).
- Click Create Policy .
-
Follow the wizard:
- Intro: Click Next.
- Select Policies: Review auto-generated rules based on observed behaviors (common & unique apps from last month). Deselect any rules you don't want. Manually Add Rule if needed. Click destination 'Any' to restrict specific destinations.
- Configure Policy Set: Name the set, optionally condense rules (group apps sharing destinations/settings) , apply Tags, Security Profiles, Source/Destination Zones, Services to selected rules.
- Review Policy Set: Carefully check the final rules.
- Create: Saves the policy set.
Policy Creation Wizard - Introduction. 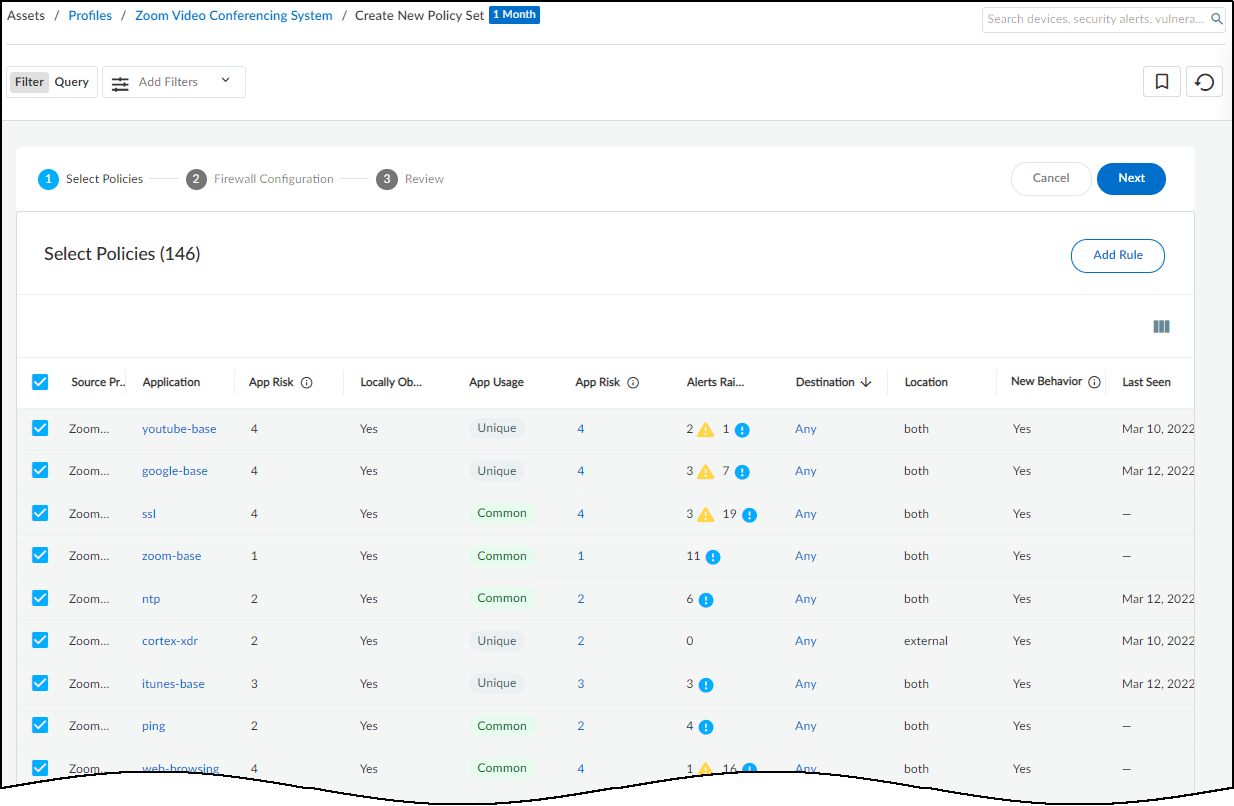
Policy Creation Wizard - Selecting Rules. 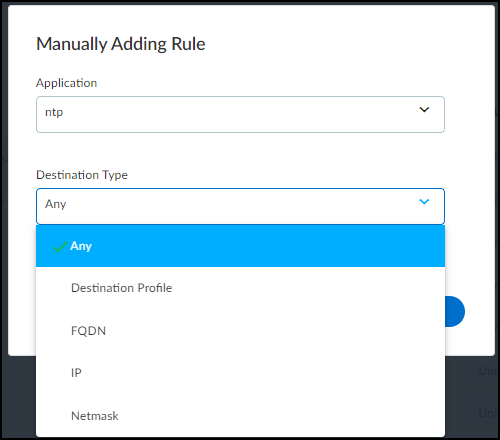
Manually Adding a Rule. 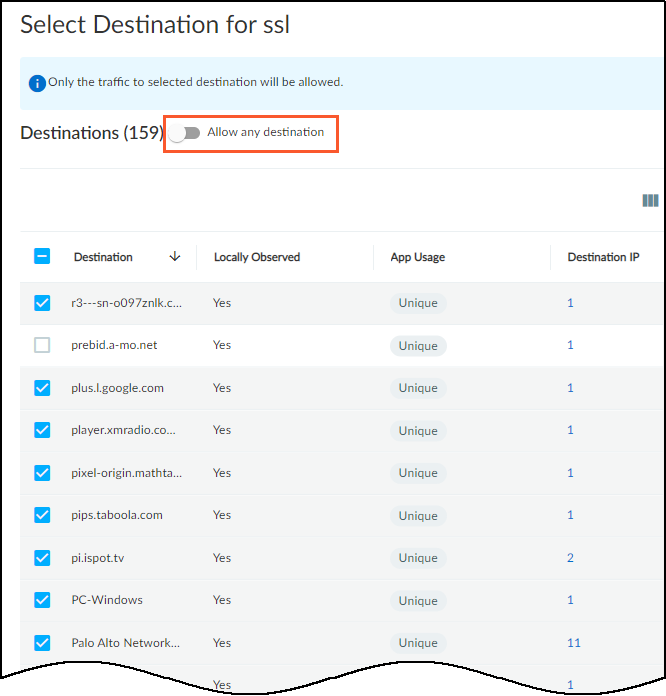
Editing Rule Destinations. 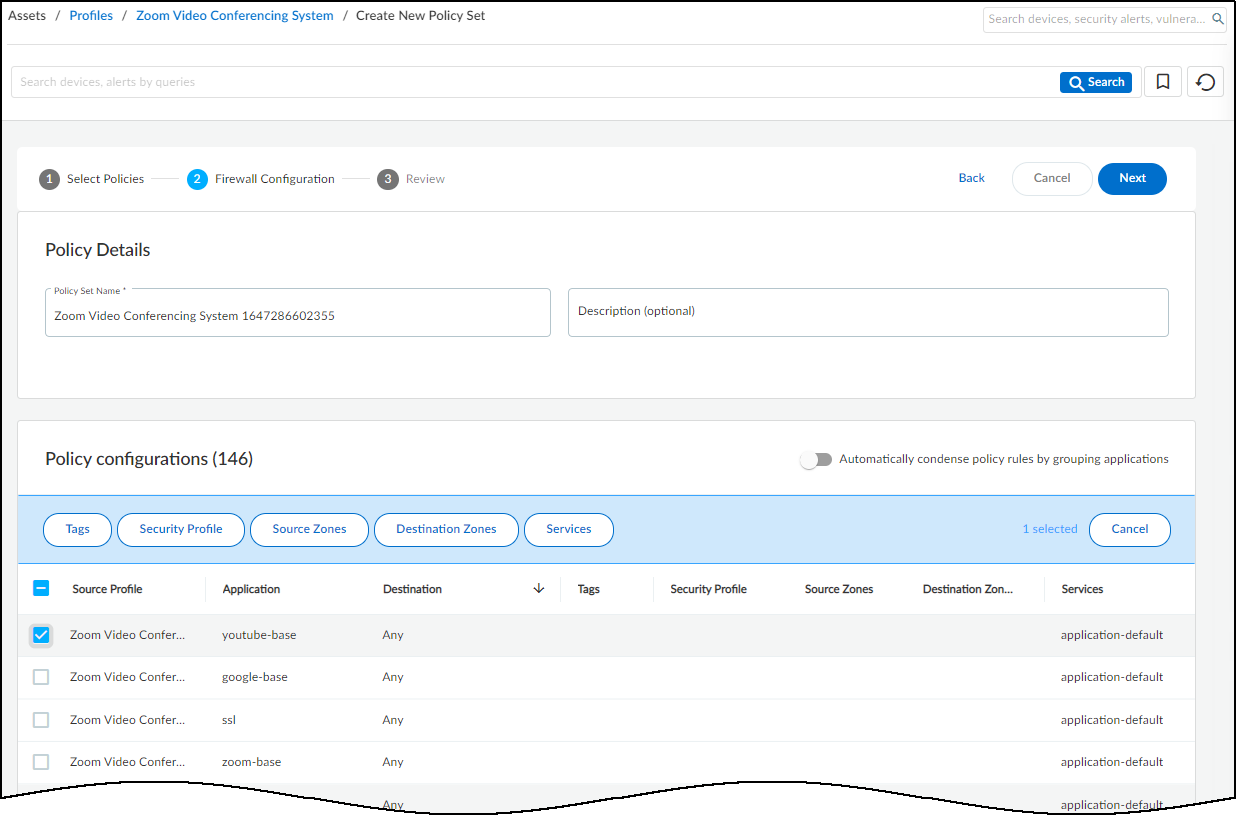
Policy Creation Wizard - Configuring Set Details. 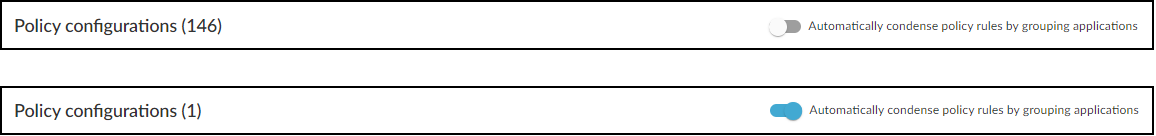
Condensing Policy Rules Option. 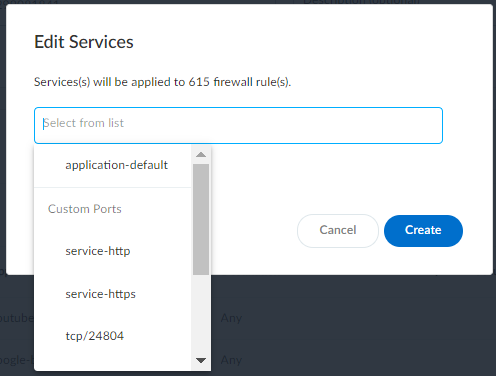
Editing Rule Services/Ports. 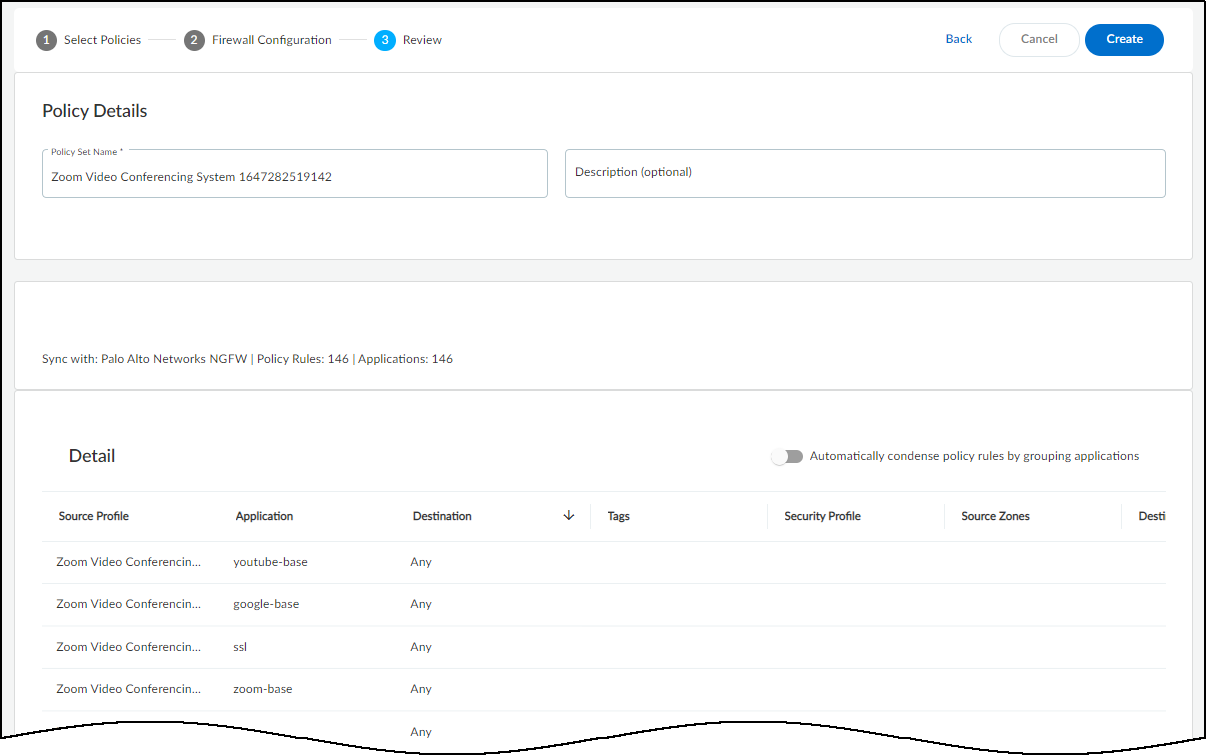
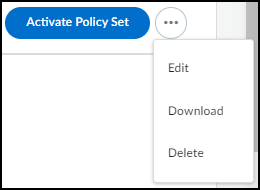
Policy Creation Wizard - Final Review. - Activate Policy Set: After creation, click Activate Policy Set to make it available for import by firewalls/Panorama. Important: Only one set per profile can be active. Edit/Download/Delete via '...' menu.
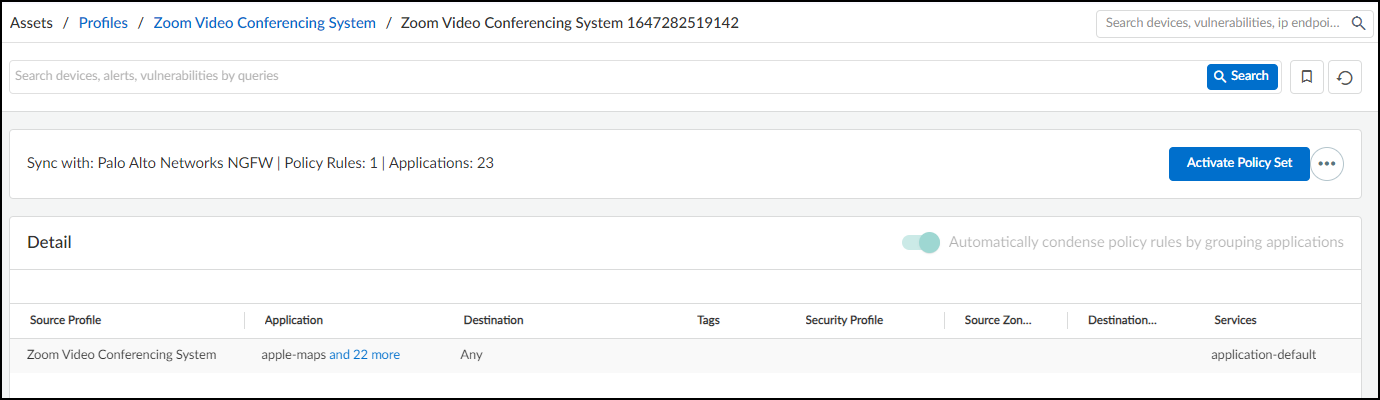
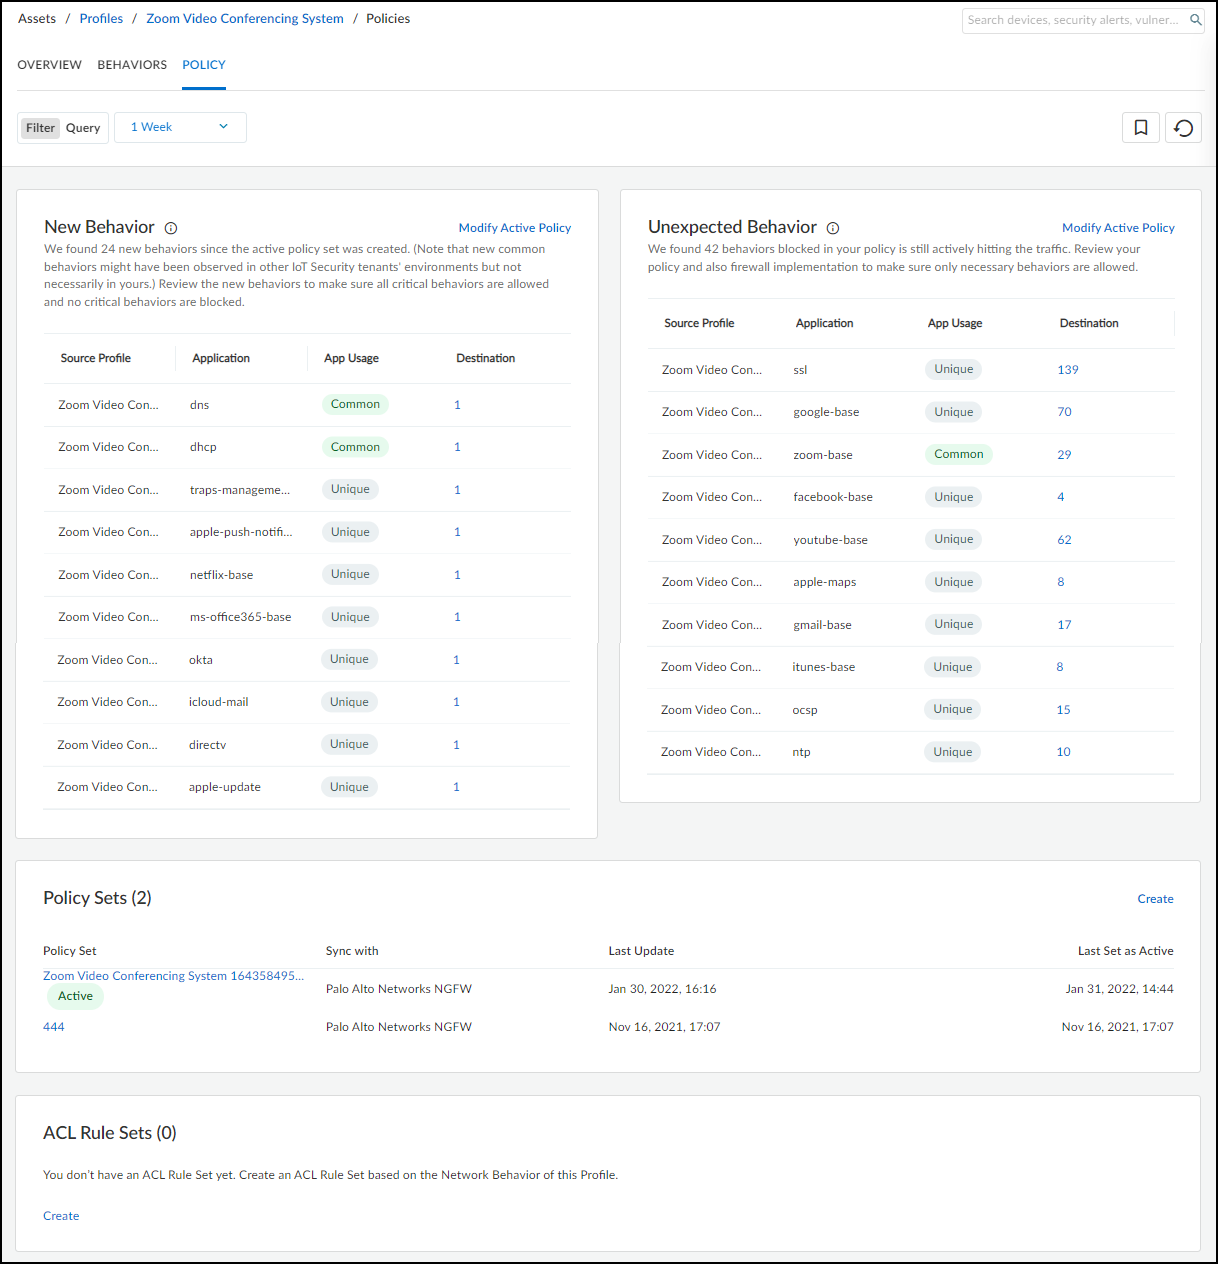
Viewing Policy Sets:
Created policy sets (active or inactive) are listed on the Assets > Profiles > *profile_name* > Policy tab.
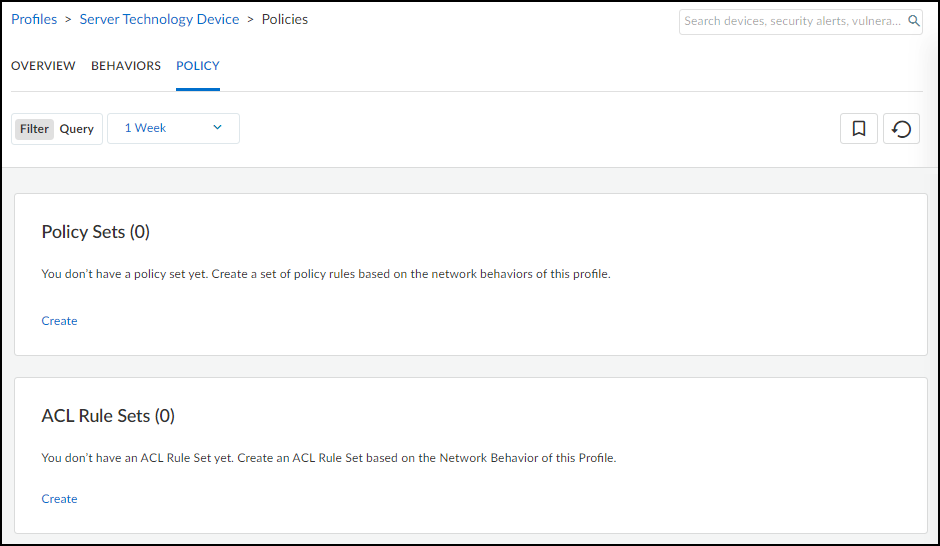
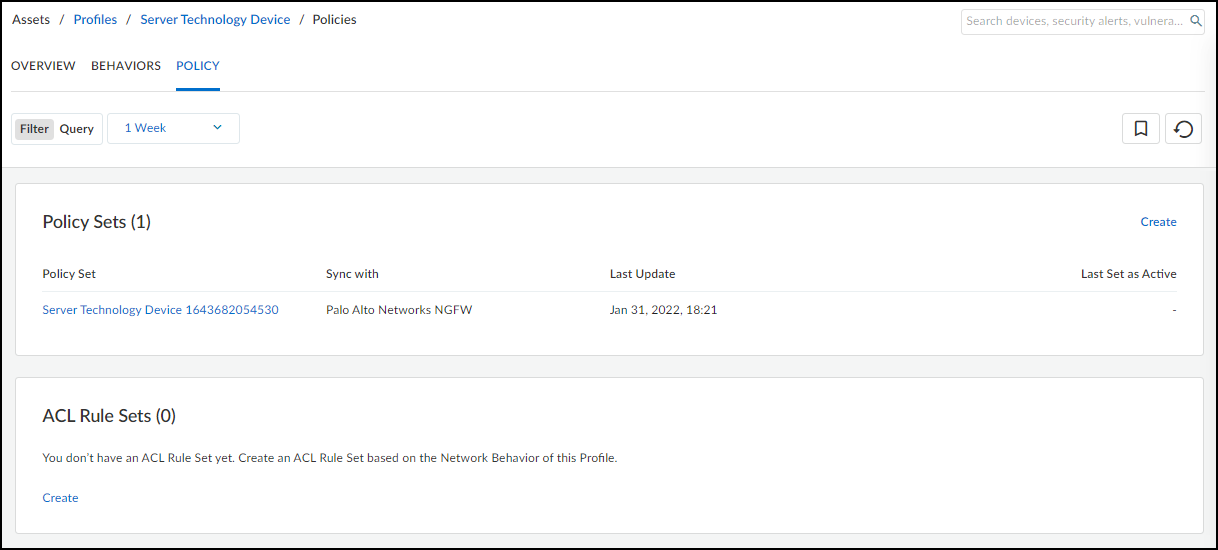
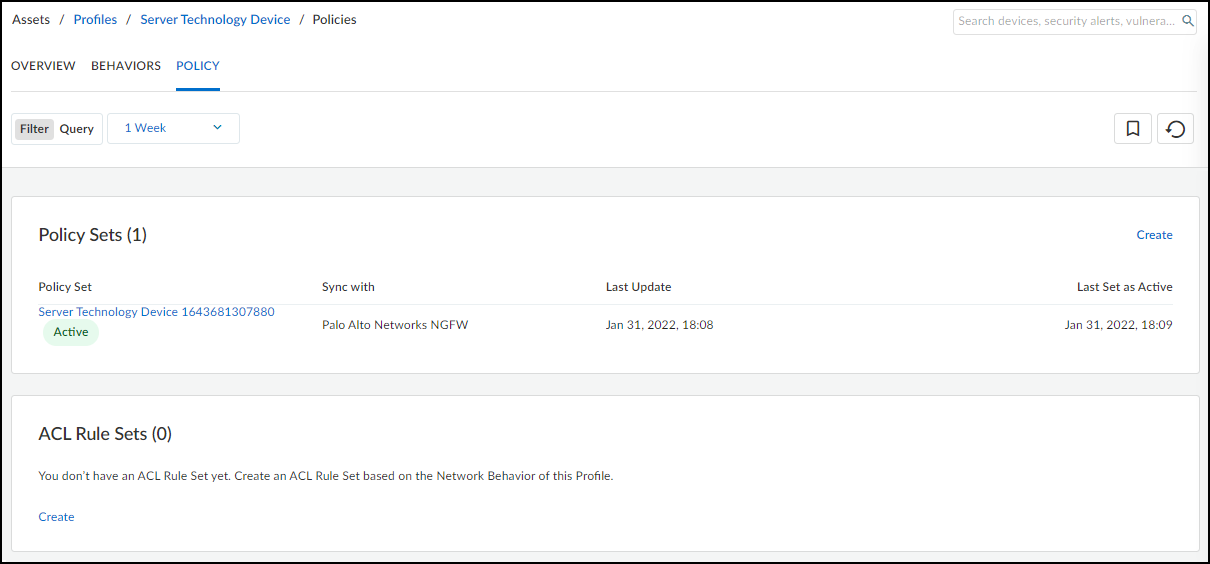
If new or unexpected behaviors are detected after a policy set is activated, they will be highlighted on this page, prompting review and potential update of the active policy set.
Importing into Panorama/Firewall (PAN-OS < 11.1):
- Log in to Panorama (or firewall UI).
- Navigate to Panorama > Policy Recommendation > IoT (or equivalent path on firewall). Panorama/firewall fetches active recommendations from IoT Security. Refresh if needed after activation in IoT Security.
- Click Import .
- Choose target rulebase (pre/post) and the rule *after* which to insert the imported rules (top if none selected). Important: Position recommended rules *above* any potentially conflicting existing rules.
- Click OK . Objects (device, service, address) and rules are created automatically.
- Assign Log Forwarding profiles manually or ensure a profile named "default" exists for automatic application.
- Commit the configuration.
Restrict Network Access
Beyond behavior-based rules, IoT Security allows explicitly restricting network access for specific high-risk devices (e.g., running EoL OS, suspected compromise) *before* behavior changes or exploits occur. This uses Device-ID categories .
Mechanism:
-
Create Firewall Rule:
On the firewall/Panorama, create a Security policy rule placed
high in the rulebase
:
- Source Device: Category = "Restricted" (Create this device object if needed).
- Source Zone/Address: Any.
- Destination Zone/Address/Device: Any.
- Action: Deny .
- Logging: Enable logging and assign a log forwarding profile to see blocked attempts.
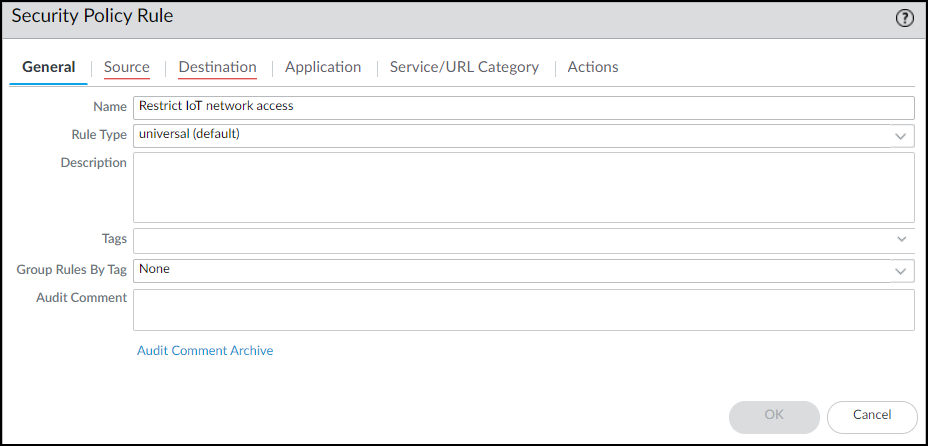
PAN-OS: Restrict Rule - General Tab. 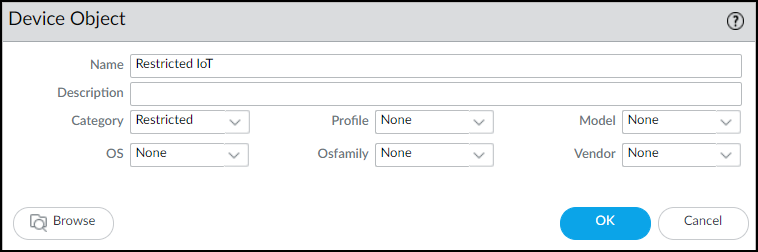
PAN-OS: Creating the 'Restricted' Category Device Object. 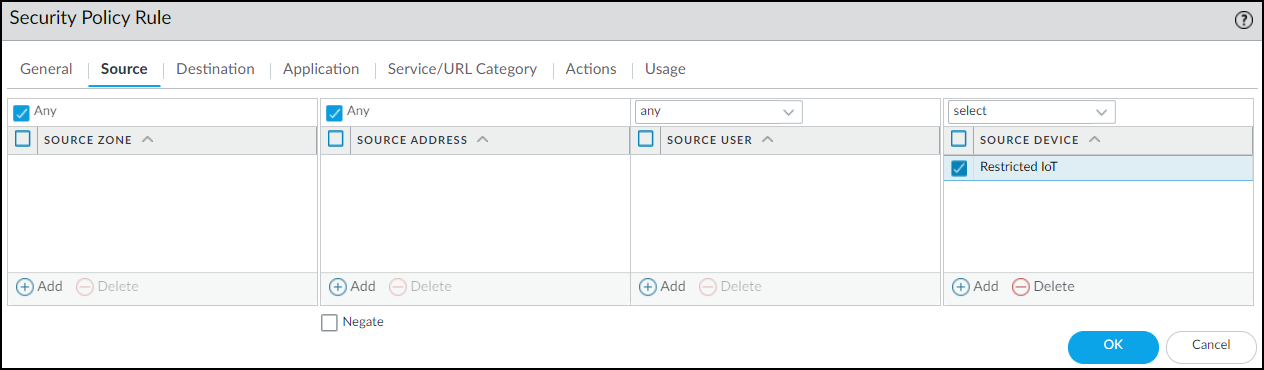
PAN-OS: Restrict Rule - Source Tab. 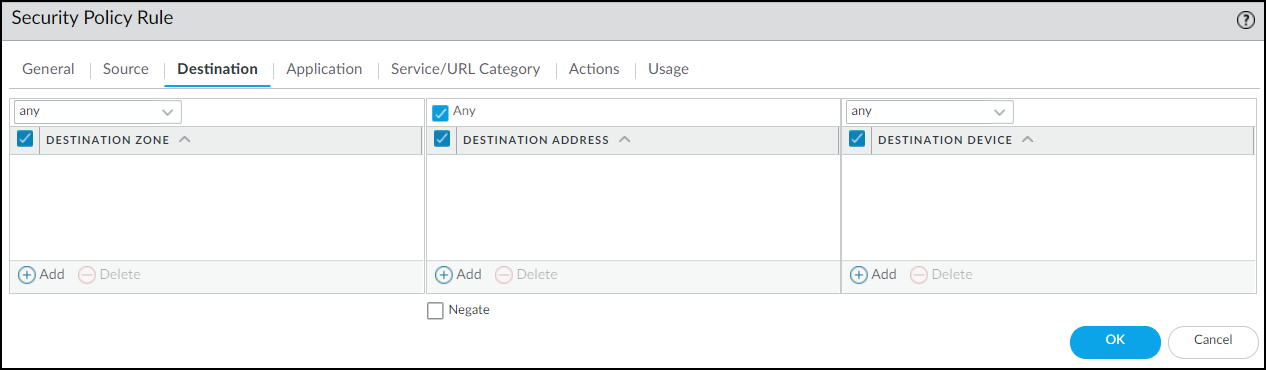
PAN-OS: Restrict Rule - Destination Tab. 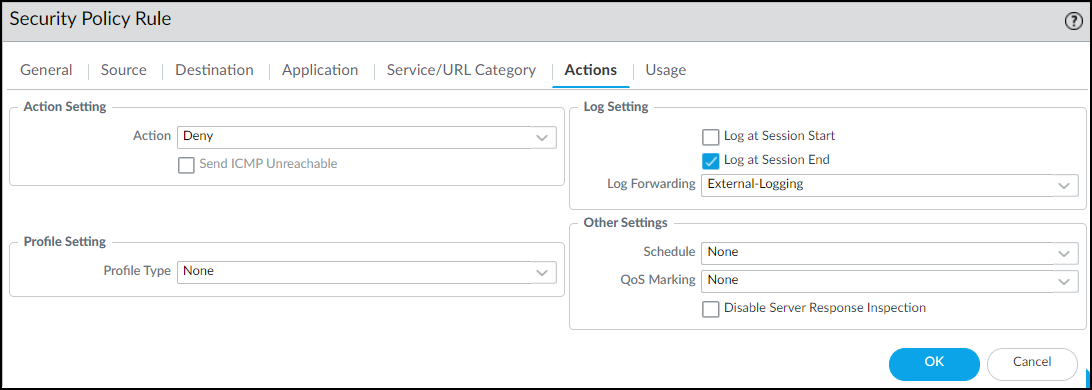
PAN-OS: Restrict Rule - Actions Tab. 
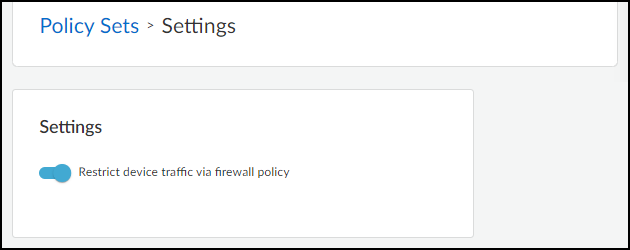
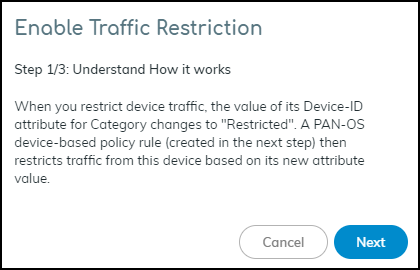
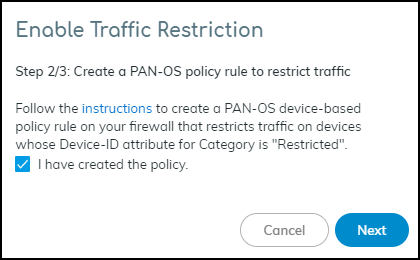
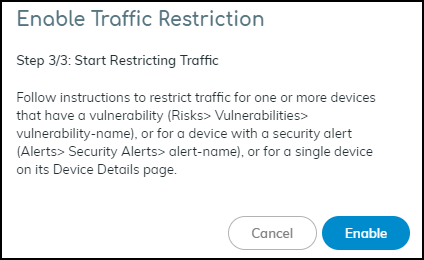
PAN-OS: Positioning the Restrict Rule. - Enable Feature in IoT Security ( Owner Role ): Go to Policy Sets > Settings > Toggle ON "Restrict device traffic via firewall policy". Follow prompts confirming the firewall rule exists.
-
Restrict Device(s) (
Admin/Owner Role
):
- From Vulnerability Details: Select instance(s) > More > Restrict Traffic.
- From Alert Details: Action > Restrict Traffic.
- From Device Details: Action Menu (...) > Restrict Traffic.
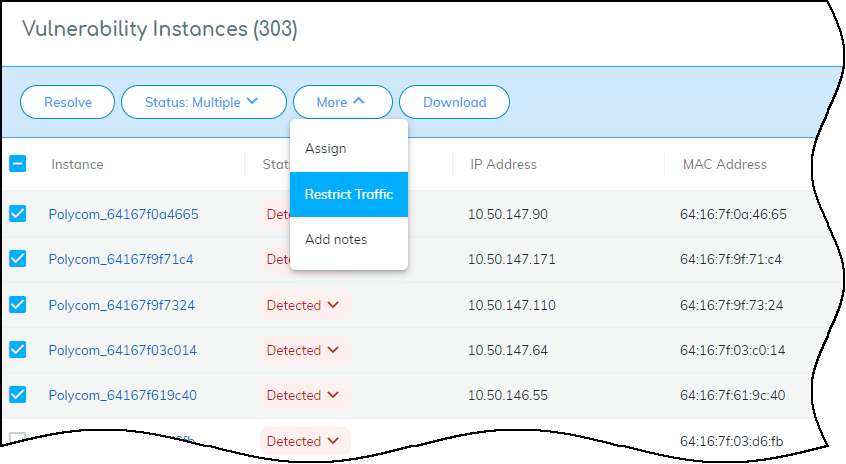
Restricting via Vulnerability Details. 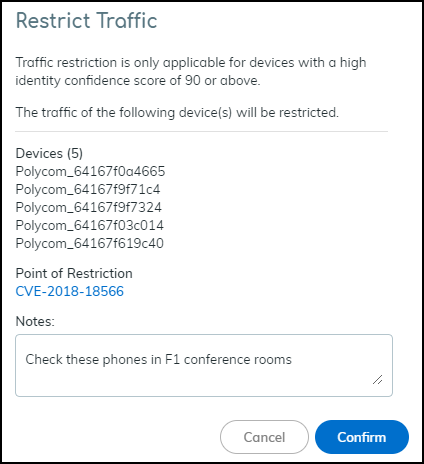
Confirming Traffic Restriction. 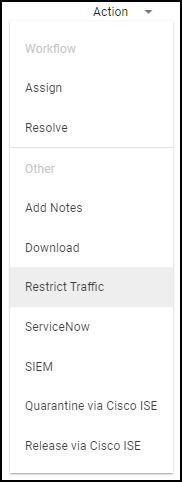
Restricting via Alert Details. 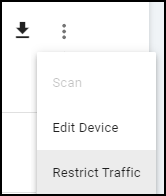
Restricting via Device Details. IoT Security immediately updates the IP-to-device mapping for the selected device(s), changing their Category attribute to "Restricted". The firewall receives this update and applies the Deny rule.
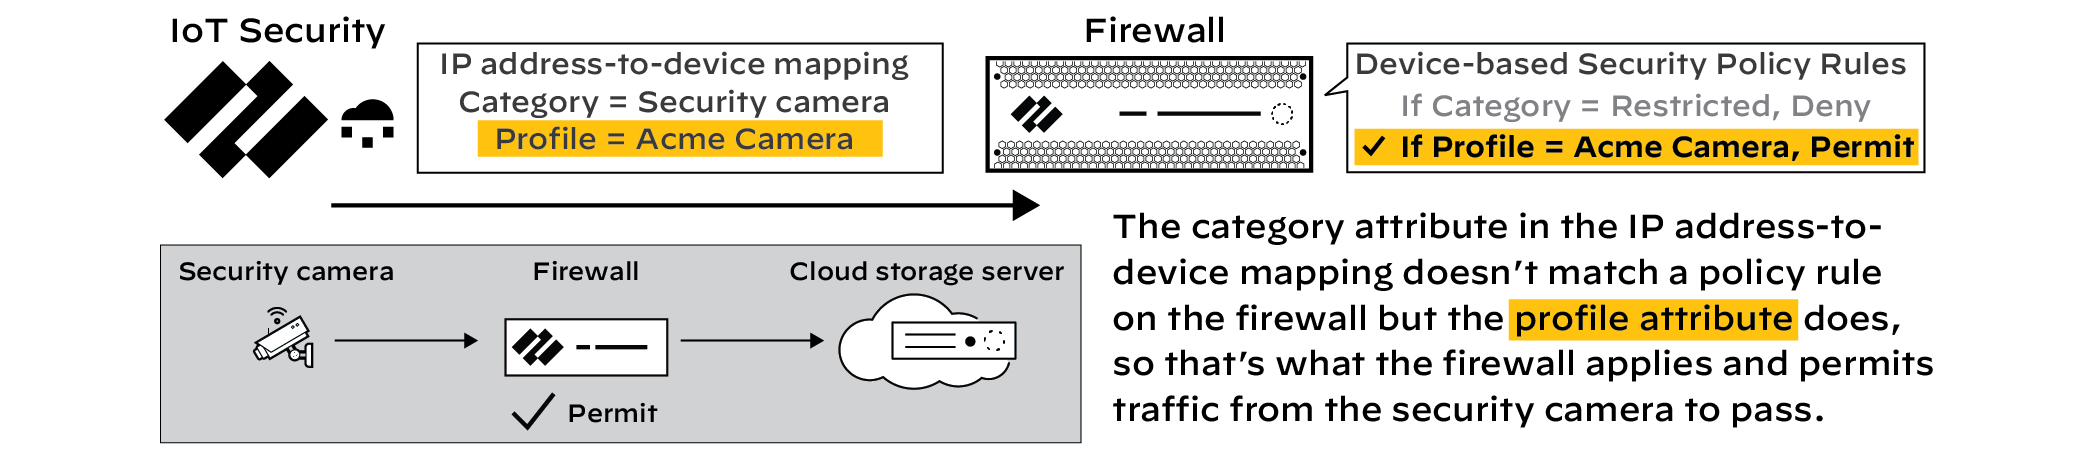
Normal Traffic Flow (Before Restriction). 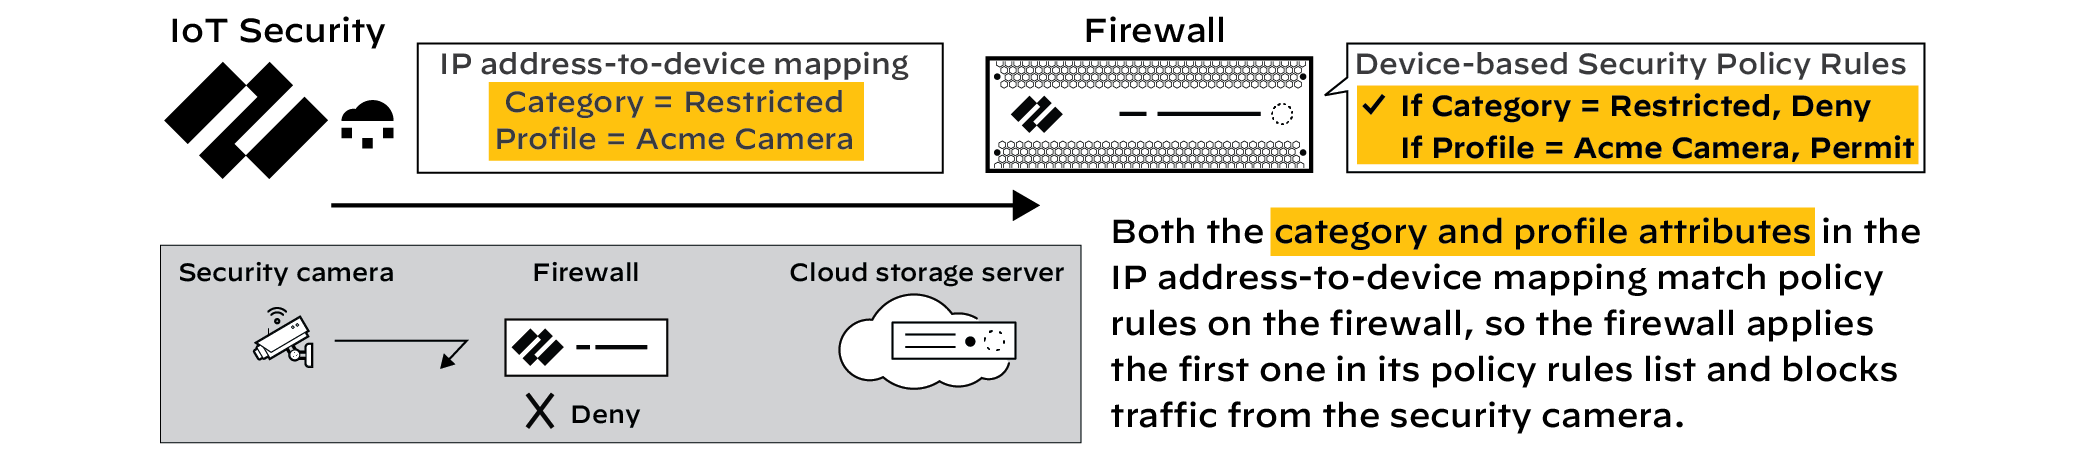
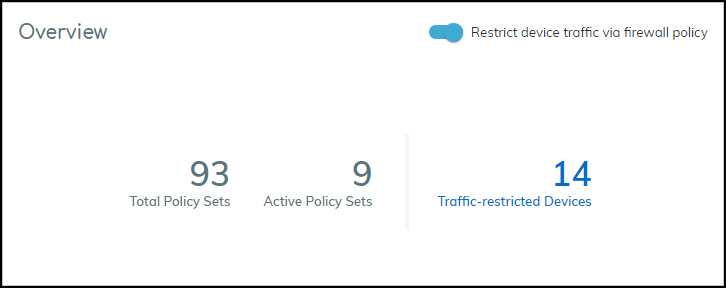
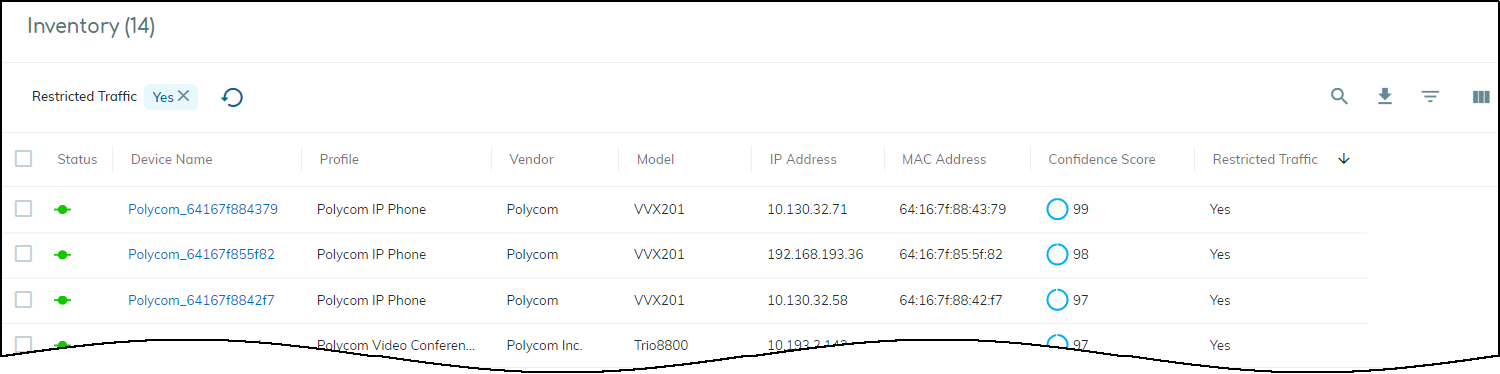
Traffic Flow Blocked (After Restriction). - View Restricted Devices: Go to Policy Sets > Overview panel > Click the number link for "Restricted Devices". This opens the Devices page filtered for 'Restricted Traffic = Yes'. The Device Details page also shows a "Restricted Device" label.
- Derestrict Device(s): After remediation, use the same interface points (Vulnerability Details, Alert Details, Device Details) and select "Derestrict Traffic". IoT Security reverts the category mapping, allowing normal policy rules to apply again.
- Disable Feature (Owner Role): Toggle OFF "Restrict device traffic via firewall policy" on Policy Sets > Settings. Gotcha! This derestricts *all* currently restricted devices.
Notes: Requires PAN-OS 10.0+ and Device Dictionary 16-253+. Applies only to high-confidence devices (score >= 90). Restriction occurs at the firewall; devices might still access resources within their local L2 segment.
Medical IoT Features
Important: Requires IoT Security Medical subscription and Medical IoT Security portal theme.
IoT Security offers specialized features for healthcare environments focused on medical device utilization, safety, and compliance.
Key Features:
- Biomed Dashboard: High-level overview of medical device inventory, status, risk levels, top categories, utilization summary, and compliance risks (EoL OS, endpoint protection status, PHI presence, FDA recalls).
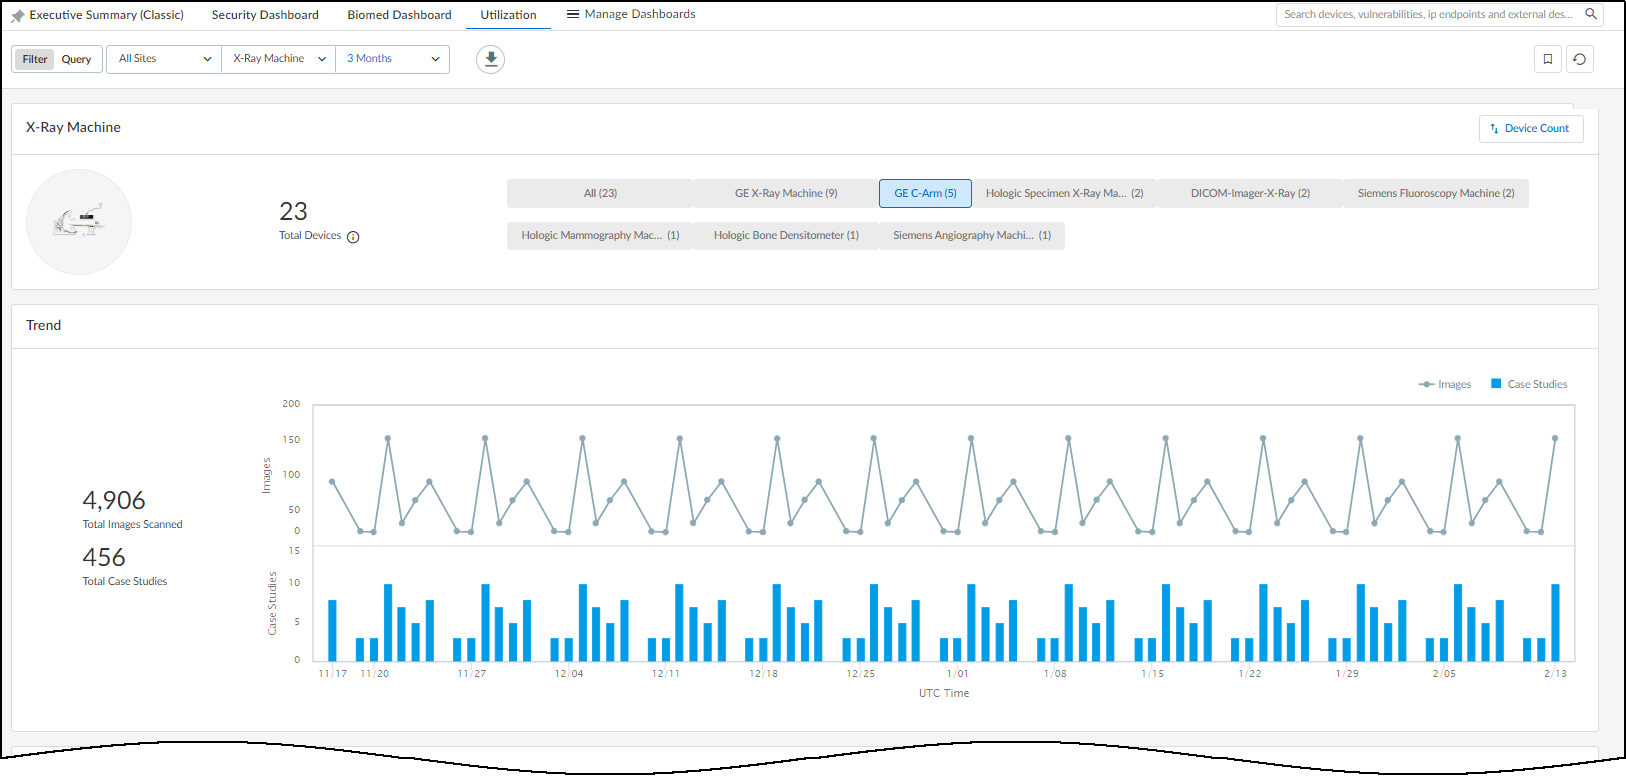
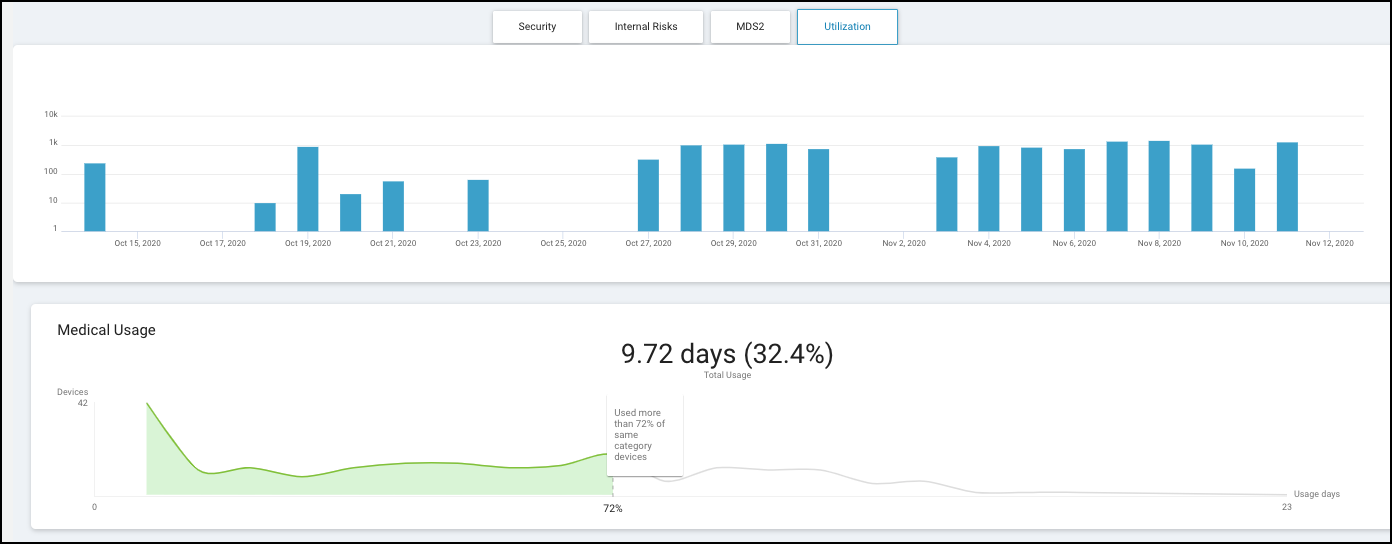
- Utilization Dashboard: Detailed metrics on how specific categories of medical imaging devices (CT, MRI, X-Ray, etc.) and infusion systems are used over time (images/cases, active use vs. online, scan analysis by body part, usage by site).
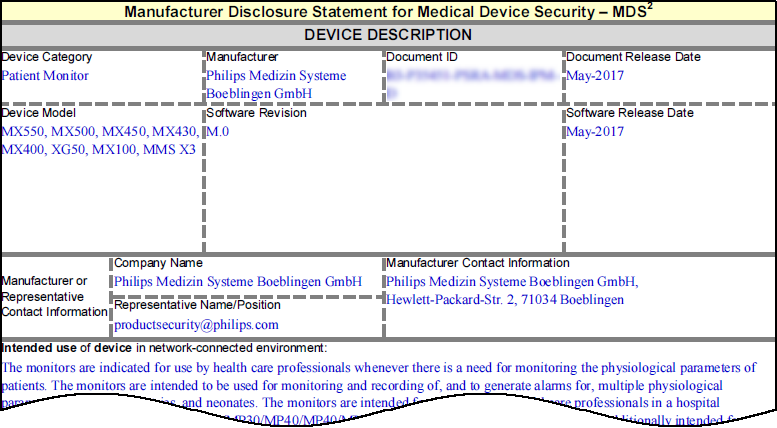
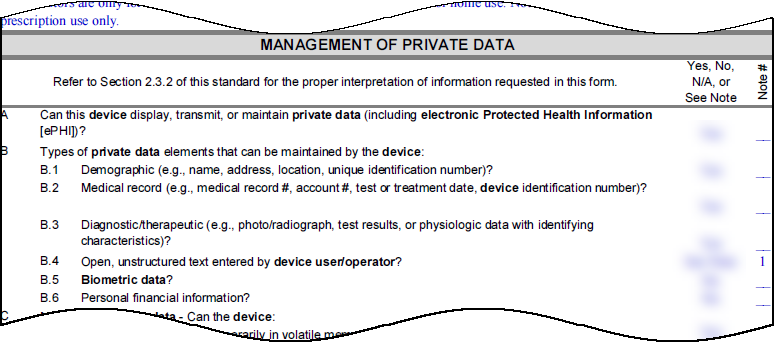
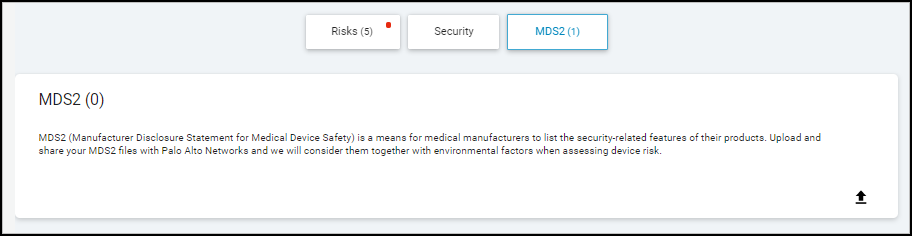
- MDS2 Management: Upload Manufacturer Disclosure Statement for Medical Device Safety (MDS2) documents. IoT Security uses data from these forms (e.g., PHI handling capabilities, patching support) to refine risk assessments and vulnerability detection.
- MDS2 Community: Opt-in feature to share and leverage anonymized MDS2 data uploaded by other IoT Security medical customers, improving device identification and risk awareness.
- Recalls Page: Lists FDA recalls affecting devices discovered in your inventory, linking directly to FDA recall details.
These features provide a holistic view for managing medical device security, optimizing asset allocation, ensuring compliance, and responding promptly to safety issues like recalls.
Biomed Dashboard
Accessed via Dashboard > Manage Dashboards > Biomed (when Medical theme is active).
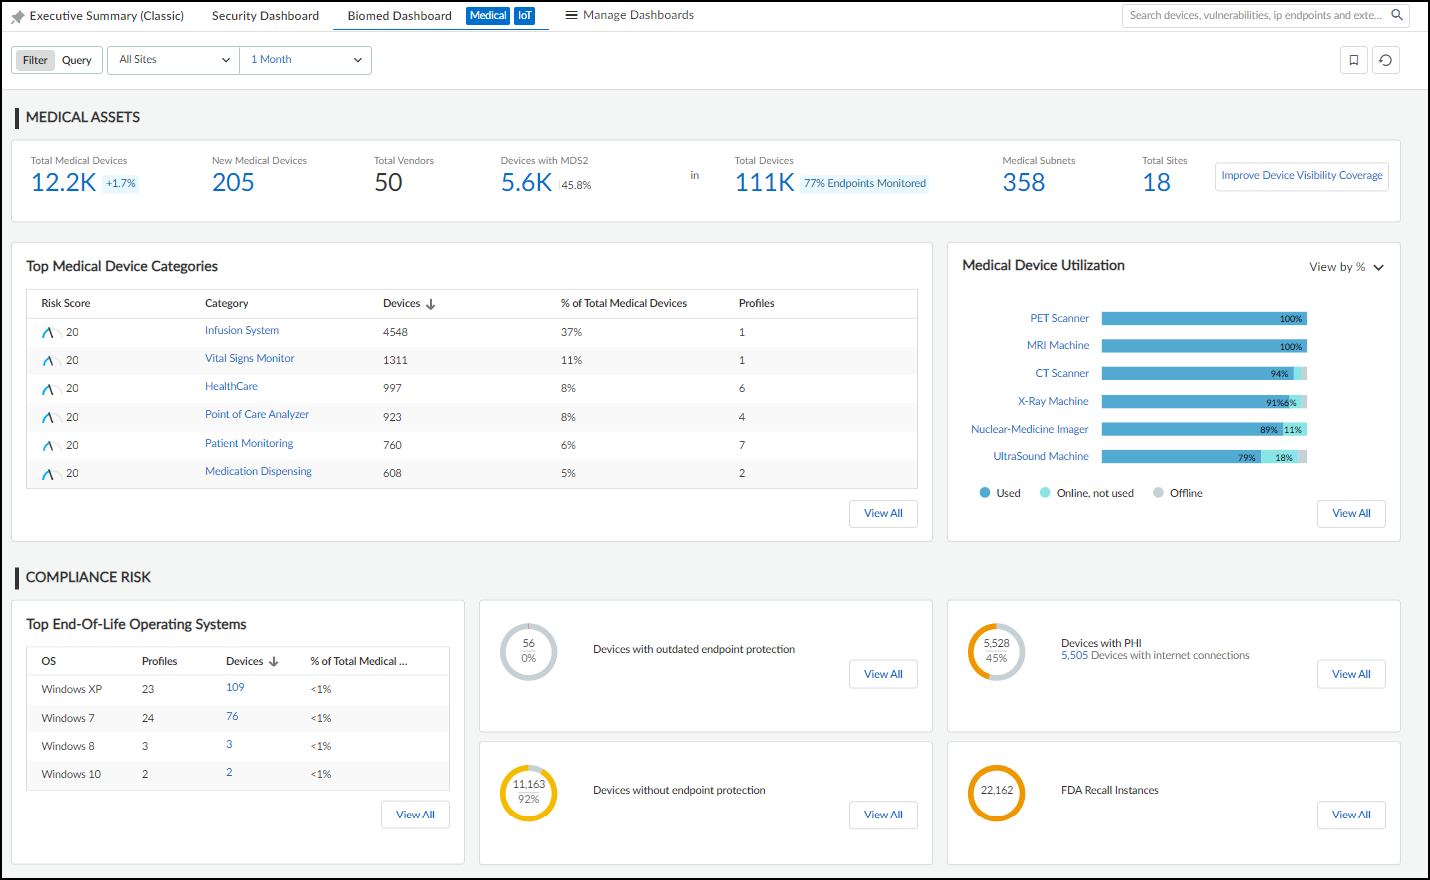
Provides:
- Filters: Site and Time Range.
- Medical Assets Summary: Totals for Medical Devices (overall & new), Vendors, Devices with MDS2. Also shows context totals for All Devices, Medical Subnets, Total Sites. Includes "Improve Device Visibility Coverage" button linking to Data Quality Diagnostics.
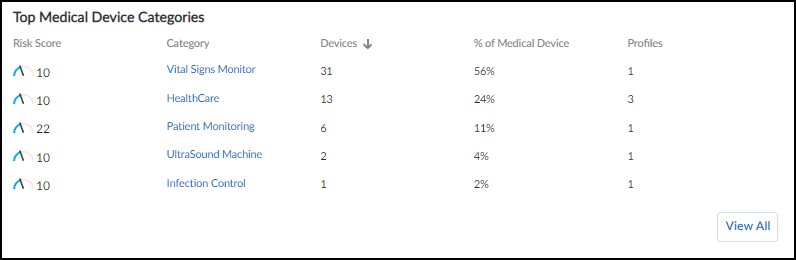
- Top Medical Device Categories: Ranks categories by device count. Clickable links filter the main Devices page.
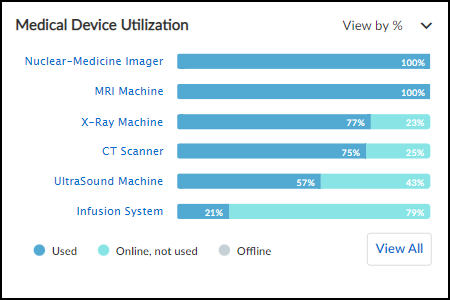
- Medical Device Utilization Summary: Bar chart showing % of time devices in each category are Used / Online Only / Offline. Clickable links filter the main Devices page.
-
Compliance Risk Section:
- Top End-of-Life Operating Systems: Lists profiles with devices running unsupported OS versions. Clickable links filter the Devices page.
- Other Risk Factors: Counts/percentages for devices with outdated/missing endpoint protection, devices handling PHI, and devices subject to FDA recalls. Clickable links filter Devices or open Recalls page.
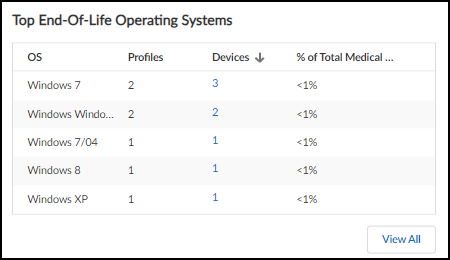
Top End-of-Life Operating Systems. 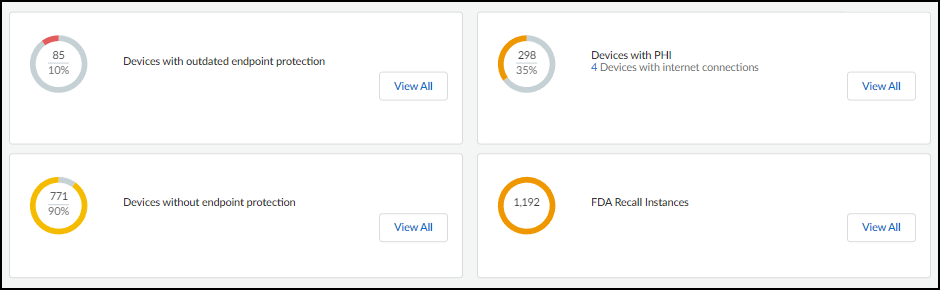
Other Compliance Risk Factors.
Utilization Dashboard
Accessed via Dashboards > Manage Dashboards > Utilization (when Medical theme is active). Important: Requires App-ID content version 8367-6513+ on firewalls.
Provides detailed usage metrics for specific medical device categories (Imaging, Infusion Systems).
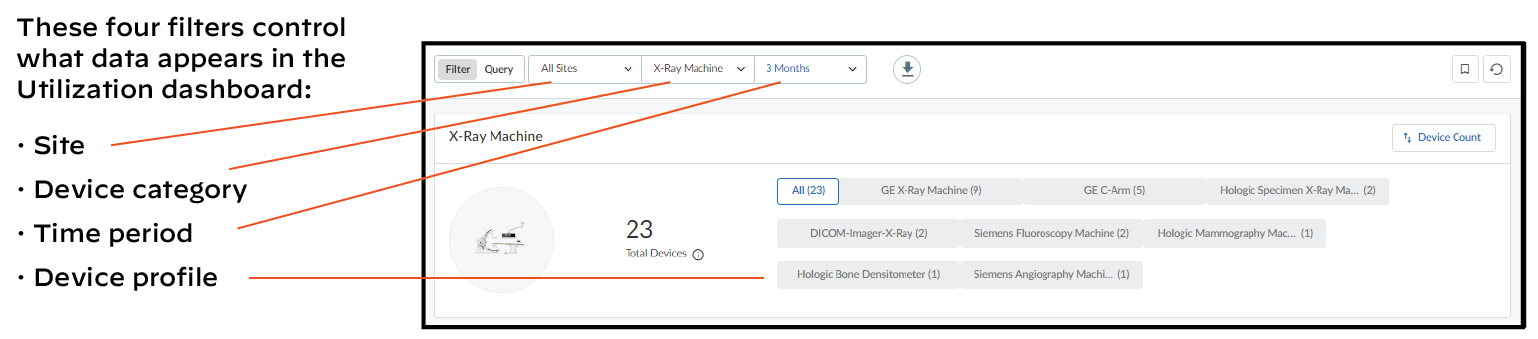
Filters:
- Sites: All Sites or specific site(s).
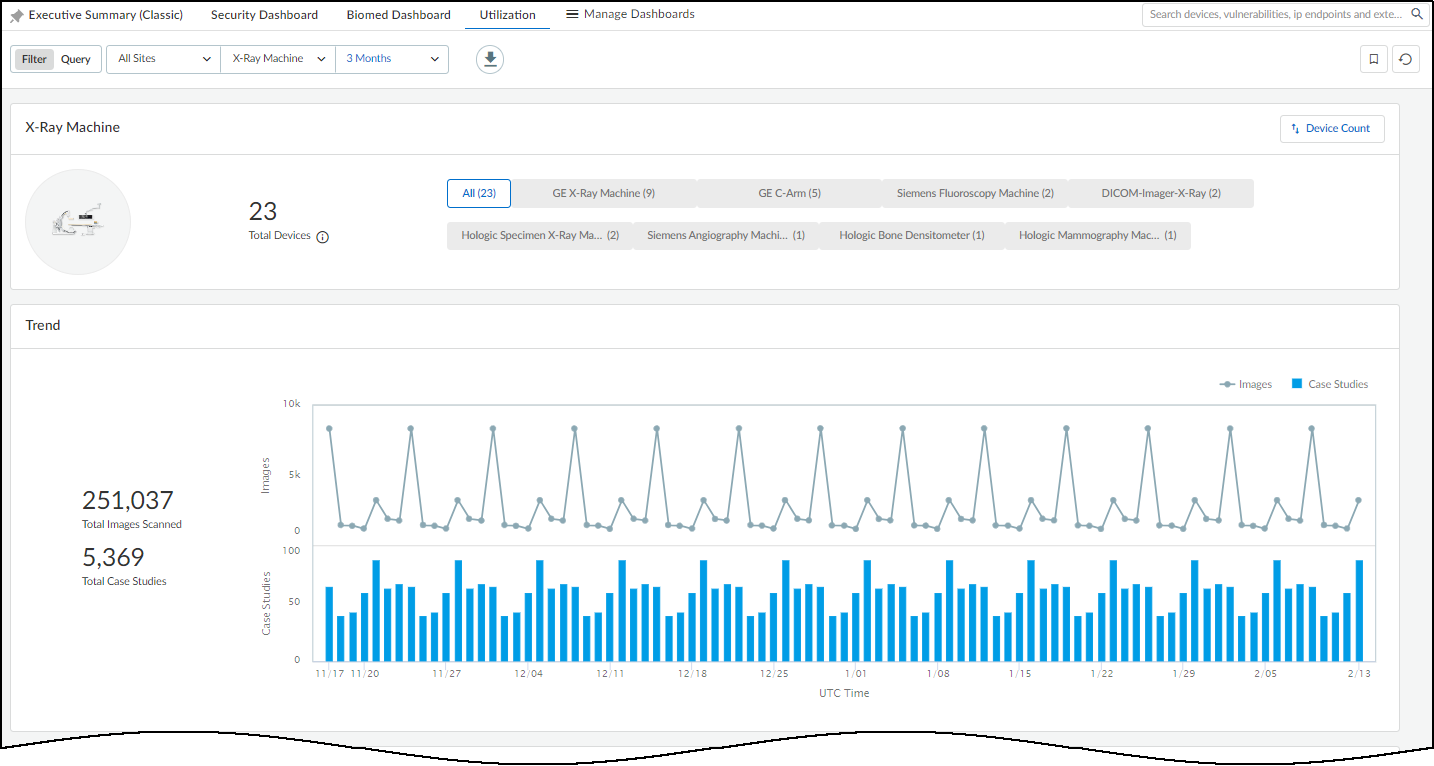
- Medical IoT Device Categories: Dynamically populated list (CT, MRI, X-Ray, Infusion System, etc.). Defaults to first alphabetically.
- Time Range: 1 Week, 1 Month, 3 Months. (Inherits initially, but dashboard data constrained to these ranges).
- Device Profiles: Filters *within* the selected Category. Shows profiles detected in the past year. Allows focusing on specific models.
Remark: Data requires ~24 hours to initially populate.
Download:
Data can be exported to Excel via the Download icon (
 ).
).
Information Panels (Vary by Category):
-
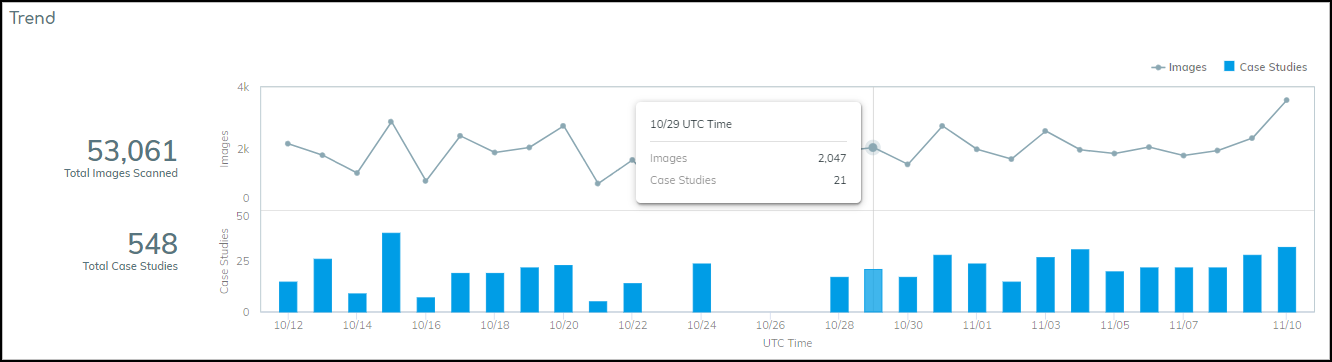
Trend:
- Imaging Devices: Line graph (images over time) + Bar graph (case studies over time).
- Infusion Systems: Line graph showing Devices Used vs. Devices Online Only over time.
Trend Panel - Imaging Devices. 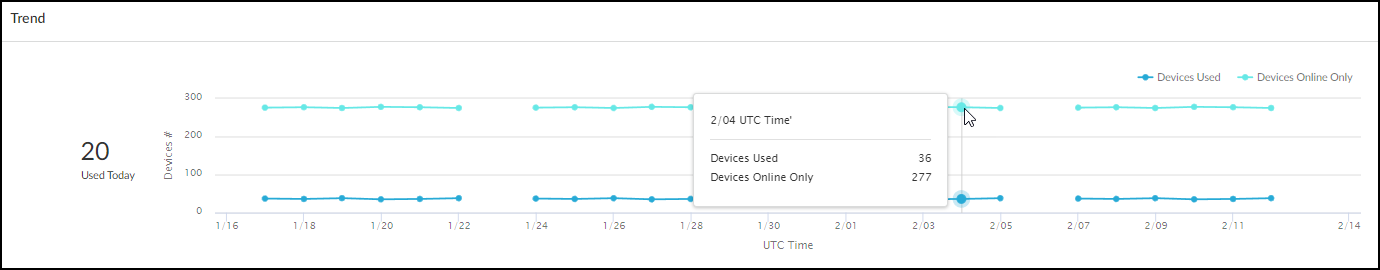
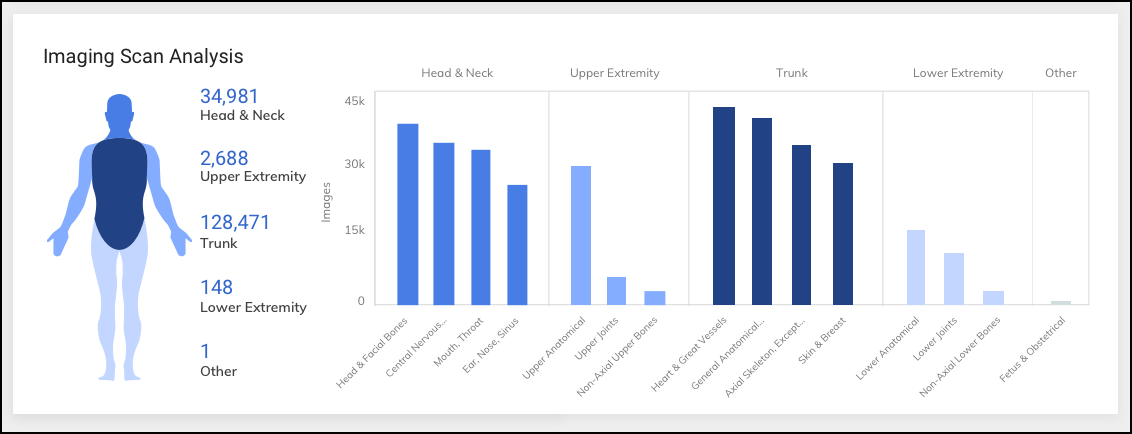
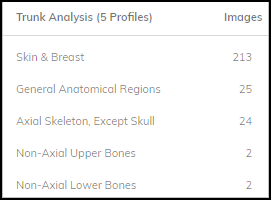
Trend Panel - Infusion Systems. - Imaging Scan Analysis (Not for Ultrasound): Human figure color-coded by scan volume per body region (Head/Neck, Upper Extremity, Trunk, Lower Extremity, Other). Bar charts show top scanned sub-regions.
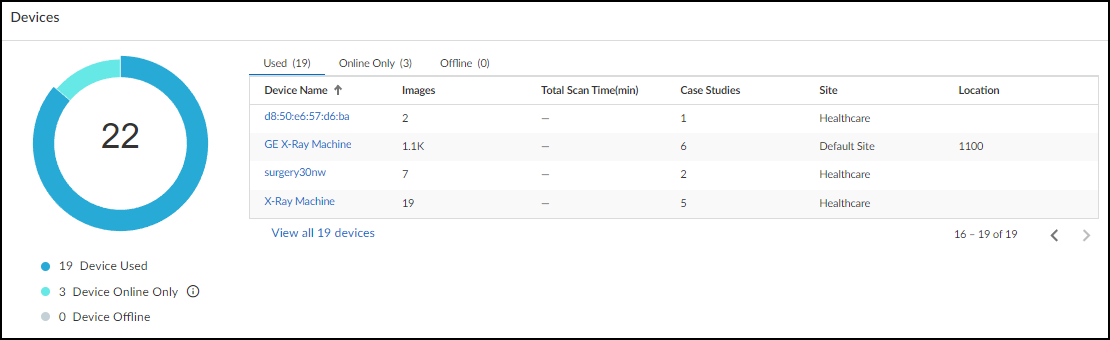
- Devices: Donut chart and table showing device status (Used, Online Only, Offline) within the filtered time range vs. total devices seen in past year. Clickable links filter the main Devices page.
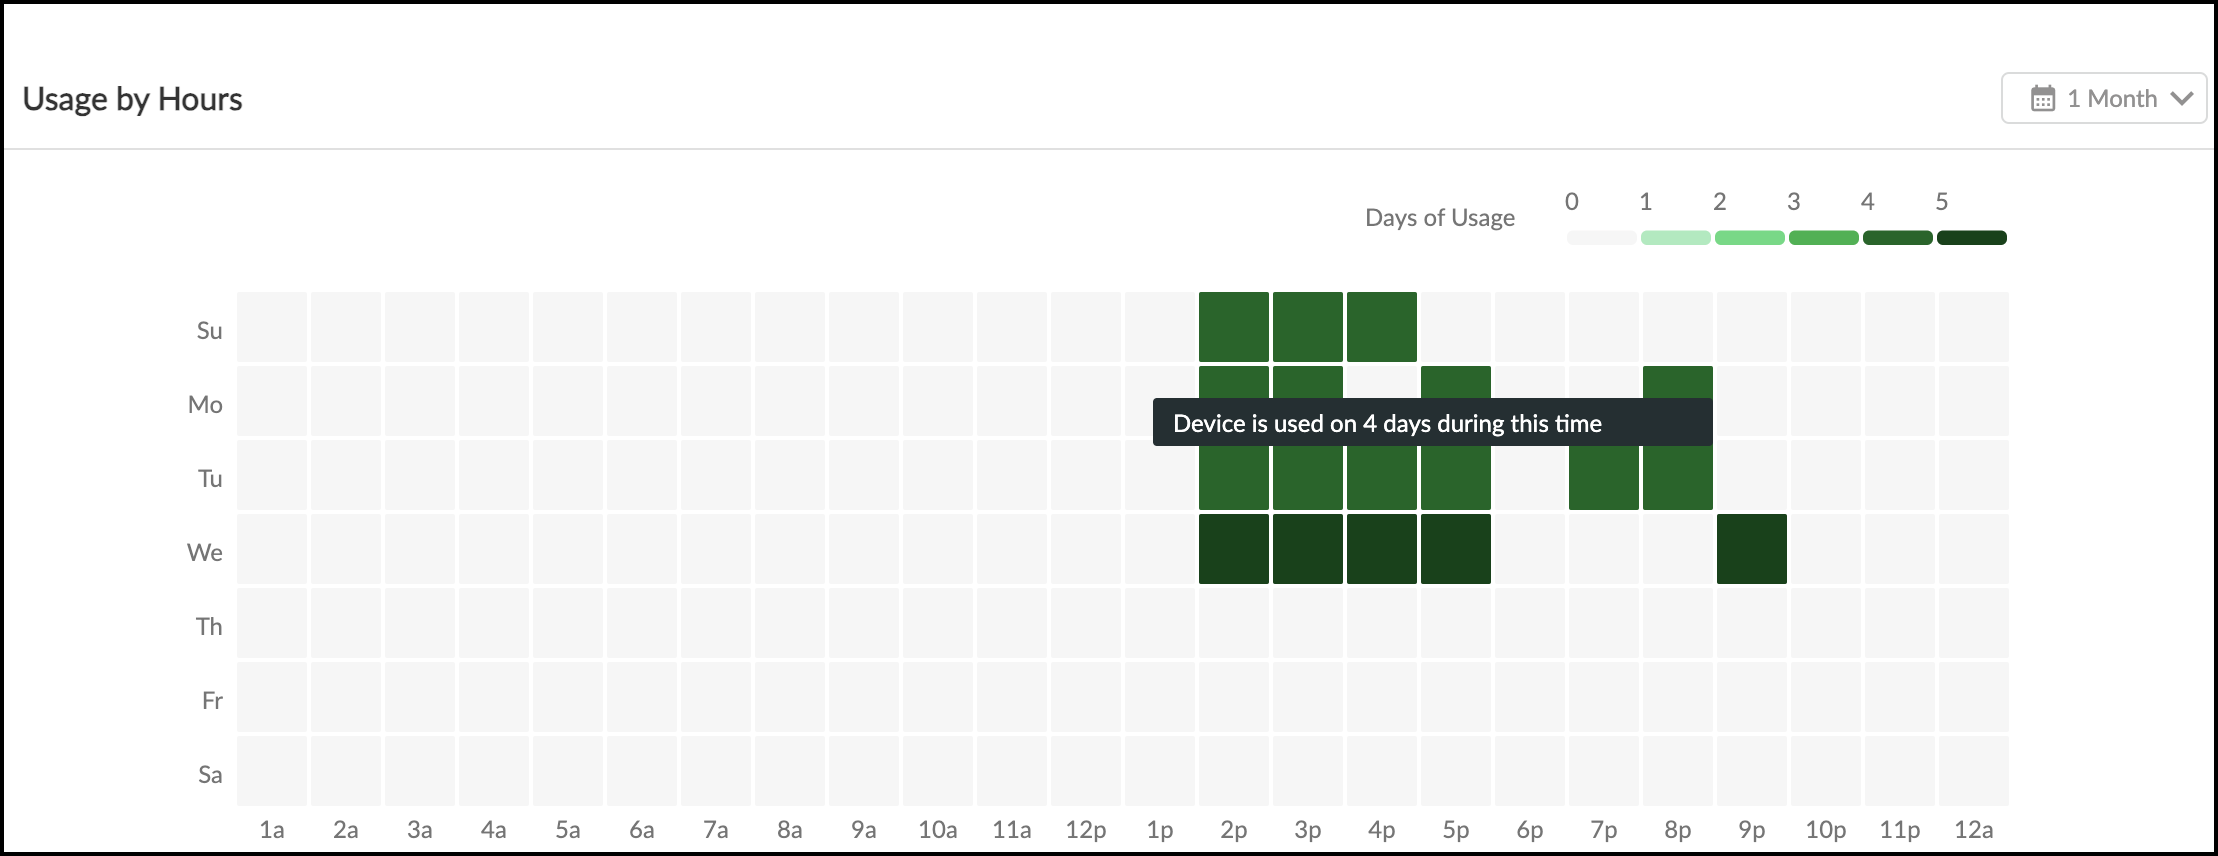
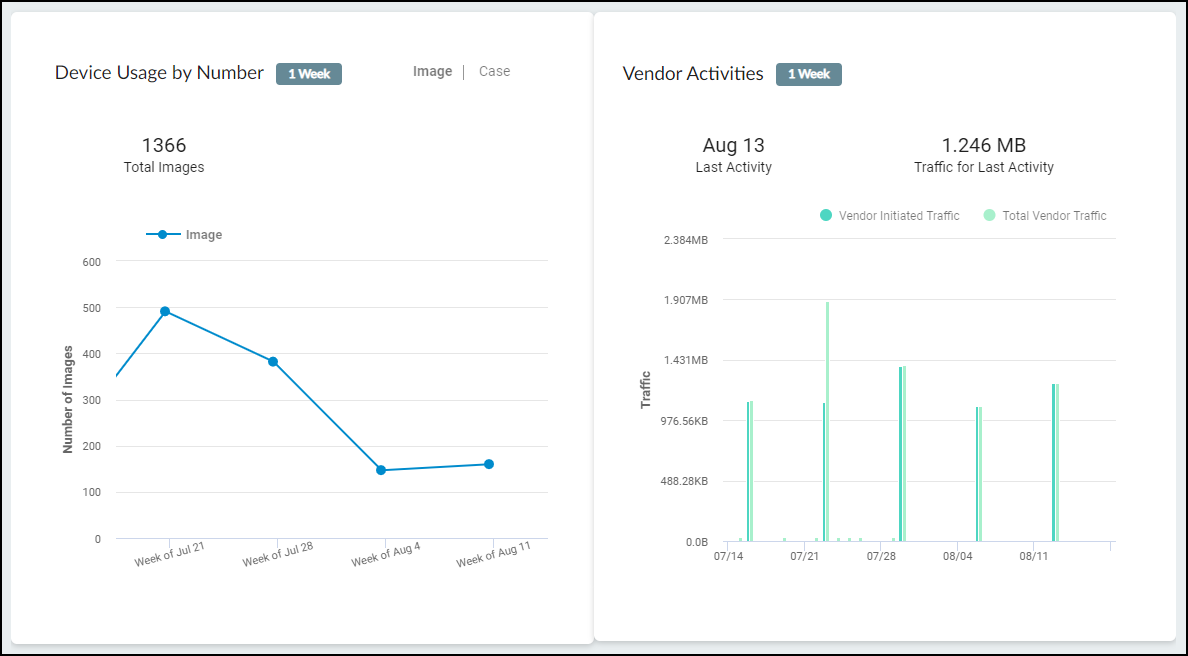
- Clicking a device name opens Device Details, which has a "Utilization" tab showing detailed usage heatmaps (by hour/day), image/case counts (imaging), usage duration comparisons (infusion), and vendor communication activity.
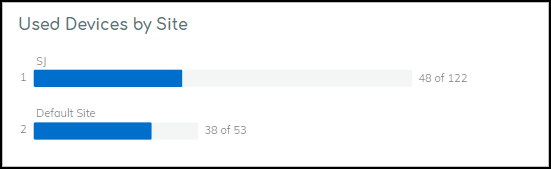
- Used Devices by Site (Multi-site only): Bar chart comparing # used devices vs. total devices per site.
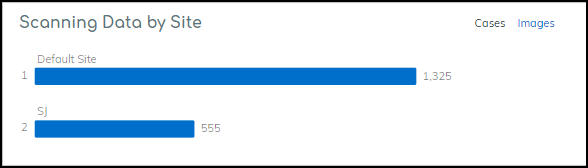
- Scanning Data by Site (Imaging, Multi-site only): Bar chart comparing image/case counts per site.
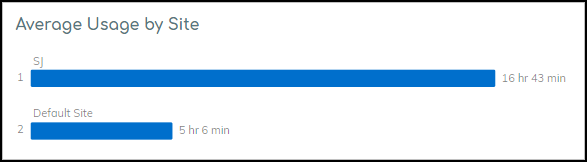
- Average Usage by Site (Infusion, Multi-site only): Bar chart showing average hours used per active device per site.
MDS2 Management
Important: Requires IoT Security Medical subscription and Medical IoT Security portal theme. Page only appears when theme is active.
Manage Manufacturer Disclosure Statement for Medical Device Safety (MDS2) documents at Vulnerabilities > MDS2 . Uploading these PDFs helps IoT Security refine risk assessment by incorporating vendor-disclosed security features (or lack thereof).
Key Features:
-
Upload MDS2 Files:
Click Upload icon (
 ), select PDF.
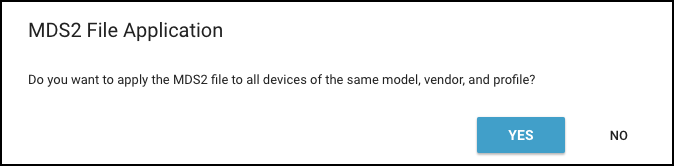
Uploading here applies the MDS2 to *all* matching devices
(by vendor, profile, model) currently and in the future. Uploading via Device Details applies only to that specific device.
), select PDF.
Uploading here applies the MDS2 to *all* matching devices
(by vendor, profile, model) currently and in the future. Uploading via Device Details applies only to that specific device.
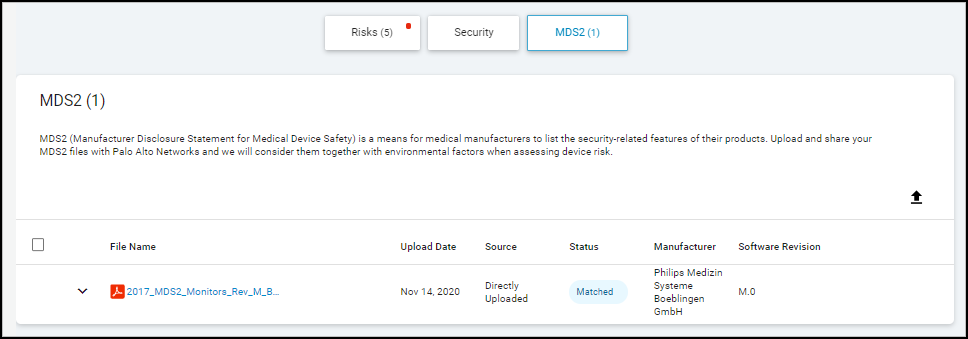
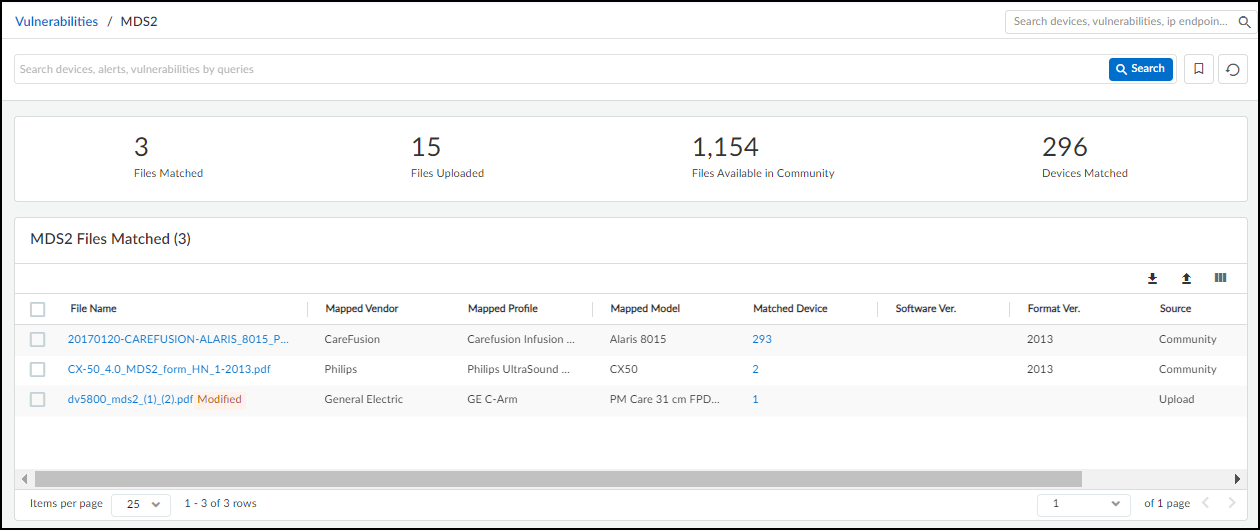
- View Matched Files: Lists MDS2 files (yours and community-sourced) that match devices in your inventory. Shows matched device count, source (Uploaded by You, Community), file format version, upload date.
- Matched Device Count: Clicking the number opens the Devices page filtered for matching devices.
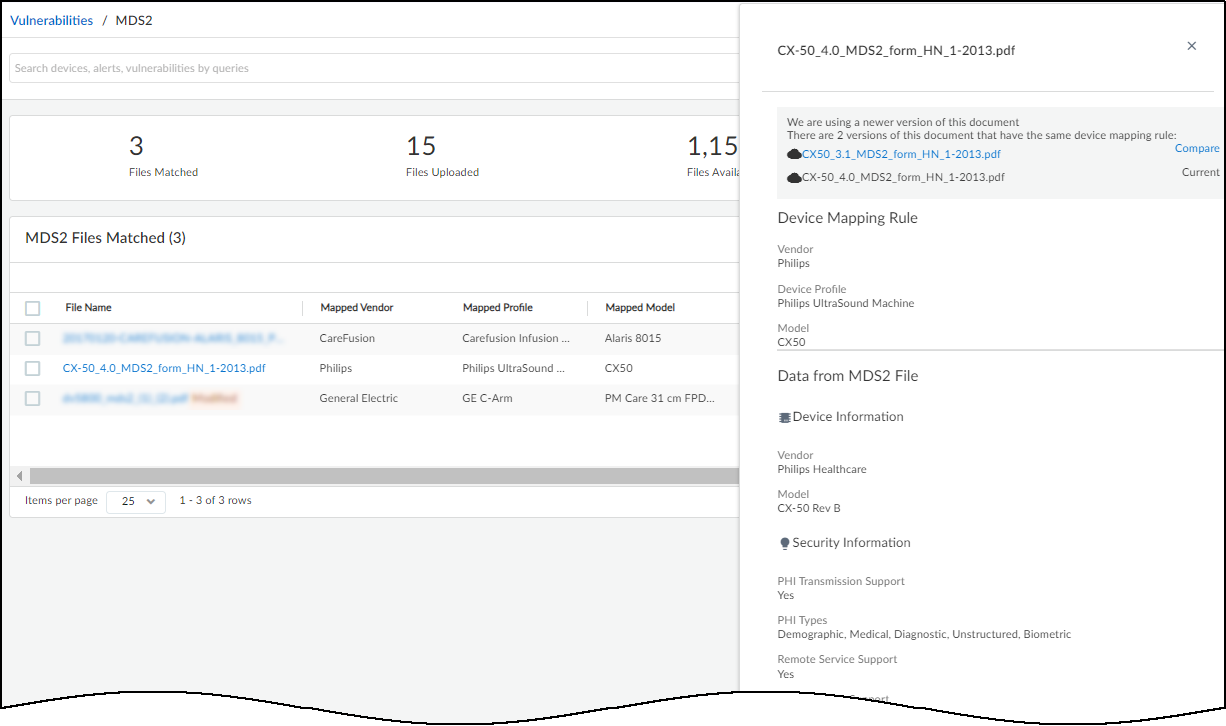
- View File Details: Clicking a filename opens a side panel with mapping attributes (Vendor, Profile, Model), key data points extracted from the file, and duplicate file management.
- Edit Parsing Errors: If text alignment caused parsing errors in mapping rules or data points, use the Edit button in the details panel to correct them.
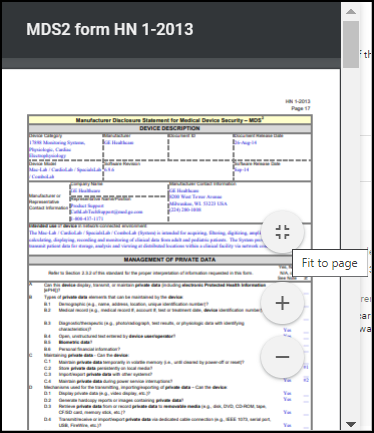
- Preview PDF: Click Show PDF in the details panel to view the document. Download via the PDF viewer's download icon.
-
Download List:
Download a CSV list of all/selected MDS2 files using the Download icon (
) above the table.
- Remove Files: Select file(s) and click Remove .
- MDS2 Community (Opt-in): Join via the "Learn More" / "Join Now" prompts. Allows sharing your validated MDS2 uploads and utilizing validated uploads from other users. Improves coverage. IoT Security prioritizes MDS2 files (Excluded > Manual Selection > Your Upload > Community Upload > Later Version > Later Format) .
- Exclude/Include Community Files: On the Community Files tab, select files and click Exclude to prevent automatic application, or Include to re-enable.
- Manually Select Duplicate: If multiple files match a device (shown in details panel), click a non-current file name and choose "Use <file-name> instead" to override automatic selection.

Recalls
Important: Requires IoT Security Medical subscription and Medical IoT Security portal theme. Page appears only if recalled devices are detected .
Navigate to Vulnerabilities > Recalls .
This page lists active FDA recalls affecting medical devices discovered in your inventory.
- Recall Identifier: Links directly to the official FDA recall information page.
- Recalled Devices: Shows the count of devices in your inventory matching the recall criteria (e.g., model, lot number if available).
- Use the FDA link to get specific recalled identifiers (lot/serial numbers) and manufacturer contact info to locate and manage affected devices.
Monitor IoT Security Health
Regularly monitoring the health of your IoT Security deployment ensures optimal performance and data quality.
Key Monitoring Areas:
- Reports: Generate scheduled or on-demand reports for inventory, risk, alerts, and utilization trends. Provides high-level views and tracking.
- Data Quality Diagnostics: Check the quality of incoming network data, focusing on reducing IP endpoints and low-confidence devices for better accuracy.
- Integration Status (Firewalls/Prisma Access): Verify connectivity, log forwarding status, and policy/mapping request flow.
- On-demand PCAP Authorization: Allow Palo Alto Networks Research Team to capture specific traffic for deep analysis of unknowns (requires explicit authorization and compatible PAN-OS).
Reports
Navigate to Logs & Reports > Reports .
Report Types:
- Summary: Overview of inventory, risk, alerts. (Scheduled)
- Discovery: Devices discovered, subnet distribution, high-risk/alerting devices. (Immediate Only)
- New Device: Lists devices newly discovered since the last report run. (Scheduled: Daily, Weekly, Monthly)
- Risk: Detailed risk summary, trends, remediation status. (Immediate & Scheduled)
- Inventory Gap: Compares IoT Security discovered devices with CMMS inventory (Requires CMMS Integration). (Scheduled)
- Utilization: Medical device usage metrics (Requires Medical Subscription). (Immediate & Scheduled)
- Filtered Inventory: Custom inventory report based on a saved filter from the Devices page. (Scheduled)
Generating Reports:
- Generate Now (+ > Generate a report now): For Discovery, Utilization, Risk types. Define scope (type, name, sites, filters, time range), subscribe recipients, click Generate.
- Schedule (+ > Schedule a report for later): For all types except Discovery & Utilization. Define scope, select recurrence (daily, weekly, monthly, custom), subscribe recipients, click Schedule. Remark: Initial run covers the period leading up to the first scheduled time.
Viewing Reports:
- Switch between Card View (groups similar reports) and List View (shows all reports individually).
- "View report history (n)" shows different versions/runs of the *same report configuration* by the *same user*.
- "View report (m) of (n)" navigates between *different report configurations* (potentially by different users) grouped on the same card due to similarity.
- HTML reports (Summary, Discovery, Risk, etc.) open in the browser. Click "View Report History" or "View Report". Downloadable as PDF.
- CSV reports (New Device, Filtered Inventory) must be downloaded. Click "View Report History" or "View Report" to access download links.
Editing/Managing Reports:
- Use the Action menu ('...') on a report card/row to Edit, Copy, or Disable/Enable scheduled reports.
- Editing allows changing schedule, scope, recipients.
- Clicking "Generate Now" within the Edit dialog of a *scheduled* report runs it immediately for its defined period (e.g., weekly report run now covers the last 7 days).
IoT Security Integration Status with Firewalls
Navigate to Administration > Firewalls > Firewalls .
This page provides health checks for NGFW integration:
- Overview: Counts of Sites, Subscribed Firewalls, Active (sending logs recently), Inactive, System Alerts. Firewall Request Status icon (hover) shows if policy/mapping requests are received.
- Firewall Log Type Status: Shows if EAL, DHCP, ARP, traffic, threat logs are "Live Data" (received within 30 mins) or "No Live Data".
- Log Events / Average Latency Graphs: Hover over graph icons to see trends for log volume and processing latency over the selected time filter (1h, 1d, 1w).
- Firewalls Table: Lists individual firewalls with details: Status (Receiving logs/Not receiving logs), Hostname, Serial, PAN-OS Version, IoT Dictionary Version (should be latest, crucial for Device-ID), App-ID Version, License Type, Log Counts, Site, Connection Times.
- Clicking a firewall serial number shows a detailed log status panel for that specific firewall.
- HA Pairs: Active firewall shows "Receiving logs". Passive usually shows "Not receiving logs" unless recently rebooted or using aggregate interfaces with LACP passive pre-negotiation.
IoT Security Integration Status with Prisma Access
When using the IoT Security add-on for Prisma Access:
- Sites Page (Networks > Networks and Sites > Sites): Shows a single entry named "Prisma Access" . Status indicates connectivity (green cloud = connected/receiving logs). Device/IoT Device counts represent totals across *all* remote sites protected by that Prisma Access instance. Risk score is aggregated. Subnet count reflects all unique subnets seen across all locations.
- Firewalls Page (Administration > Firewalls > Firewalls): Less relevant. Shows Prisma Access as potentially 1 active/inactive "firewall". System alerts related to policy/mapping requests from Prisma Access are shown here (Source = All firewalls). The detailed table doesn't apply directly to Prisma Access nodes.
Data Quality Diagnostics
Navigate to Administration > Data Quality .
This page helps assess the quality of data IoT Security receives, focusing on reducing:
- IP Endpoints: Devices seen only by IP, without a stable unique identifier (MAC) or consistent behavior for static IP classification. High numbers indicate potential visibility gaps.
- Low-confidence Devices: Devices identified with < 70% confidence. Often caused by insufficient log data. High numbers may prevent effective policy enforcement via Device-ID (which requires >= 90% confidence).
The page shows counts and percentages for these categories relative to all devices (based on last 30 days). Review the recommendations provided to improve network coverage (e.g., ensuring logs from relevant segments, enabling ARP/DHCP logging) if the numbers exceed your acceptable threshold based on deployment goals.
Remark: Check Data Quality Diagnostics weekly for the first few months after deployment and periodically thereafter.
Authorize On-demand PCAP
This feature allows authorized Palo Alto Networks IoT Security Research Team members to remotely trigger packet captures (PCAPs) on specific, authorized firewalls for deep analysis of unknown devices or applications when other methods are insufficient.
Requirements & Notes:
- Important: Requires PAN-OS 10.2.10+, 11.0.4+, or 11.1.0+.
- Important: Requires 'openconfig' plugin v2.1.0+ installed on the firewall (Device > Plugins).
- PCAPs are limited in scope to minimize firewall impact.
- Captured files are stored securely, accessed only by the Research Team, and deleted after analysis or automatically after 30 days.
- Requires explicit authorization per firewall from an IoT Security Admin or Owner.
Authorizing/Unauthorizing PCAP:
- Ensure openconfig plugin is installed on target firewalls.
- In IoT Security portal, go to Administration > Firewalls > On-demand PCAP .
- Click '+' (Add).
- Select the firewall(s) by serial number.
- Choose authorization duration (1 month, 3 months, Unlimited).
- Click Confirm .
- To unauthorize, select firewall(s) in the list and click Unauthorize , or use the 'Reauthorize' icon in the Actions column (which effectively acts as unauthorize if clicked for an authorized firewall).
Interactive Quiz
Test Your Knowledge!
Answer the following questions based on the document content. Click "Check Answers" after completing a section or "Show Final Results" at the end.