Comprehensive IPSec VPN Testing and Troubleshooting on Palo Alto Networks Firewalls
This guide provides an in-depth exploration of testing and troubleshooting IPSec VPNs exclusively within the Palo Alto Networks ecosystem. It is designed for network security professionals preparing for the PCNSE certification and those managing Palo Alto Networks firewalls in real-world environments. We will cover GUI-based tools, PAN-OS CLI commands, common issues with their Palo Alto Networks-specific resolutions, and packet analysis techniques.
1. GUI-Based Monitoring and Testing in PAN-OS
The PAN-OS Web Interface provides several crucial locations for monitoring the health and status of IPSec VPNs. Effective use of these tools is the first step in diagnosing most VPN issues.
-
Monitor > Logs > System
: System logs are invaluable for observing the IKE (Internet Key Exchange) negotiation process.
-
Filtering
: Use filters like
( subtype eq ike )to narrow down entries related to VPNs. Look for messages indicating Phase 1 (IKE SA) and Phase 2 (IPSec SA) negotiation successes or failures. - Error Messages : Pay close attention to error messages such as "Phase 1 proposal mismatch," "Pre-shared key mismatch," "Received NO_PROPOSAL_CHOSEN," or "Authentication failed." These provide direct clues to configuration issues.
- Successful Negotiation : Successful IKE SA establishment will be logged, followed by messages related to IPSec SA establishment.
-
Filtering
: Use filters like
-
Monitor > Logs > Traffic
: Traffic logs show whether user traffic is actually being encrypted and decrypted through the VPN tunnel.
- Filtering : Filter by source/destination IP addresses expected to traverse the tunnel. Check the "Session End Reason" column; "policy-deny" could indicate missing or misconfigured security policies.
-
NAT-T Indication
: If NAT Traversal is in use, you might see traffic on UDP port 4500. The application detected might be
ipsec-esp-udp. - Bytes In/Out : Non-zero byte counts for sessions destined for the tunnel indicate traffic flow.
-
Network > IPSec Tunnels
: This page is the primary dashboard for viewing the real-time status of all configured IPSec tunnels.
-
Tunnel Status
:
- Green : Both IKE SA (Phase 1) and IPSec SA (Phase 2) are up and active.
- Yellow : IKE SA (Phase 1) is up, but IPSec SA (Phase 2) is down or has issues. This often points to Proxy ID mismatches or Phase 2 proposal issues.
- Red : IKE SA (Phase 1) is down. This indicates problems with IKE Gateway configuration, pre-shared keys, connectivity, or Phase 1 proposals.
- Grey/Disabled : The tunnel is administratively disabled.
-
Detailed Information
: Clicking on a tunnel name provides details such as:
- IKE Gateway used
- Local and Peer IP addresses
- Encryption and Authentication algorithms in use for both Phase 1 and Phase 2
- Lifetimes and remaining time for SAs
- Rekey information
- Statistics: Encrypted/Decrypted Bytes/Packets, Errors. An increasing error count is a clear indicator of problems.
- Manual Rekey/Clear : You can manually trigger an IKE SA rekey, IPSec SA rekey, or clear SAs from this interface for troubleshooting purposes.
-
Tunnel Status
:
-
Network > Network Profiles > Monitor (Tunnel Monitoring)
: Tunnel Monitoring allows the Palo Alto Networks firewall to actively check the liveliness of the VPN tunnel.
- Configuration : You specify a destination IP address (typically an IP on the remote side of the tunnel that is reachable only via the tunnel) to send ICMP pings to.
-
Action on Failure
: If pings fail for a configured number of times, the firewall can take actions like:
- Log the event.
- Mark the tunnel as down.
- (Optional) Failover to a backup path or tunnel if configured (e.g., in SD-WAN scenarios or with multiple tunnels).
- Reverse RPF (Reverse Path Forwarding) Check : Ensure that the source IP used for the monitor pings is correctly routed back through the tunnel on the remote peer.
- ACC (Application Command Center) > Tunnel Activity : The ACC provides a graphical overview of tunnel traffic, including bandwidth usage, session counts, and applications traversing the tunnels. This is useful for understanding traffic patterns and identifying anomalies.
2. PAN-OS CLI Commands for In-Depth VPN Diagnostics
The PAN-OS command-line interface (CLI) offers powerful tools for granular VPN troubleshooting and status verification. These commands are essential for deeper analysis when GUI information is insufficient.
admin@PA-VM> configure
Entering configuration mode
[edit]
admin@PA-VM#
Most VPN operational commands are run in operational mode (
>
prompt).
-
show vpn ike-sa: Displays the status of IKE Security Associations (Phase 1).-
Key fields: Gateway Name, Peer IP, Local IP, Role (Initiator/Responder), State (e.g.,
INIT-SA,ESTABLISHED), Algorithms (Auth, Encrypt, Hash, DH Group), Lifetime. -
show vpn ike-sa gateway <gateway-name> detailprovides more verbose output.
-
Key fields: Gateway Name, Peer IP, Local IP, Role (Initiator/Responder), State (e.g.,
-
show vpn ipsec-sa: Displays the status of IPSec Security Associations (Phase 2).- Key fields: Tunnel Name, Tunnel ID, Peer IP, Local IP, SPI (Inbound/Outbound), Protocol (ESP), Algorithms (Encrypt, Auth), Lifetime, Lifesize, Encap/Decap Pkts/Bytes, Errors.
-
show vpn ipsec-sa tunnel <tunnel-name> detailprovides more verbose output. Pay attention to the Proxy-ID (Local IP, Remote IP, Protocol, Port) information here, as mismatches are a common issue.
-
test vpn ike-sa gateway <gateway-name>: Manually initiates an IKE SA (Phase 1) negotiation for the specified IKE Gateway.- Observe the output for success or failure messages. This command is useful to trigger negotiation without waiting for interesting traffic.
-
test vpn ipsec-sa tunnel <tunnel-name>: Manually initiates an IPSec SA (Phase 2) negotiation for the specified tunnel, provided Phase 1 is up.- This can help isolate issues to Phase 2 if Phase 1 establishes successfully.
-
clear vpn ike-sa gateway <gateway-name>: Clears the active IKE SA for the specified gateway, forcing a renegotiation. -
clear vpn ipsec-sa tunnel <tunnel-name>: Clears the active IPSec SAs for the specified tunnel, forcing a renegotiation for Phase 2. -
Debugging IKE (Management Plane)
:
-
debug ike global on debug: Enables detailed IKE debugging globally. This is very verbose. -
debug ike gateway <gateway-name> on debug: Enables detailed IKE debugging for a specific IKE gateway. This is more targeted. -
less mp-log ikemgr.log: View the IKE manager log file in the management plane. This log contains the detailed IKE negotiation messages when debugging is enabled. Search for peer IP addresses or gateway names. -
tail follow yes mp-log ikemgr.log: To view live IKE log messages as they occur. -
debug ike global off: Disables IKE debugging. CRITICAL to turn off after troubleshooting to conserve resources.
-
-
Debugging IPSec (Data Plane)
:
-
IPSec processing primarily occurs in the data plane. Logs related to packet encryption/decryption issues are often found in
kmd.log. -
debug dataplane pool statistics: Can show if packet buffers for VPN processing are being exhausted. -
less dp0-log kmd.log(ordp1-logetc. depending on the Data Plane processor handling the tunnel): View the kernel crypto manager log. This can show errors related to SPI lookup failures or decryption errors. - More advanced data plane debugging often involves packet captures and global counters.
-
IPSec processing primarily occurs in the data plane. Logs related to packet encryption/decryption issues are often found in
-
show counter global filter delta yes packet-filter yes aspect vpn: Displays various VPN-related packet counters, including errors, encryption/decryption counts. Thedelta yesshows changes since the last time the command was run, useful for observing real-time activity and errors.
ikemgr.log
is for Management Plane IKE negotiations. For issues with actual encrypted traffic (Data Plane), you might need to inspect
kmd.log
or use packet captures. Not all IPSec issues are logged in
ikemgr.log
.
For more detailed CLI troubleshooting steps, always refer to the official Palo Alto Networks TechDocs portal.
3. Common IPSec VPN Issues and Palo Alto Networks Specific Resolutions
Understanding common pitfalls can significantly speed up the troubleshooting process.
| Issue | Palo Alto Networks Specific Checks & Resolutions | Relevant Logs/CLI |
|---|---|---|
| Pre-shared Key Mismatch | Verify the pre-shared key (PSK) under Network > IKE Gateways > [Your Gateway] > Authentication . Ensure it's identical on both peers, including case sensitivity. Re-enter the key on both sides if unsure. |
System Log (IKE subtype) for "Authentication failed" or "Invalid KEY_INFO" messages.
debug ike gateway <gw> on debug
, then view
mp-log ikemgr.log
.
|
| IKE (Phase 1) Proposal Mismatch |
Ensure the
IKE Crypto Profile
(found under
Network > Network Profiles > IKE Crypto
) settings match precisely on both peers. This includes:
|
System Log (IKE subtype) for "Phase 1 proposal mismatch" or "NO_PROPOSAL_CHOSEN."
mp-log ikemgr.log
with IKE debugging enabled.
|
| IPSec (Phase 2) Proposal Mismatch |
Ensure the
IPSec Crypto Profile
(found under
Network > Network Profiles > IPSec Crypto
) associated with the IPSec Tunnel (
Network > IPSec Tunnels > [Your Tunnel]
) matches the remote peer's Phase 2 settings. This includes:
|
System Log (IKE subtype), often less explicit than Phase 1. Status "Yellow" on IPSec Tunnels page.
mp-log ikemgr.log
(for IKEv2, this is still relevant).
show vpn ipsec-sa
may show no SAs or SA in an error state.
|
| Firewall Security Policy Issues |
Verify Security Policies to permit:
|
Traffic Logs (Monitor > Logs > Traffic) filtered for peer IP and relevant ports/protocols. Look for "policy-deny." |
| NAT Traversal (NAT-T) | NAT-T is enabled by default on Palo Alto Networks firewalls ( Network > IKE Gateways > [Your Gateway] > Advanced Options > Enable NAT Traversal ). Ensure it's also enabled on the peer if a NAT device exists between the VPN peers. The firewall auto-detects NAT and switches to UDP 4500. |
System Log (IKE subtype) for messages related to NAT detection (NAT-D payloads). Traffic Logs for UDP 4500.
show vpn ike-sa detail
will show if NAT-T is active for an SA.
|
| Proxy ID Mismatch (Traffic Selectors) |
For policy-based VPNs (less common with Palo Alto Networks, which primarily uses route-based VPNs), Proxy IDs must match exactly. For route-based VPNs using Tunnel Interfaces:
|
IPSec Tunnels page (Yellow status).
mp-log ikemgr.log
with IKE debugging may show "TS_UNACCEPTABLE" or "INVALID_ID_INFORMATION" errors during Phase 2 (Child SA negotiation).
show vpn ipsec-sa detail
will show the negotiated Proxy IDs if an SA forms.
|
| Routing Issues |
Traffic must be routed into the Tunnel Interface.
|
Traffic Logs (no traffic entering tunnel).
show routing route
. Test pings from the firewall CLI sourcing from the Trust interface/IP to a remote VPN host.
|
| MTU Issues |
IPSec adds overhead (headers), which can lead to fragmentation if the original packet size plus IPSec overhead exceeds the path MTU.
|
Symptoms include stalled connections, slow performance, or inability to pass large packets. Packet captures might show ICMP "Fragmentation Needed" messages that are not being honored. |
| Dead Peer Detection (DPD) Mismatch | DPD settings ( Network > IKE Gateways > [Your Gateway] > Advanced Options ) should be compatible or identical. If one side has DPD enabled and the other doesn't, or if timers are too aggressive/different, it can lead to premature tunnel teardown. |
System Log (IKE subtype) for DPD messages or unexpected tunnel drops.
mp-log ikemgr.log
.
|
| Certificate Authentication Issues |
If using certificates instead of PSK:
|
System Log (IKE subtype) for certificate validation errors.
mp-log ikemgr.log
.
|
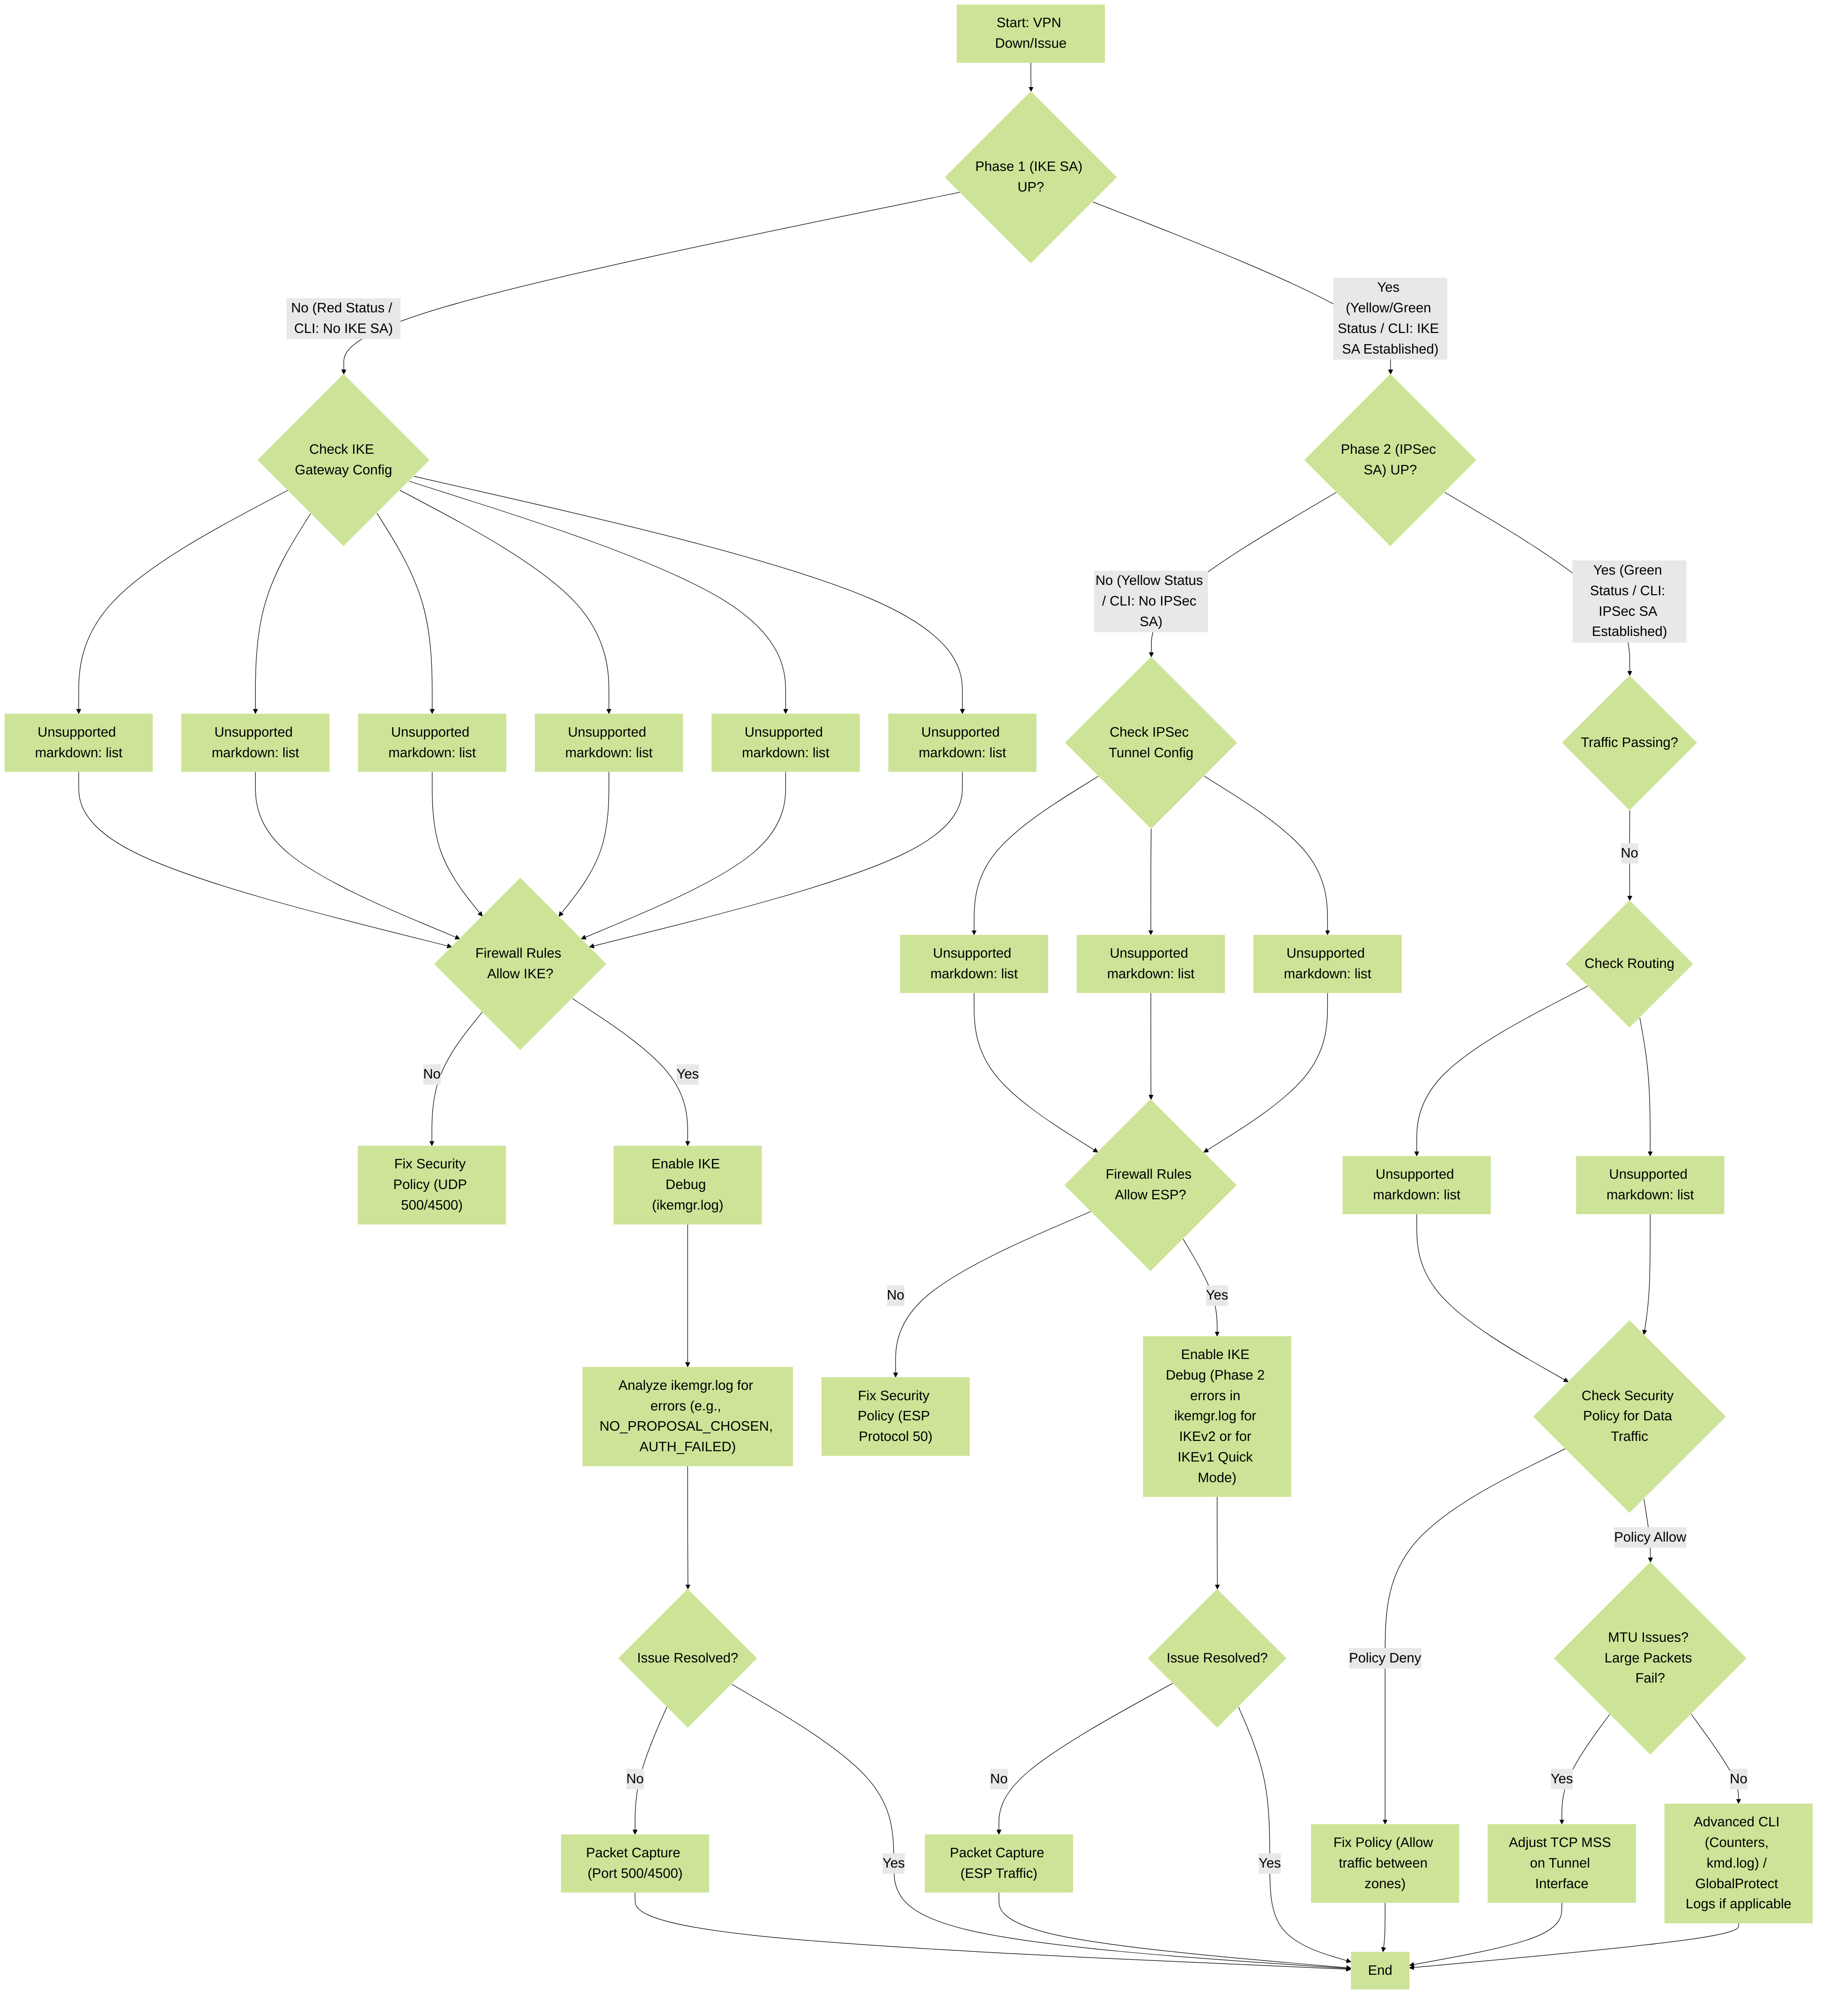
Palo Alto Networks IPSec VPN Troubleshooting Flowchart: This diagram outlines a systematic approach to diagnosing common IPSec VPN issues on Palo Alto Networks firewalls, starting from IKE Phase 1 verification through IPSec Phase 2, and finally data traffic flow.
4. Packet Capture and Analysis on PAN-OS
Packet captures are essential for deep-dive analysis when logs are not sufficient. PAN-OS provides robust packet capture capabilities directly on the firewall.
Configuring Packet Captures (CLI)
Packet captures are configured and managed via the CLI.
-
Define Capture Stages and Filters:
PAN-OS captures packets at different stages of processing:
-
receive: Packets as they arrive on an interface, before most processing. -
transmit: Packets just before they leave an interface, after all processing (including encryption for VPNs). -
firewall: Packets as they are evaluated by security policy. -
drop: Packets that are dropped by the firewall for any reason.
-
Capture IKE:
debug ike pcap on(This is a shortcut that captures IKE traffic on relevant interfaces). Alternatively, set up a manual capture:admin@PA-VM> debug dataplane packet-diag set capture stage receive file ike_capture_rx.pcap admin@PA-VM> debug dataplane packet-diag set capture stage transmit file ike_capture_tx.pcap admin@PA-VM> debug dataplane packet-diag set capture filter match source <local_external_ip> destination <peer_external_ip> protocol 17 sport 500 dport 500 admin@PA-VM> debug dataplane packet-diag set capture filter match source <peer_external_ip> destination <local_external_ip> protocol 17 sport 500 dport 500 admin@PA-VM> debug dataplane packet-diag set capture filter on admin@PA-VM> debug dataplane packet-diag set capture onRemember to add filters for UDP 4500 if NAT-T is involved. -
Capture ESP: Filter on IP protocol 50.
admin@PA-VM> debug dataplane packet-diag set capture stage receive file esp_capture_rx.pcap admin@PA-VM> debug dataplane packet-diag set capture stage transmit file esp_capture_tx.pcap admin@PA-VM> debug dataplane packet-diag set capture filter match source <local_external_ip> destination <peer_external_ip> protocol 50 admin@PA-VM> debug dataplane packet-diag set capture filter match source <peer_external_ip> destination <local_external_ip> protocol 50 admin@PA-VM> debug dataplane packet-diag set capture filter on admin@PA-VM> debug dataplane packet-diag set capture on -
Capture traffic inside the tunnel (unencrypted): Capture on the Tunnel Interface.
admin@PA-VM> debug dataplane packet-diag set capture interface tunnel.<id> onThen apply filters for the interesting traffic.
-
-
Start the Capture:
-
For
debug ike pcap on, it starts immediately. The file ismp-log ikemgr.pcap. -
For
debug dataplane packet-diag, after setting filters, use:admin@PA-VM> debug dataplane packet-diag set capture on
-
For
- Replicate the Issue: Trigger the VPN negotiation or send traffic that is failing.
-
Stop the Capture:
-
debug ike pcap off -
debug dataplane packet-diag set capture off
CRITICAL (Palo Alto Networks): Always disable packet captures after troubleshooting. Leaving them running, especially with broad filters, can consume significant CPU and disk resources, impacting firewall performance. -
-
View/Export the Capture:
-
For
ikemgr.pcap:admin@PA-VM> view-pcap no-dns-lookup yes no-port-lookup yes debug-pcap ikemgr.pcap -
For dataplane captures (e.g.,
ike_capture_rx.pcap):admin@PA-VM> view-pcap no-dns-lookup yes no-port-lookup yes dataplane-debug <filename.pcap> -
Export for Wireshark: Use TFTP, SCP, or export through the PAN-OS web interface (
Device > Support > Generate Tech Support File
often includes recent pcaps, or use CLI to export directly).
admin@PA-VM> scp export debug-pcap from ikemgr.pcap to user@host:path
admin@PA-VM> scp export dataplane-debug-pcap from <filename.pcap> to user@host:path
-
For
Analyzing Packet Captures
-
IKE (UDP 500/4500):
- Look for IKE negotiation messages (e.g., Main Mode/Aggressive Mode exchanges for IKEv1; IKE_SA_INIT, IKE_AUTH for IKEv2).
- Verify source and destination IPs and ports.
- Check payloads for proposals (encryption, hash, DH group, auth). Wireshark can dissect IKE packets if the PSK or private keys (for certificate auth) are known, though this is complex. Often, you're looking for which side sends a "Notification" payload like "NO_PROPOSAL_CHOSEN" or "INVALID_KEY_INFO."
-
ESP (Protocol 50 or UDP 4500 encapsulated):
-
Verify SPI values match what's shown in
show vpn ipsec-sa. - If traffic is flowing one way but not the other, ESP packets might be lost or blocked en route.
- Encrypted ESP payload cannot be read without decryption keys, but presence/absence and sequence numbers can be informative.
-
Verify SPI values match what's shown in
-
Decrypted Traffic (captured on Tunnel Interface):
- Verify if the correct unencrypted traffic is entering the tunnel on one side and exiting on the other.
- Helps isolate issues to routing or policies on either side of the VPN *after* decryption/before encryption.

Palo Alto Networks IPSec VPN Traffic Flow: This diagram illustrates the logical path of a packet traversing a route-based IPSec VPN tunnel between two Palo Alto Networks firewalls. It shows key processing steps including routing, security policy checks, encryption/decryption, and the role of the tunnel interface.
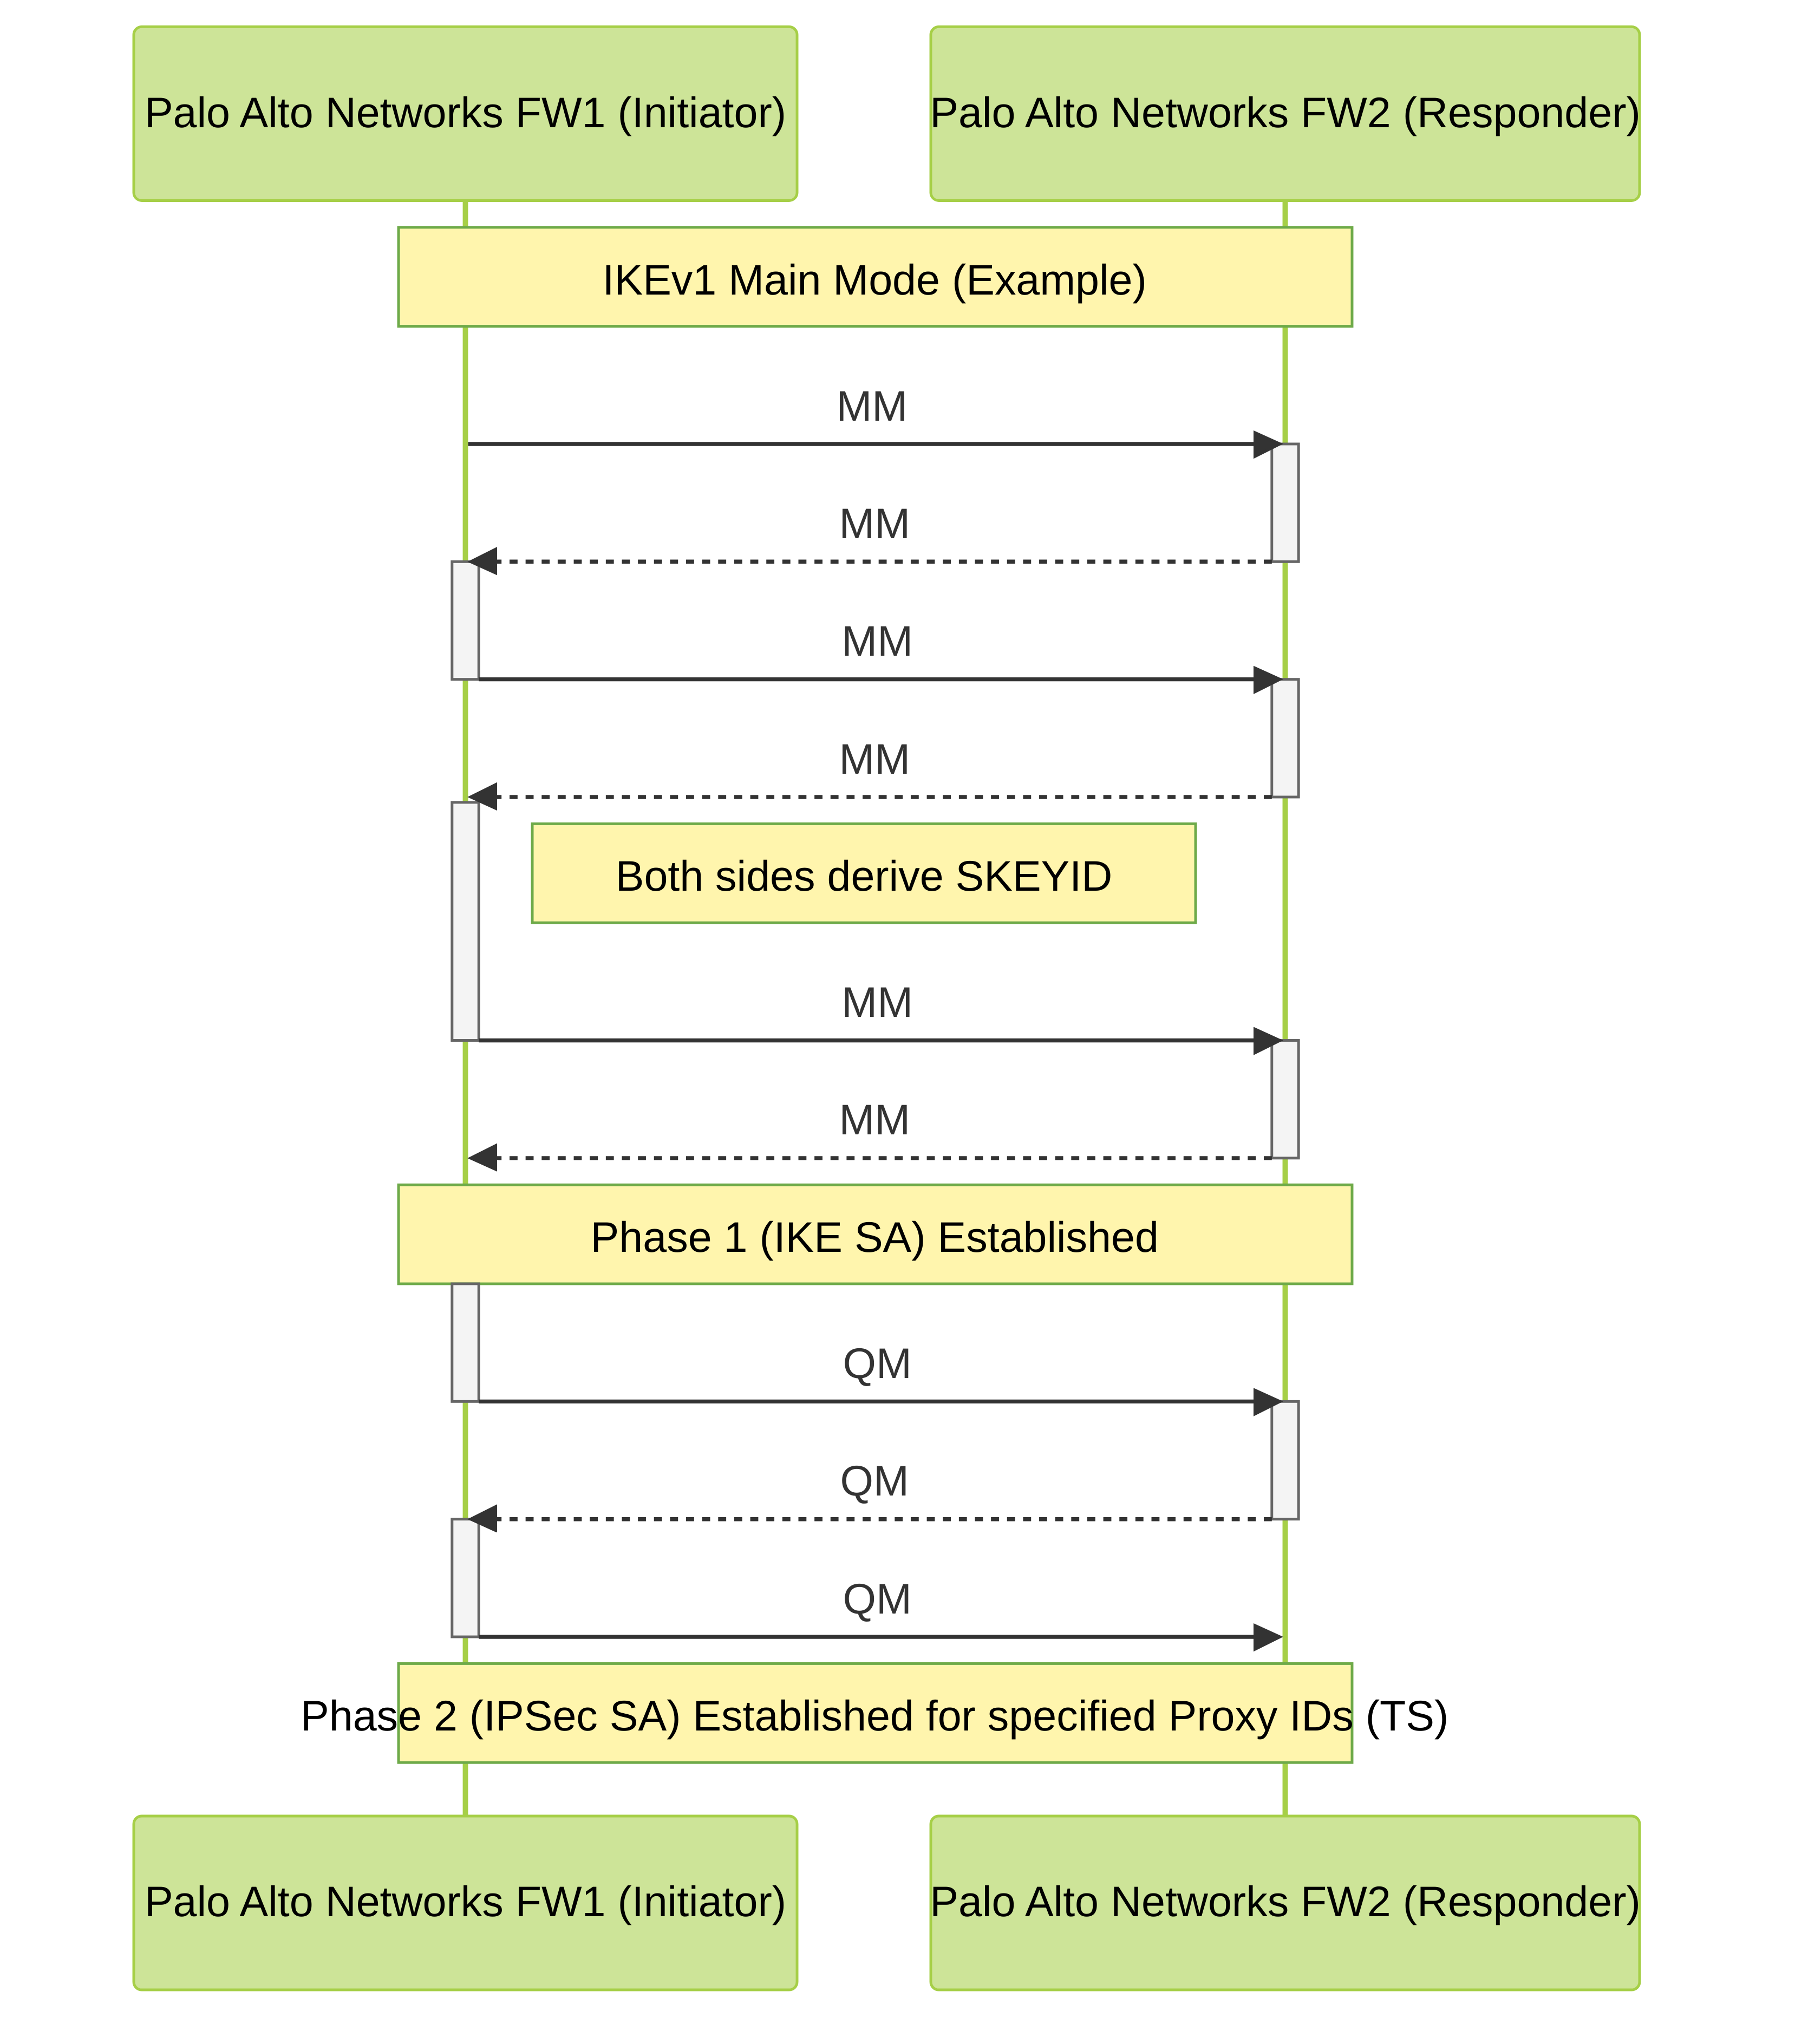
Palo Alto Networks IKEv1 Main Mode Negotiation Flow: This sequence diagram illustrates the six messages exchanged during IKEv1 Main Mode for establishing Phase 1, followed by the three messages for Quick Mode establishing Phase 2. This is a common negotiation type for site-to-site VPNs on Palo Alto Networks firewalls. "TS" refers to Traffic Selectors (Proxy IDs).
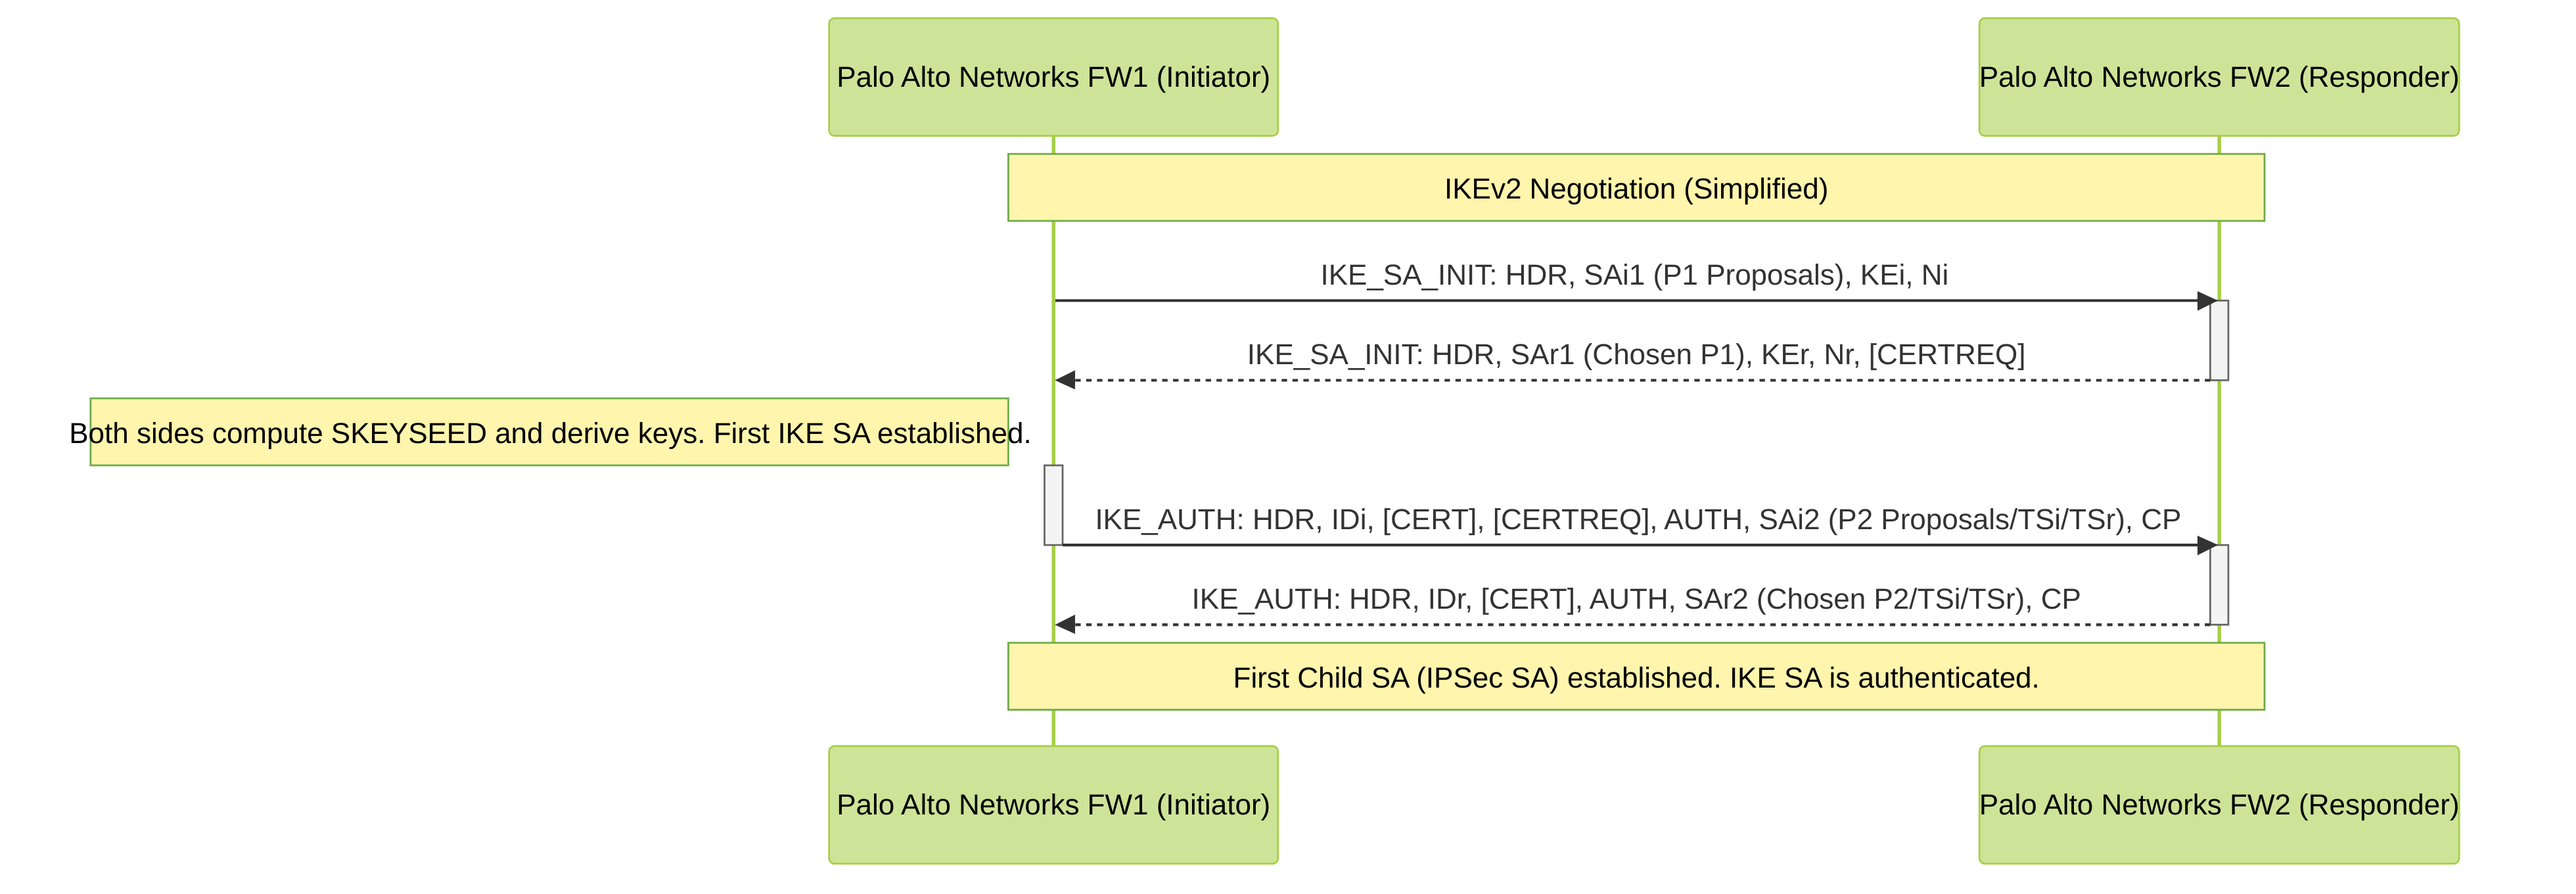
Palo Alto Networks IKEv2 Negotiation Flow: This sequence diagram shows the simplified two-exchange (four-message) process for IKEv2. The IKE_SA_INIT exchange establishes a secure channel and the IKE_AUTH exchange authenticates the peers and creates the first Child SA (IPSec SA). Palo Alto Networks firewalls support both IKEv1 and IKEv2.
5. Advanced Troubleshooting Considerations for Palo Alto Networks VPNs
-
Global Counters:
Use
show counter global filter packet-filter yes delta yes aspect vpnfor a wealth of real-time statistics related to VPN processing, including errors like encrypt/decrypt failures, auth failures, replay attacks, etc. Theaspect vpnnarrows down the counters specific to VPN operations. -
Session Browser and Flow Basic:
-
show session id <session_id>: If you can identify a specific session ID for traffic that *should* be going over the VPN, this command will show how the firewall is processing it, including ingress/egress interface, NAT translations (if any), and if it's being encrypted (look for 'encap ID' or 'decap ID' for tunnel). -
show running KRT-route(from engineering mode, use with caution): Shows Kernel Routing Table, which can be useful for very deep routing troubleshooting.
-
- Panorama VPN Monitoring: If firewalls are managed by Panorama, it offers centralized monitoring of VPN tunnels across multiple devices. Panorama's ACC and log collection can provide an aggregated view of VPN health and traffic.
-
High Availability (HA) Scenarios:
- In an HA pair, VPN tunnels are typically configured on the active firewall. Ensure IKE Gateway and IPSec Tunnel configurations are synchronized.
- Tunnel Monitoring is crucial for HA failover decisions if VPN uptime is critical.
- During failover, SAs need to be re-established. IKEv2 is generally faster at re-establishing SAs than IKEv1.
-
Check
show high-availability stateand relevant HA logs if VPNs fail after an HA event.
-
GlobalProtect and Remote Access VPNs:
While this guide focuses on Site-to-Site, many principles apply. GlobalProtect adds layers of User-ID, client software, and portal/gateway configurations. Troubleshooting often involves checking GlobalProtect logs on both the client and the firewall (
gplog.log,PanGPS.logon client; System logs, User-ID logs, GlobalProtect logs on firewall). - SD-WAN VPNs: Palo Alto Networks SD-WAN solution leverages IPSec tunnels. Troubleshooting involves standard IPSec checks plus SD-WAN specific path quality monitoring and traffic distribution policy verification.