GlobalProtect
View a Graphical Display of GlobalProtect User Activity in PAN-OS
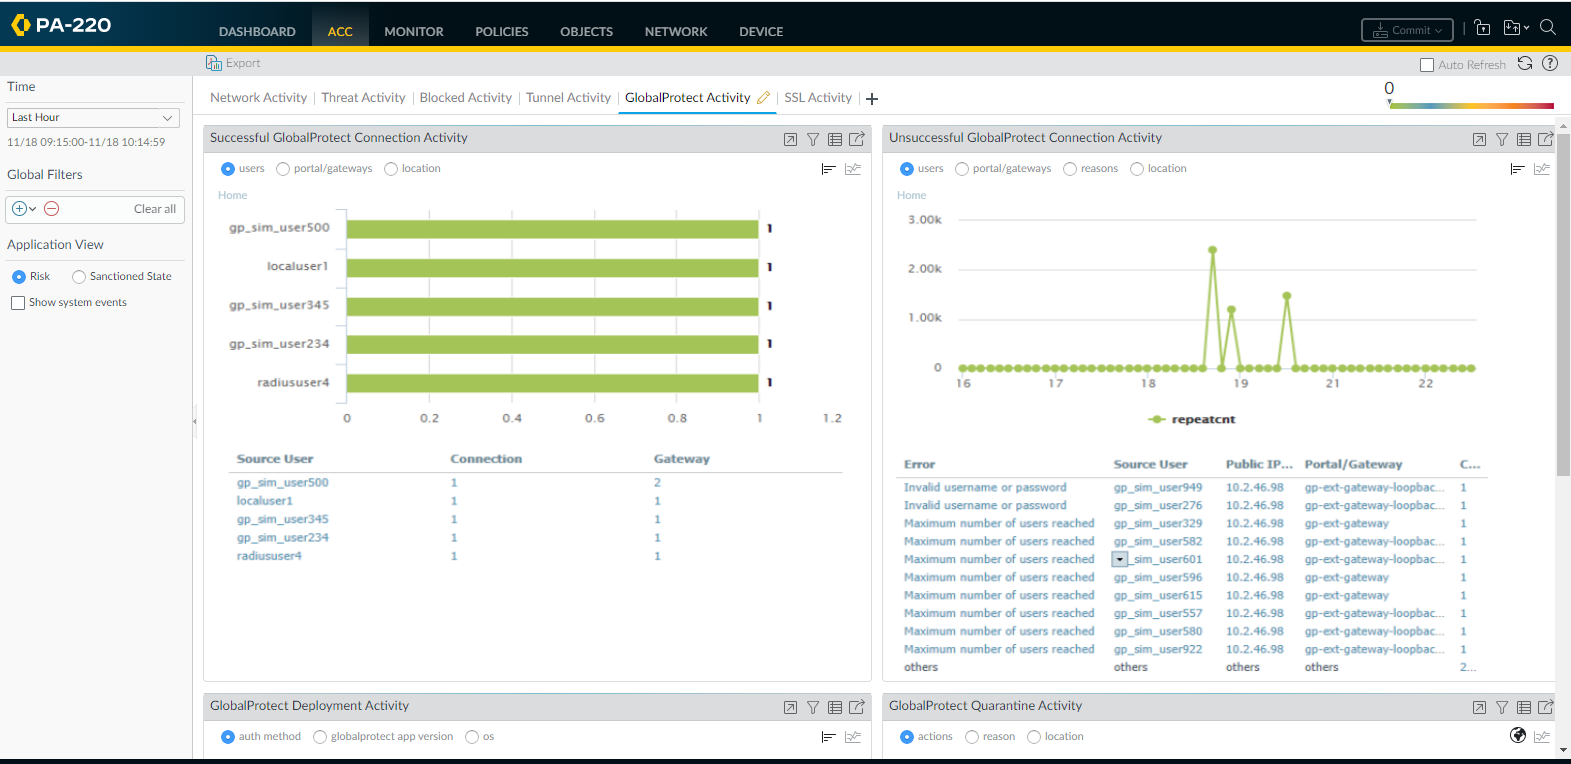
The Application Command Center (ACC) in PAN-OS displays a graphical view of user activity in your GlobalProtect deployment on the GlobalProtect Activity tab.
The GlobalProtect Activity charts and graphs are interactive and support similar drill-down functionality to other ACC charts and graphs.
- In PAN-OS, select ACCGlobalProtect Activity .
- View the charts as follows:
- Successful GlobalProtect Connection Activity —Chart view of GlobalProtect connection activity over the selected time period. Use the toggle at the top of the chart to switch between connection statistics by users, portals and gateways, and location.
- Unsuccessful GlobalProtect Connection Activity —Chart view of unsuccessful GlobalProtect connection activity over the selected time period. Use the toggle at the top of the chart to switch between connection statistics by users, portals and gateways, and location. To help you identify and troubleshoot connection issues, you can also view the reasons chart or graph. For this chart, the ACC indicates the error, source user, public IP address and other information to help you identify and resolve the issue quickly.
- GlobalProtect Deployment Activity —Chart view summary of your deployment. Use the toggle at the top of the chart to view the distribution of users by authentication method, GlobalProtect app version, and operating system version.